Key Points
EBV latency III B cells display an immunosuppressive profile similar to Bregs.
They repress proliferation of T cells and promote expansion of cTregs and uTregs.
Expansion of Tregs depends on PD-L1 whose expression depends on the EBV oncogene LMP1.
Abstract
EBV infects and immortalizes B cells in vitro and in vivo. It is the causative agent of most immune deficiency–related lymphoproliferative disorders and is associated with various lymphomas. EBV latency III–transformed B cells are known to express two immunosuppressive molecules, IL-10 and PD-L1, two characteristics of regulatory B cells (Bregs). In this study, we show that, in addition to secretion of the Breg immunosuppressive cytokines IL-10, IL-35, and TGF-β1, EBV latency III–transformed B cells were able to repress proliferation of their autologous T cells preactivated by CD2, CD3, and CD28. This inhibitory effect was likely caused by CD4+ T cells because EBV latency III–transformed B cells induced a strong proliferation of isolated autologous CD8 T cells. Indeed, EBV was able to promote expansion of autologous FOXP3+ CD39high CTLA4+, Helios+, GITR+, LAG3+ CD4 T cells (i.e., regulatory T cells [Tregs]). Two types of Tregs were induced: unconventional CD25neg and conventional CD25pos Tregs. These Tregs expressed both the latency-associated peptide (LAP) and the PD-1 receptor, two markers of functional Tregs. Expansion of both Treg subtypes depended on PD-L1, whose expression was under the control of LMP1, the main EBV oncogene. These results demonstrate that, like Bregs, EBV latency III–transformed B cells exhibit strong immunoregulatory properties. These data provide clues to the understanding of how after EBV primo-infection, EBV-proliferating B cells can survive in an aggressive immunological environment and later emerge to give rise to EBV-associated B cell lymphomas such as in elderly patients.
Introduction
The EBV infects ∼95% of the worldwide adult population. When EBV infects B cells, its linear dsDNA is circularized (EBV episome) in the nucleus, and the full range of EBV latent genes is transcribed. By subverting some key activation pathways, this latency program, called latency III or proliferation program, leads to immortalization of the infected B cells. For example, Epstein-Barr nuclear Ag 2 (EBNA2), which orchestrates the latency III/proliferation program, reroutes the Notch pathway by targeting the cellular RBP-Jκ DNA-binding factor. The viral latent membrane proteins LMP1 and 2A, whose expression is under the control of EBNA2, provides constitutive survival signals that mimic those of CD40 and the BCR, respectively (1).
Despite its B cell immortalization capability, EBV primo-infection is spontaneously resolved, either asymptomatically or after the symptomatic phase (infectious mononucleosis) due to a vigorous immune response. However, the EBV episome will never be eliminated by the host immune system. It remains hidden in the nucleus of memory B cells, resulting in the establishment of a life-long persistent infection after clinical resolution of the primary EBV infection. This demonstrates that some EBV-proliferating B cells can escape the host immune system. Any rupture of balance between the immune system of the host and the virus may lead to development of an EBV-associated cancer. EBV is the causative agent of immune deficiency–related lymphoproliferative disorders, such as posttransplant lymphoproliferative disorders and AIDS-associated B cell lymphomas (2, 3). EBV is associated with some solid tumors, such as gastric carcinomas or nasopharyngeal carcinomas, as well as with various lymphoproliferative disorders, including Hodgkin lymphoma (HL), Burkitt lymphoma (BL), or diffuse large B cell lymphomas (DLBCLs) of the elderly.
With others, we showed that EBV-proliferating B cells overexpressed PD-L1/CD274/B7H1, leading to decreased autologous anti-EBV cytotoxicity (4, 5). Secretion of the immunosuppressive IL-10 by EBV-infected B cells, either in vitro or in vivo during infectious mononucleosis or HL, was reported many years ago (6, 7). IL-10, a major factor of human B cell activation, proliferation, and differentiation (8), is also a key immunosuppressive cytokine of regulatory B cells (Bregs), a B cell subset that supports immunological tolerance (9, 10). Bregs contribute to immune suppression during various infectious diseases or in pathogenesis of autoimmune and neoplastic disorders (11–13). Breg properties are related to a variety of mechanisms, including secretion of anti-inflammatory and immunosuppressive molecules such as IL-10, IL-35, and TGF-β1, or expression of the immunosuppressive molecule PD-L1. Bregs are able to inhibit proliferation of effector T cells and can induce CD4-positive regulatory T cell (Treg) expansion (9, 10, 14).
In this study we explored the immunoregulatory potential of EBV latency III–transformed B cells, especially in connection with PD-L1. These cells expressed the Breg immunosuppressive cytokines IL-10 and TGF-β1 as well as the two subunits IL-12α and CD27β of IL-35. They were also able to repress proliferation of autologous activated T cells. Expressing PD-L1 in an LMP1-dependent manner, EBV latency III–transformed B cells were strong inducers of conventional Tregs (cTregs) and unconventional Tregs (uTregs) in a PD-L1–dependent manner. These features demonstrate that EBV-proliferating B cells have the ability to moderate the host immune response, which would explain why some of these cells constantly escape the anti-EBV immune response.
Materials and Methods
Cell culture conditions
EBV-negative BL cell lines BL2 and BL41 and their EBV-positive counterparts, BL2B95.8 and BL41B95.8, as well as the lymphoblastoid cell lines (LCLs) RUD and PRI and the atypical BL cell line P3HR1 were cultured at 37°C in a humidified 5% CO2 atmosphere in RPMI 1640 medium (Life Technologies, BRL-Life Technologies Cergy-Pontoise, France) supplemented with 10% decomplemented FCS (Clontech, Palo Alto, CA), 50 IU/ml penicillin, 50 μg/ml streptomycin, and 2 mM l-glutamine. Amino acids, vitamins, and pyruvate were added at supplier-recommended concentrations (all from Life Technologies, Carlsbad, CA). Samples from healthy subjects were obtained from the Centre de Ressources Biologiques of the University Hospital Center of Limoges after their informed consent. New CD19- and CD20-positive LCLs (C0401, J1209, and N2803) were established and characterized by Genethon (Evry, France). They were cultured in the same conditions as the other cell lines. The EREB2.5 latency III inducible cell line (15) was cultured in the same conditions with addition of β-estradiol (1 μM). All cell lines were mycoplasma free (MycoAlert Mycoplasma Detection Kit; Lonza, Levallois, France).
Plasmid selection
Escherichia coli were transformed with luciferase (Luc), LMP1 wild type (LMP1-Wt), or LMP1CT PRT1 vectors (16, 17). Clones were selected, amplified in Luria–Bertani medium with ampicillin (100 ng/ml), and purified using the NucleoBond Xtra Midi Kit (Macherey-Nagel). EREB2.5 cells were transfected (20 × 106 cells for 20-μg vector in 500 μl of RPMI) with the Gene Pulser II Bio-Rad system (250 V, 400 μF) and selected with hygromycin (400 μg/μl).
Flow cytometry
For surface labeling, 500,000 cells were labeled for 15 min in 50 μl of PBS at room temperature in the dark. The different Abs and conjugated fluorochromes, as well as final dilutions are listed in Supplemental Table I. Cells were washed in PBS and fixed in 300 μl of PBS with 1% PFA. Intracellular FOXP3 and BMRF1 labeling were performed using the IntraPrep Permeabilization Reagent (Beckman Coulter, Pasadena, CA), according to the protocol recommended by the supplier (after surface labeling for 45 min in the dark at room temperature for FOXP3). Acquisition was performed on BD Biosciences flow cytometers: FACSCalibur for B cell labeling, FACSAria III for Treg labeling and LSRFortessa for the proliferation assay. Results were analyzed with Kaluza V3.1 (Beckman Coulter) or CellQuest Software (Becton Dickinson). Mean fluorescence intensity ratios were calculated as the mean fluorescence intensity of the relevant Ab on its isotypic control.
Proliferation and T cell activation
Cells were incubated with Violet Proliferation Dye 450 (VPD450; BD Biosciences) for 15 min at 37°C. After two washes, cells were resuspended in culture medium in the different test conditions. T cells were activated using the T cell activation expansion kit (particles conjugated to CD2, CD3, and CD28 mAbs; Miltenyi Biotec, Paris, France), according to the manufacturer’s protocol. After 5 d of culture, cells were washed, labeled with CD4-FITC and CD8-allophycocyanin-H7 mAbs for 15 min at room temperature, and analyzed by flow cytometry.
RNA extraction and real-time quantitative PCR
For RNA extraction, 106 cells were washed and resuspended in 500 μl of TRIzol (Life Technologies). Total RNA was extracted according to the manufacturer’s recommendations. Total RNA (2 μg) was retrotranscribed with the High-Capacity cDNA Reverse Transcription Kit (Applied Biosystems, Foster City, CA) according to the manufacturer’s protocol in 20 μl of final reaction volume. Reverse transcription was performed for 10 min at 25°C, 2 h at 37°C, and 5 min at 85°C. Quantitative mRNA expression of IL-10, TGF-β1, EBI3, IL12A, PD-L1, and HPRT1 was performed in duplicate with 6 ng of cDNA using the TaqMan Assay On Demand Gene Expression system (reference Hs00961622-m1, Hs00820148-g1, Hs01057148-m1, Hs01073447, Hs01125301-m1, and Hs02800695-m1, respectively; Life Technologies) on an ABI PRISM 7000 automat. Forward (F) and reverse (R) sequences of primers were F-5′-TGGAGCGTGCTTTGCTAGAG-3′ and R-5′-GGCCTGGTCTCCGTAGAAGAG-3′ for BNLF2A (18) and F-5′-GGACCCTGAAGCCAAAGACCA-3′ and R-5′-TCTCACACGGCAGGAACCTG-3′ for BCRF1. Each quantitative PCR was performed in triplicate. The ΔCT was calculated as the mRNA cycle threshold (CT), the HPRT1 CT (ΔCT). The ΔΔCT was calculated as previously described (19). The calculated relative mRNA expression level was equal to 2−ΔΔCT.
ELISA tests
To measure cytokine secretion (IL-10, TGF-β1, IL-27, and IL-12), cells were cultured at 0.4 × 10⁶ cells/ml for 48 h. Supernatants (50 ml) were concentrated by centrifugation (4000 × g for 30 min using Amicon Ultracel-10K [Millipore, Darmstadt, Deutschland]). ELISA tests were performed in triplicate following the manufacturer’s instructions: (human IL-10, human latent TGF, human IL-27, human IL-12 (p70); BioLegend, San Diego, CA).
Negative immunoselection of peripheral T lymphocytes
Samples from healthy subjects were half diluted in RPMI 1640 complemented with 10% FCS. PBMCs were recovered after separation on lymphocyte medium separation (Eurobio, Les Ulis, France). After washing in PBS, cells were resuspended in 500 μl of RPMI 1640 with a mixture of Abs against all PBMC subtypes except T cells (Human T Cell Isolation Kit; STEMCELL Technologies; Grenoble, France), following the kit’s instruction. The purity of recovered T cells was confirmed during experiments (samples with T cells alone).
Blocking by anti–PD-L1 mAb
Assays were performed by incubation of LCL B cells with their autologous T cells (B cell/T cell [B/T] ratio = 4) for 48 h in the absence of or with 10 μg/ml isotypic control (purified mouse IgG1, κ) or B7H1 blocking mAb (purified mouse mAb, clone MIH1; eBioscience).
Statistical analysis
Student t tests were performed with Excel Software.
Results
EBV latency III–transformed B cells display an immunoregulatory profile
To explore the immunoregulatory properties of the three new LCL EBV latency III–transformed B cells characterized by Genethon, we first looked at the transcriptional expression of two viral immunoevasines in EBV’s lytic phase: BCRF1 (which encode the viral homolog of IL-10, vIL10) and BNLF2A (involved in viral evasion from HLA class I–restricted T cell immunity). As shown in Supplemental Fig. 1, BCRF1 was highly expressed only in the J1209 LCL when compared with the B95.8 EBV-producing cell line, and BNLF2A was found to be expressed at low levels. No relationship was found between BCRF1 expression levels and the lytic cycle (assessed by expression of BMRF1, a DNA polymerase processivity factor essential for lytic virus replication) (Supplemental Fig. 1).
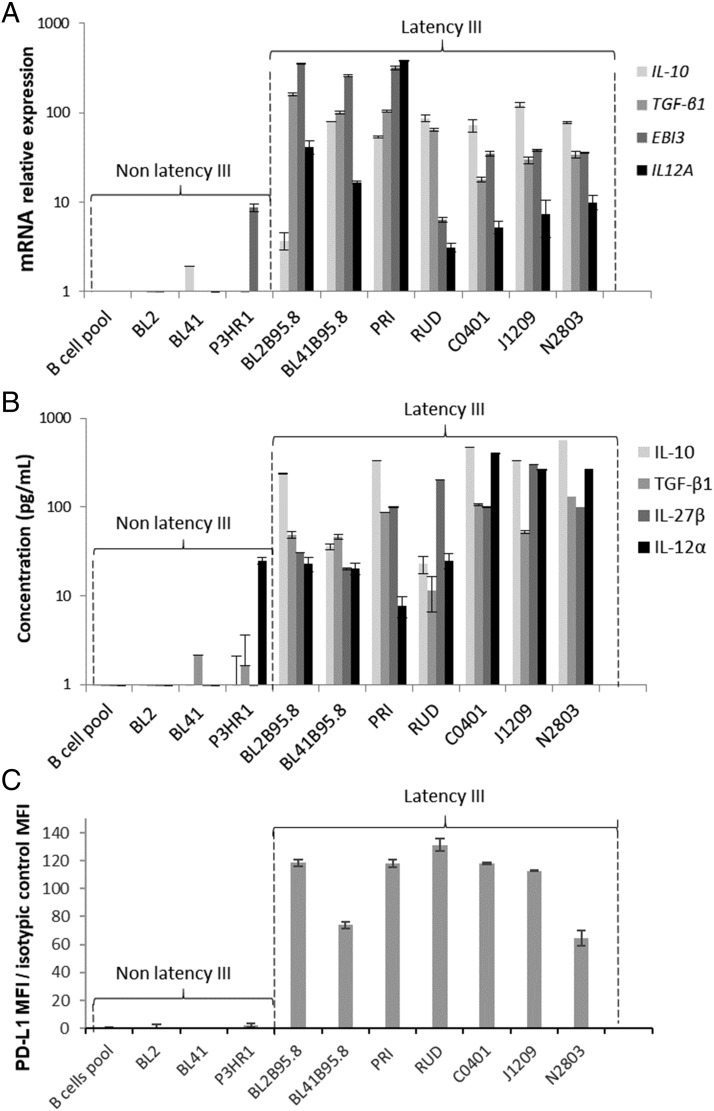
Expression of IL-10 by both EBV latency III B cells and Bregs is well known. Two other immunosuppressive cytokines have been reported to be secreted by Bregs: TGF-β (an inducer of PD-1 on T cells and Tregs) and IL-35 (composed of two subunits: IL-12α, encoded by the EBI3 gene and IL-27-β, encoded by the IL12A gene). Expression of IL-10 and TGF-β1, as well as expression of IL-35 subunits, was analyzed at the transcriptional level by reverse transcriptase quantitative PCR and at the secretory level in culture medium by ELISA on a series of five classical LCLs (the three C0401, J1209, and N2803 recently established LCLs plus two LCLs, established more than two decades ago (PRI and RUD) as well as two EBV-converted BL cell lines. As negative controls, we used the EBV-negative counterpart of EBV-converted BL cells, the P3HR1 cell line (EBNA2-negative, atypical EBV latency), as well as normal freshly isolated resting B cells (Fig. 1). As expected, all EBV latency III–transformed B cells expressed high levels of IL-10. Despite some variations between cell lines, all EBV-proliferating B cells (classical LCLs and EBV-converted BLs) also strongly overexpressed TGF-β1 and the two constitutive subunits of IL-35 at both transcriptional and secretory levels (Fig. 1A, 1B). As expected, EBV latency III–transformed B cells strongly expressed PD-L1 in comparison with controls (Fig. 1C). Expression of PD-L1 was also found on SCID tumors derived from either the three recent LCLs or the old LCL PRI (Supplemental Fig. 2).
FIGURE 1.
EBV latency III B cells overexpress Breg immunosuppressive molecules. Expression of IL-10, TGF-β1, and IL-35 was studied by reverse transcriptase quantitative PCR and ELISA. (A) mRNA expression of IL-10, TGF-β1, and IL-35 (EBI3 and IL12A genes) was increased in EBV latency III B cells. (B) Secretion of IL-10, TGF-β1, and IL-35 (IL-27β and IL-12α subunits) was increased in EBV latency III B cells. Expression of PD-L1 was studied by flow cytometry. (C) PD-L1 was overexpressed on EBV latency III B cells. Each experiment was performed at least four times.
EBV latency III–transformed B cells express PD-L1 in an LMP1-dependent manner
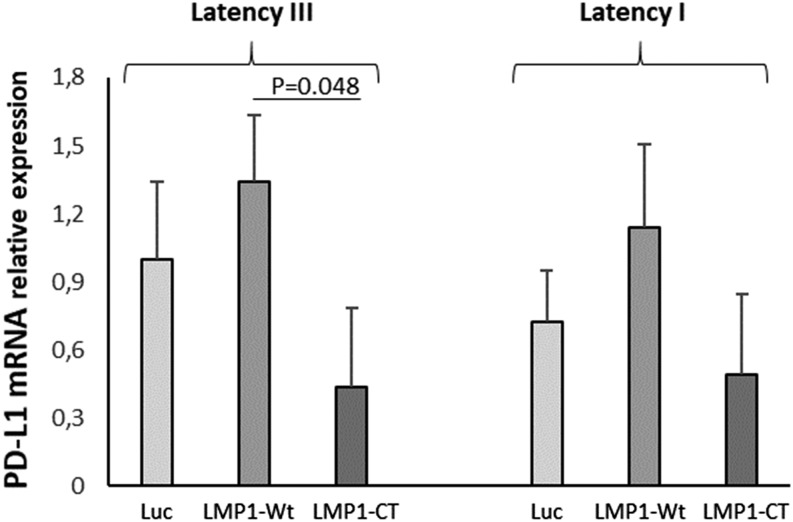
Transcriptome results suggested that PD-L1 expression during EBV latency III/proliferation program was mainly due to LMP1, the main EBV oncogene (unpublished data and ([20]). To confirm this result, the EREB2-5 cell line, an EBV latency III cell line that is estradiol conditional for EBNA2 activity (essential for the initiation of the latency III program expression) (21) was stably transfected with the doxycycline-regulatable PRT1 vector in which the cassette was a cDNA coding for either Luc, LMP1-Wt, or a dominant negative variant of LMP1, LMP1-CT (22). The simultaneous expression of the NGFRt cDNA by the PRT1 vector allowed selection of transfected cells. As shown in Fig. 2, estradiol withdrawal (resting cells expressing EBNA1 [i.e., latency I state]) decreased expression of PD-L1 (Fig. 2). Even if not statistically significant compared with the Luc assay, overexpression of LMP1-Wt increased PD-L1 expression either in the latency III or latency I state, whereas inhibition of LMP1 signaling by LMP1-CT decreased its expression. This is in agreement with the fact that PD-L1 expression was dependent of LMP1 presence. Additionally, we looked at gene expression of IL-10, TGF-β, EBI3, and IL-12Α and found that, although both IL-10 and EBI3 were induced by the latency III program, only EBI3 was under the dependence of LMP1 in this cellular model (Supplemental Fig. 3).
FIGURE 2.
EBV latency I and latency III B cells overexpress PD-L1 in a LMP1-dependent manner. Transcriptional expression of PD-L1 was studied in the EREB2-5 B cell line (latency I), which is inducible for the latency III program by addition of β-estradiol (1 μM). Cells were stably transfected to express Luc, LMP1-Wt, or LMP1-CT (dominant negative of LMP1). In latency I or III, PD-L1 expression was positively correlated with that of LMP1-WT and negatively correlated with that of LMP1-CT. Each experiment was performed at least three times.
EBV latency III–transformed B cells inhibit proliferation of their autologous T cells
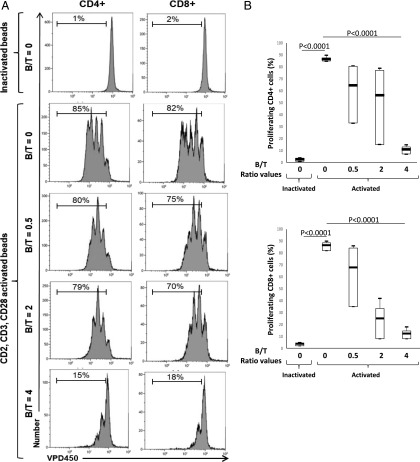
To determine whether EBV latency III–transformed B cells have immunoregulatory functions like Bregs, we assessed the ability of three (C0401, J1209, and N2803) recently established independent LCL cell lines to repress autologous T cell proliferation. T cells were stimulated or not with a mixture of beads coated with anti-CD2, anti-CD3, and anti-CD28 agonist mAbs (CD2/CD3/CD28 mixture), which mimics T cell stimulation by APCs (23) in the presence of their cognate EBV-proliferating B cells (B/T ratios ranging from 0 to 4). As expected, the anti-CD2/-CD3/-CD28 mixture strongly stimulated T cell proliferation (Fig. 3). At a B/T ratio between 0.5 and 2, proliferation of autologous CD4 and CD8 T cells was moderately and heterogeneously inhibited but with fewer proliferation cycles (Fig. 3). At a B/T ratio of 4, all three LCLs almost completely blocked proliferation of their autologous CD2-/CD3-/CD28-activated T cells. This inhibition of proliferation was comparable for both CD4 and CD8 T cells (Fig. 3B).
FIGURE 3.
Autologous EBV latency III B cells inhibit proliferation of both CD4+ and CD8+ T cells. Freshly isolated T cells were labeled with the VPD450 dye and incubated with either a mixture of beads coated with CD2, CD3, and CD28 mAbs (activated beads) or with inactivated beads in the absence of or with autologous EBV latency III B cells at B/T ranging from 0 to 4 on day five. Cells were labeled with anti-human CD4-FITC and anti-human CD8-allophycocyanin-H7 mAbs and analyzed by flow cytometry. (A) Examples of VPD450 fluorescence monoparametric histograms for CD4 and CD8 T cells. Each experimental condition is indicated at the left of the panel. Results show decreased proliferation of both CD4 and CD8 T cells in the presence of their cognate EBV latency III B cells (J1209). (B) Results for three different healthy subjects for CD4+ (upper panel) and CD8+ (lower panel) T cells. Altogether, results show decreased proliferation of both CD4 and CD8 T cells in presence of their cognate EBV latency III B cells.
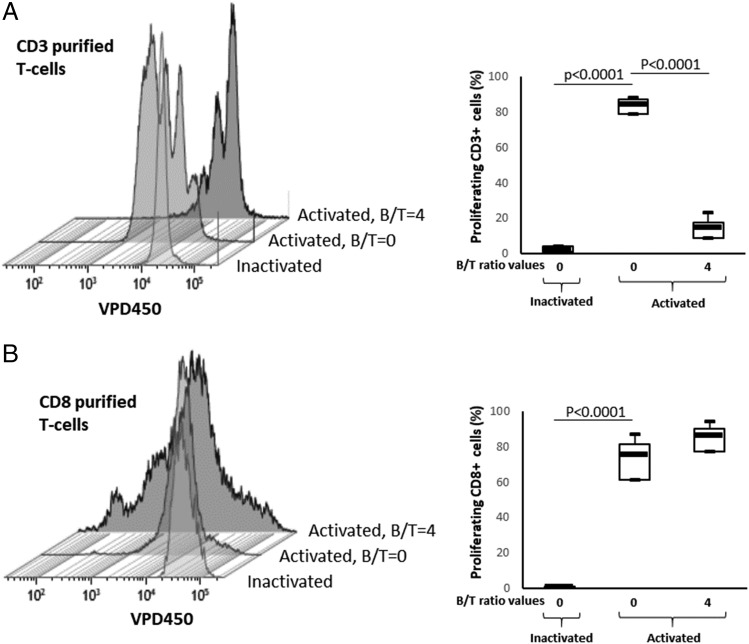
One of the major immunosuppressive mechanisms of Bregs is to favor Treg expansion. Various Treg subtypes have been described. In the view of possible expansion of Tregs, we compared the effect of EBV latency III LCLs on whole CD3+ T cells and their cognate-purified CD8+ T cells. Consistently with Fig. 3, EBV latency III LCLs repressed proliferation of whole cognate CD3+ T cells (Fig. 4A). By contrast, no inhibitory effect was seen when purified CD8+ T cells were coincubated with their cognate EBV latency III LCLs. On the contrary, the number of proliferation cycles was increased and, even if not statistically significant, the proliferation rate tended to be higher (Fig. 4B). This result indicates that EBV latency III LCLs kept a very strong activation power on their cognate CD8+ T cells and suggests that the inhibitory effect could be ascribed to CD4 T cells.
FIGURE 4.
EBV latency III B cells induce proliferation of isolated CD8+ T cells. Freshly isolated CD3+ or CD8+ T cells were labeled with the VPD450 dye and incubated with either a mixture of beads coated with CD2, CD3, and CD28 mAbs (activated beads) or with inactivated beads in the absence of or with autologous EBV latency III B cells (B/T = 4) on day five. Cells were analyzed by flow cytometry. (A) Examples of VPD450 fluorescence monoparametric histograms for CD3 T cells and results for three healthy subjects. (B) Examples of VPD450 fluorescence monoparametric histograms for CD8 T cells and results for three healthy subjects. Altogether, these results show that EBV latency III B cells decreased proliferation of cognate CD3 T cells as a whole, whereas EBV latency III B cells induce proliferation of isolated CD8+ T cells.
EBV latency III–transformed B cells promote expansion of both cTregs and uTregs
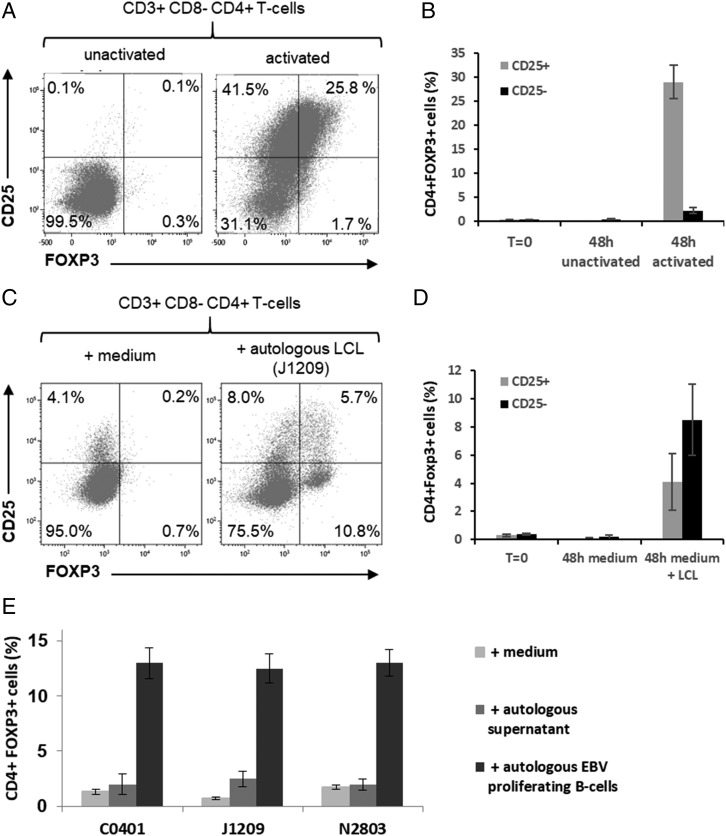
Tregs can be separated into two main subsets, those that are CD4+ FOXP3+ CD25+ cTregs and those that are CD4+ FOXP3+ CD25− uTregs. Expression of FOXP3 and CD25 is shared by both cTregs and activated T cells. Indeed, 48-h activation of freshly isolated primary T cells with anti-CD2/-CD3/-CD28 mixture resulted in coexpression of both FOXP3 and CD25 on CD4+ T cells, CD25 being highly induced (Fig. 5A, 5B). Coincubation of CD3+ T cells with their cognate LCLs led also to expansion of CD4+ FOXP3+ CD25+ T cells. But this expansion was moderate, and the expression pattern of FOXP3 and CD25 on these cells was different from activated T cells. Moreover, a significant expansion of CD4+ FOXP3+CD25− T cells was seen (Fig. 5C, 5D). These CD4+ FOXP3+ CD25− T cells were almost absent from CD2-/CD3-/CD28-activated T cells (compare Fig. 5A–D). Expansion of both CD4+ FOXP3+ CD25+ and CD25− T cells was hardly induced in the presence of autologous supernatants alone (Fig. 5E). Altogether, these results suggest that EBV latency III LCLs were able to induce expansion uTregs mainly and cTregs weakly and that expansion is likely to be due to B/T contact.
FIGURE 5.
Treg expansion by autologous EBV latency III B cells. (A and B) T cells from healthy donors were incubated with either a mixture of beads coated with CD2, CD3, and CD28 mAbs (activated beads) or with inactivated beads during 48 h. Cells were analyzed by flow cytometry. (A) Examples of FOXP3/CD25 fluorescence cytograms and (B) results for three healthy subjects. (C–E) T cells from healthy donors were incubated with culture medium (negative control) or supernatant containing or not cells of cognate autologous EBV latency III B cell lines (B/T = 4). After 48 h incubation, cells were labeled with the CD3-V500, CD4-FITC, CD8-allophycocyanin-H7, CD25-BV421, and FOXP3-PE panel and analyzed by flow cytometry for each experimental condition indicated in the legend. (C) Examples of FOXP3/CD25 fluorescence cytograms and (D and E) results for three different healthy subjects. These results show induction of FOXP3+, mainly CD25− CD4+ T cells after coculture with cognate EBV latency III B cells.
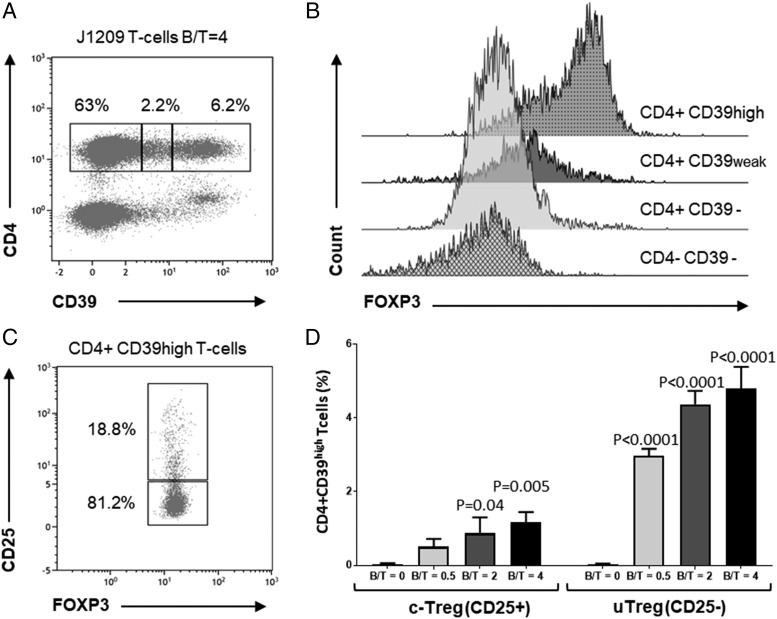
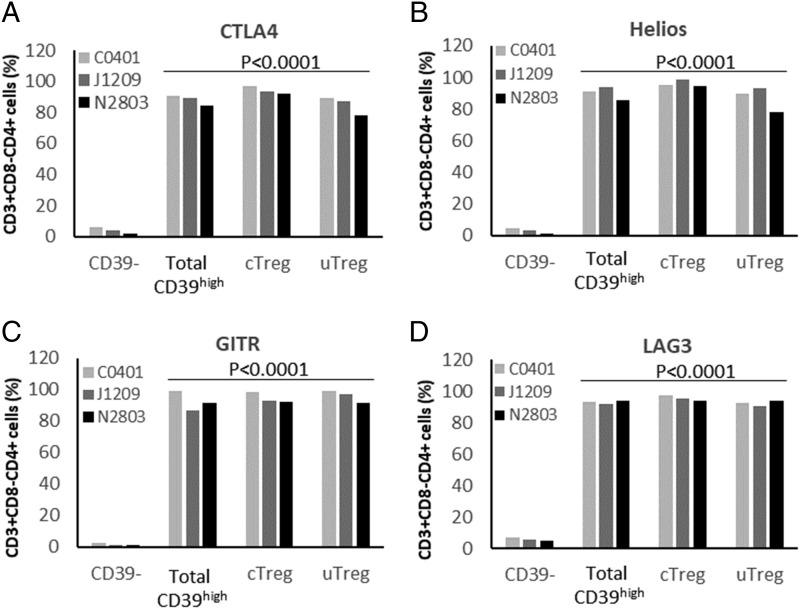
According to Zhou and colleagues (24), bona fide CD4+ FOXP3+ Tregs also express increased membrane CD39 levels. We thus evaluated FOXP3 expression on T cells induced by contact with EBV latency III B cells, according to their CD39 expression. As shown in Fig. 6, CD4+ T cells could be separated into three subsets according to CD39 expression: CD39−, C39weak, and C39high (Fig. 6A). FOXP3 expression was high in CD4+ C39high T cells, weak in CD4+ CD39weak T cells, and negative on CD39− T cells (Fig. 6B). Gating on CD4+ C39high T cells showed that most of them were FOXP3+ CD25−, whereas some were FOXP3+ CD25+ (Fig. 6C). Moreover, expansion of both CD25+ and CD25− CD4+ CD39high FOXP3+ T cells varied in the same manner as the ratio between EBV latency III B cells/autologous T cells (Fig. 6D). Tregs are also known to express CTLA4, IKZF2 (Helios), TNFRSF18 (GITR), and LAG3 molecules (25). These molecules were highly expressed by both CD25+ and CD25− CD4+ CD39high T cells (Fig. 7). Thus, EBV latency III LCLs appeared to induce expansion of both cTreg and uTreg compartments.
FIGURE 6.
cTregs and uTregs express both the FOXP3 and the CD39 key markers of Tregs. T cells from healthy donors were incubated with their cognate autologous EBV latency III B cell line (J1209) at a B/T ratio varying from 0 to 4. After 48 h incubation, cells were labeled with the CD3-V500, CD4-FITC, CD25-BV421, CD-39-allophycocyanin, and FOXP3-PE panel and analyzed by flow cytometry. (A) Example of CD4+ T cell distribution according to CD39 expression. Cells were analyzed on a CD39/CD4 biparametric histogram gated on CD3+ T cells. Three subpopulations were defined: CD39−, CD39weak, and CD39high. (B) Histograms of FOXP3 expression according to CD39 expression. CD4− CD39− T cells (corresponding to CD8+ CD39− T cells) were used as a negative control. CD39 and FOXP3 were clearly coexpressed. (C) Example of CD25 expression for FOXP3+ CD39high T cells. Cells were analyzed on a FOXP3/CD25 biparametric histogram gated on CD4+ CD39high T cells. Among FOXP3+ CD39high Tregs, the majority of cells were CD25− (uTregs), whereas some CD25+ cTregs were also induced. (D) Histograms showing the percentage of CD4+ CD39high, CD25−, or CD25+ T cells for increasing B/T ratios (ranging from 0 to 4). Number of both Treg subsets increased with B/T ratio; CD25− cells still remained the majority. Each experiment was performed at least three times.
FIGURE 7.
Both cTregs and uTregs express key markers of Tregs. T cells from healthy donors were incubated with their cognate autologous EBV latency III B cell line at a B/T ratio = 4. After 48 h incubation, cells were labeled with the CD3-V500, CD4-FITC, CD8-allophycocyanin-H7, CD25-BV421, CD-39-allophycocyanin, and CTLA4, Hélios, GITR, or LAG3-PE panel and analyzed by flow cytometry. The percentage of CD3+ CD4+ T cells expressing (A) CTLA4, (B) Hélios, (C), GITR, and (D) LAG3 among CD39−, CD39high (CD25+ or CD25−), CD39high CD25+ (cTreg) and CD39high CD25− (uTreg) subpopulation was analyzed for three healthy subjects. The four markers were significantly overexpressed comparatively to CD39− T cells.
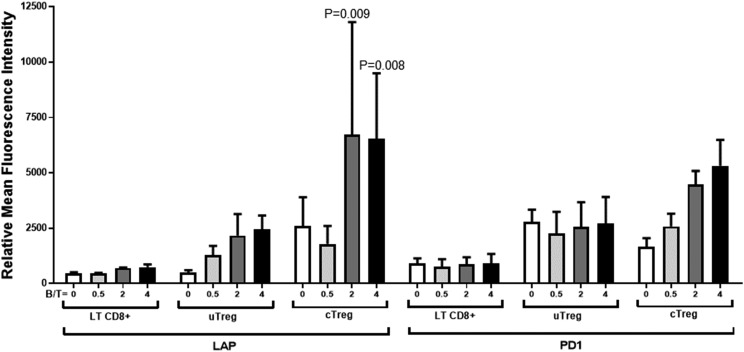
To assess whether EBV latency III–induced Tregs were functional, we tested the expression of both latency-associated peptide (LAP) (a propeptide that remains associated with mature TGF-β) and PD-1 on CD39high cTreg and uTreg subsets. CD8+ T cells were used as an internal control. Coincubation of EBV latency III B cells and autologous T cells induced moderate LAP expression on uTregs, (Fig. 8). PD-1 expression was found on uTregs even in the absence of EBV latency III B cells and was not influenced by addition of cognate B cells. This suggests that uTregs were constitutively but moderately active. By contrast, expression of both LAP and PD-1 was strongly induced on cTregs in a dose-dependent manner after coincubation with EBV latency III B cells. This shows that cTreg became strongly active in an inducible manner after coincubation with their cognate EBV latency III B cells.
FIGURE 8.
cTregs and uTregs express the inhibitory functional markers LAP and PD-1. T cells from healthy donors were incubated with their cognate autologous EBV latency III B cell line (C0401, J1209, N2803) at a B/T ratio varying from 0 to 4. After 48 h incubation, cells were labeled with the CD3-V500, CD4-FITC, CD8-allophycocyanin-H7, CD25-BV421, CD39-allophycocyanin, and PD-1–PE or LAP-PE panel. Cells were analyzed by flow cytometry. CD8+ CD39− cells were used as an internal control. LAP and PD-1 were increased on both uTregs and cTregs. Each experiment was performed at least three times.
Expansion of Tregs upon EBV latency III–transformed B cells depends on PD-L1
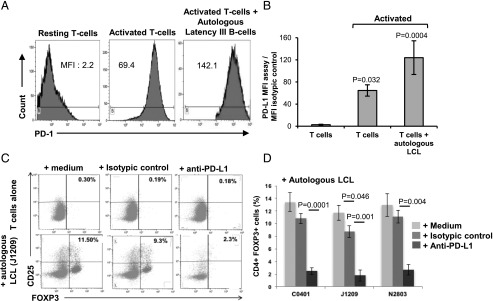
Because PD-1 was expressed on both cTregs and uTregs and EBV latency III B cells strongly expressed PD-L1, we next examined whether PD-L1 could play a role in the induction of CD4+ FOXP3+ T cell expansion by EBV-proliferating B cells. In fact, PD-1 expression was significantly increased after induction of proliferation by the anti-CD2/-CD3/-CD28 mixture, and even more so in the presence of autologous EBV-proliferating B cells (Fig. 9A, 9B). Furthermore, autologous T cells were incubated with either culture medium, an isotypic control, or a blocking anti–PD-L1 mAb in the presence or not of their cognate EBV latency III–infected B cells. Compared with culture medium, the isotypic control did not, or only very weakly, affect expansion by EBV-proliferating B cells, whereas CD4+ FOXP3+ T cell expansion was dramatically decreased in the presence of anti–PD-L1 blocking Ab (Fig. 9C, 9D), reaching levels close to those of supernatants alone (Fig. 5E). This result emphasizes that cTreg and uTreg expansion strongly depends on PD-L1 expression on LCLs.
FIGURE 9.
Inhibition of PD-L1–repressed Treg expansion induced by EBV latency III autologous B cells. (A) A representative example of PD-1 overexpression on T cells after CD2, CD3, and CD28 activation or in presence of cognate EBV latency III B cells J1209 (B/T = 4) compared with resting T cells. Monoparametric histograms of PD-1 expression were gated on CD4+ T cells by flow cytometry. (B) Histogram showing PD-1 expression for each experimental condition. Each experiment was performed on three different LCLs. (C) Example of FOXP3/CD25 biparametric histograms gated on CD4+ T cell after 48 h coculture of T cells in presence or not of their cognate autologous EBV latency III B cells with either medium alone, isotypic control, or anti–PD-L1–blocking mAb, (D) Histogram showing levels of CD4+ FOXP3+ T cells in each experimental condition for three healthy donors after 48 h incubation with autologous EBV latency III B cells. Blocking PD-L1 resulted in repression of FOXP3+ T cell expansion.
Discussion
In this study, we demonstrated that EBV-proliferating B cells exhibited strong immunoregulatory properties. They were able to repress proliferation of their cognate-activated T cells, express immunosuppressive cytokines and PD-L1 due to LMP1, and promote expansion of both cTregs and uTregs in a PD-L1–dependent manner.
The ability of some B cells to moderate the immune response has been ascribed to a particular subset, the Bregs. Bregs were first described as a specific B cell subset that moderates chronic inflammation in bowel disease in mice (26). Then they were described in humans some years later (27). Breg immunoregulatory properties are related to their ability to secrete immunosuppressive cytokines, mainly IL-10 (28) but also TGF-β (9, 29) and IL-35 (30). Taking into account the cytokine expression profile and the immunoregulatory functional properties, different immunophenotypic characteristics have been reported. A consensus on Breg properties and phenotype was published in 2015 (10). From this, it appeared that common characteristics of all Breg subsets are to repress proliferation of autologous T cells and to secrete IL-10. Bregs may also have the ability to orient T cell fate toward Treg expansion (29) From our results, it appears that strong similarities exist between EBV latency III–transformed B cells and Bregs.
CD39 expression is primarily expressed by immune-suppressive FOXP3+ Tregs (24, 31). FOXP3/CD39 coexpression has been reported on Tregs from patients with chronic infections such as coinfection by HIV and tuberculosis (32) or was correlated with the progression of HBV infection (33). This suggests some common features between persistent viral chronic infections. In this paper, we showed that EBV latency III B cells induced expansion of CD4 T cells that coexpressed both FOXP3 and CD39, strengthening the fact that EBV latency III B cells, like Bregs, were able to bias T cell fate toward Treg differentiation pathway.
EBV-proliferating B cells are highly immunogenic (34) and prone to CD95-induced apoptosis by cognate T cells (35). EBV latency III–immortalized B cells express high levels of IL-10, TGF-β1, IL-35, and PD-L1. Filtered cell supernatant from EBV-proliferating B cells marginally induced expansion of FOXP3-positive T cells, suggesting the requirement of a direct cell–cell contact. Nevertheless, it cannot be excluded that this effect was also related to release of exosomes from EBV-infected B cells. Indeed, Wada and colleagues (36) have shown that exosomes from malignant effusions could carry LAP-TGF-β that drive expansion of Tregs. In this study, we found that high levels of surface PD-L1 were under the dependence of LMP1. This result in latency III–transformed B cells is consistent with results reported on EBV-related NK/T lymphomas (37). Induction of Treg expansion by EBV latency III–transformed B cells was under the dependence of at least the PD-1/PD-L1 axis. PD-L1 moderates autologous cytotoxicity of CD8 T cells against these EBV-immortalized B cells (4). PD-L1 expression is deregulated in numerous cancers, including EBV-negative lymphomas (38, 39). PD-L1 dysregulation may be related to structural rearrangements of chromosome 9 in diffuse B cell non-HLs (40), a very strong genetic indication that tumor selection pressure favors transformed cells that are able to escape from immune surveillance. Increased PD-L1 expression is also found in EBV-negative or -positive HLs (41, 42). In breast cancer, PD-L1 expression is associated with poor patient prognosis (43). Expression of this immune checkpoint is associated with Tregs within the tumor for breast cancers. Several studies have reported that the PD-1/PD-L1 axis is implicated in the differentiation of Th1 cells into Tregs (44). Presence of intratumoral Tregs correlates with a poor prognosis for breast cancer (45). Immunotherapies targeting the PD-1/PD-L1 axis have proven to be effective for treatment of this cancer (46). The fact that expansion of Tregs by EBV latency III B cells depends on PD-L1 suggests a major role for this molecule in EBV immune escape.
Altogether, our results demonstrate that EBV-proliferating B cells have major intrinsic immunosuppressive properties, with a major role for PD-L1 in the induction of both uTregs and cTregs. Even if it has been largely demonstrated that the EBV burden is under the strict control of the host immune system, these results give clues to reasons why EBV-proliferating B cells are not definitively eliminated as for other viruses responsible for chronic infections, such as hepatitis B virus (47). These results could also shed some light on the reasons why EBV-positive DLBCLs occur on a more fragile background, such as in elderly patients, who are known to have an increased pool of Tregs (48) and decreased capacities to elaborate immune protection when vaccinated (49). Because of continuous NF-κB activation, either related to LMP1 expression for EBV or to mutations in the NF-κB–activating track for activated B cell–DLBCLs, both EBV-proliferating B cells and activated B cell–DLBCLs are phenotypically closed. Kiyasu and collaborators (50) showed the role of PD-L1 dysregulation in DLBCLs, which is correlated with poor prognosis. Our results raise the question whether these poor prognosis, aggressive B cell lymphomas could also mimic Bregs by modifying their immune microenvironment through, for example, secretion of immunosuppressive cytokines or promoting expansion of FOXP3+ Tregs.
Supplementary Material
Acknowledgments
We thank the Cytométrie et Imagerie platform for flow cytometry of the CNRS Research Federation 3503 (GEIST Institute) and Dr. Jeanne Cook-Moreau for careful English editing.
This work was supported by CNRS, Ligue Nationale contre le Cancer, Ligue Régionale contre le Cancer (Limousin), and Comité Orientation Recherche Cancer du Limousin.
The online version of this article contains supplemental material.
- BL
- Burkitt lymphoma
- Breg
- regulatory B cell
- B/T
- B cell/T cell
- CT
- cycle threshold
- cTreg
- conventional Treg
- DLBCL
- diffuse large B cell lymphoma
- F
- forward
- HL
- Hodgkin lymphoma
- LAP
- latency-associated peptide
- LCL
- lymphoblastoid cell line
- LMP1-Wt
- LMP1 wild type
- Luc
- luciferase
- R
- reverse
- Treg
- regulatory T cell
- uTreg
- unconventional Treg
- VPD450
- Violet Proliferation Dye 450.
Disclosures
The authors have no financial conflicts of interest.
References
- 1.Fields B. N., Knipe D. M., Howley P. M. 2007. Fields Virology. Wolters Kluwer Health/Lippincott Williams & Wilkins, Philadelphia. [Google Scholar]
- 2.Basgoz N., Preiksaitis J. K. 1995. Post-transplant lymphoproliferative disorder. Infect. Dis. Clin. North Am. 9: 901–923. [PubMed] [Google Scholar]
- 3.Ambinder R. F. 2001. Epstein-Barr virus associated lymphoproliferations in the AIDS setting. Eur. J. Cancer 37: 1209–1216. [DOI] [PubMed] [Google Scholar]
- 4.Durand-Panteix S., Farhat M., Youlyouz-Marfak I., Rouaud P., Ouk-Martin C., David A., Faumont N., Feuillard J., Jayat-Vignoles C. 2012. B7-H1, which represses EBV-immortalized B cell killing by autologous T and NK cells, is oppositely regulated by c-Myc and EBV latency III program at both mRNA and secretory lysosome levels. J. Immunol. 189: 181–190. [DOI] [PubMed] [Google Scholar]
- 5.Goodman A., Patel S. P., Kurzrock R. 2017. PD-1-PD-L1 immune-checkpoint blockade in B-cell lymphomas. Nat. Rev. Clin. Oncol. 14: 203–220. [DOI] [PubMed] [Google Scholar]
- 6.Sarris A. H., Kliche K. O., Pethambaram P., Preti A., Tucker S., Jackow C., Messina O., Pugh W., Hagemeister F. B., McLaughlin P., et al. 1999. Interleukin-10 levels are often elevated in serum of adults with Hodgkin’s disease and are associated with inferior failure-free survival. Ann. Oncol. 10: 433–440. [DOI] [PubMed] [Google Scholar]
- 7.Taga H., Taga K., Wang F., Chretien J., Tosato G. 1995. Human and viral interleukin-10 in acute Epstein-Barr virus-induced infectious mononucleosis. J. Infect. Dis. 171: 1347–1350. [DOI] [PubMed] [Google Scholar]
- 8.Itoh K., Hirohata S. 1995. The role of IL-10 in human B cell activation, proliferation, and differentiation. J. Immunol. 154: 4341–4350. [PubMed] [Google Scholar]
- 9.Rosser E. C., Mauri C. 2015. Regulatory B cells: origin, phenotype, and function. Immunity 42: 607–612. [DOI] [PubMed] [Google Scholar]
- 10.Mauri C., Menon M. 2015. The expanding family of regulatory B cells. Int. Immunol. 27: 479–486. [DOI] [PMC free article] [PubMed] [Google Scholar]
- 11.He Y., Qian H., Liu Y., Duan L., Li Y., Shi G. 2014. The roles of regulatory B cells in cancer. J. Immunol. Res. 2014: 215471. [DOI] [PMC free article] [PubMed] [Google Scholar]
- 12.Fillatreau S. 2016. Regulatory roles of B cells in infectious diseases. Clin. Exp. Rheumatol. 34(Suppl. 98): 1–5. [PubMed] [Google Scholar]
- 13.Ray A., Dittel B. N. 2017. Mechanisms of regulatory B cell function in autoimmune and inflammatory diseases beyond IL-10. J. Clin. Med. 6. [DOI] [PMC free article] [PubMed] [Google Scholar]
- 14.Rincón-Arévalo H., Sanchez-Parra C. C., Castaño D., Yassin L., Vásquez G. 2016. Regulatory B cells and mechanisms. Int. Rev. Immunol. 35: 156–176. [DOI] [PubMed] [Google Scholar]
- 15.Kempkes B., Pawlita M., Zimber-Strobl U., Eissner G., Laux G., Bornkamm G. W. 1995. Epstein-Barr virus nuclear antigen 2-estrogen receptor fusion proteins transactivate viral and cellular genes and interact with RBP-J kappa in a conditional fashion. Virology 214: 675–679. [DOI] [PubMed] [Google Scholar]
- 16.Bornkamm G. W., Berens C., Kuklik-Roos C., Bechet J.-M., Laux G., Bachl J., Korndoerfer M., Schlee M., Hölzel M., Malamoussi A., et al. 2005. Stringent doxycycline-dependent control of gene activities using an episomal one-vector system. Nucleic Acids Res. 33: e137. [DOI] [PMC free article] [PubMed] [Google Scholar]
- 17.Le Clorennec C., Ouk T.-S., Youlyouz-Marfak I., Panteix S., Martin C.-C., Rastelli J., Adriaenssens E., Zimber-Strobl U., Coll J., Feuillard J., Jayat-Vignoles C. 2008. Molecular basis of cytotoxicity of Epstein-Barr virus (EBV) latent membrane protein 1 (LMP1) in EBV latency III B cells: LMP1 induces type II ligand-independent autoactivation of CD95/Fas with caspase 8-mediated apoptosis. J. Virol. 82: 6721–6733. [DOI] [PMC free article] [PubMed] [Google Scholar]
- 18.Quinn L. L., Zuo J., Abbott R. J. M., Shannon-Lowe C., Tierney R. J., Hislop A. D., Rowe M. 2014. Cooperation between Epstein-Barr virus immune evasion proteins spreads protection from CD8+ T cell recognition across all three phases of the lytic cycle. PLoS Pathog. 10: e1004322. [DOI] [PMC free article] [PubMed] [Google Scholar]
- 19.Gabert J., Beillard E., van der Velden V. H. J., Bi W., Grimwade D., Pallisgaard N., Barbany G., Cazzaniga G., Cayuela J. M., Cavé H., et al. 2003. Standardization and quality control studies of ‘real-time’ quantitative reverse transcriptase polymerase chain reaction of fusion gene transcripts for residual disease detection in leukemia - a Europe against cancer program. Leukemia 17: 2318–2357. [DOI] [PubMed] [Google Scholar]
- 20.David A., Arnaud N., Fradet M., Lascaux H., Ouk-Martin C., Gachard N., Zimber-Strobl U., Feuillard J., Faumont N. 2017. c-Myc dysregulation is a co-transforming event for nuclear factor-κB activated B cells. Haematologica 102: 883–894. [DOI] [PMC free article] [PubMed] [Google Scholar]
- 21.Kempkes B., Spitkovsky D., Jansen-Dürr P., Ellwart J. W., Kremmer E., Delecluse H. J., Rottenberger C., Bornkamm G. W., Hammerschmidt W. 1995. B-cell proliferation and induction of early G1-regulating proteins by Epstein-Barr virus mutants conditional for EBNA2. EMBO J. 14: 88–96. [DOI] [PMC free article] [PubMed] [Google Scholar]
- 22.Adriaenssens E., Mougel A., Goormachtigh G., Loing E., Fafeur V., Auriault C., Coll J. 2004. A novel dominant-negative mutant form of Epstein-Barr virus latent membrane protein-1 (LMP1) selectively and differentially impairs LMP1 and TNF signaling pathways. [Published erratum appears in 2004 Oncogene 23: 8184.] Oncogene 23: 2681–2693. [DOI] [PubMed] [Google Scholar]
- 23.Chen L., Flies D. B. 2013. Molecular mechanisms of T cell co-stimulation and co-inhibition. [Published erratum appears in 2013 Nat. Rev. Immunol. 13: 542.] Nat. Rev. Immunol. 13: 227–242. [DOI] [PMC free article] [PubMed] [Google Scholar]
- 24.Zhou Q., Yan J., Putheti P., Wu Y., Sun X., Toxavidis V., Tigges J., Kassam N., Enjyoji K., Robson S. C., et al. 2009. Isolated CD39 expression on CD4+ T cells denotes both regulatory and memory populations. Am. J. Transplant. 9: 2303–2311. [DOI] [PMC free article] [PubMed] [Google Scholar]
- 25.Huang H., Ma Y., Dawicki W., Zhang X., Gordon J. R. 2013. Comparison of induced versus natural regulatory T cells of the same TCR specificity for induction of tolerance to an environmental antigen. J. Immunol. 191: 1136–1143. [DOI] [PubMed] [Google Scholar]
- 26.Mizoguchi E., Mizoguchi A., Preffer F. I., Bhan A. K. 2000. Regulatory role of mature B cells in a murine model of inflammatory bowel disease. Int. Immunol. 12: 597–605. [DOI] [PubMed] [Google Scholar]
- 27.Bouaziz J.-D., Yanaba K., Tedder T. F. 2008. Regulatory B cells as inhibitors of immune responses and inflammation. Immunol. Rev. 224: 201–214. [DOI] [PubMed] [Google Scholar]
- 28.Blair P. A., Noreña L. Y., Flores-Borja F., Rawlings D. J., Isenberg D. A., Ehrenstein M. R., Mauri C. 2010. CD19(+)CD24(hi)CD38(hi) B cells exhibit regulatory capacity in healthy individuals but are functionally impaired in systemic lupus erythematosus patients. Immunity 32: 129–140. [DOI] [PubMed] [Google Scholar]
- 29.Lee K. M., Stott R. T., Zhao G., SooHoo J., Xiong W., Lian M. M., Fitzgerald L., Shi S., Akrawi E., Lei J., et al. 2014. TGF-β-producing regulatory B cells induce regulatory T cells and promote transplantation tolerance. Eur. J. Immunol. 44: 1728–1736. [DOI] [PMC free article] [PubMed] [Google Scholar]
- 30.Egwuagu C. E., Yu C.-R. 2015. Interleukin 35-producing B cells (i35-Breg): a new mediator of regulatory B-cell functions in CNS autoimmune diseases. Crit. Rev. Immunol. 35: 49–57. [DOI] [PMC free article] [PubMed] [Google Scholar]
- 31.Borsellino G., Kleinewietfeld M., Di Mitri D., Sternjak A., Diamantini A., Giometto R., Höpner S., Centonze D., Bernardi G., Dell’Acqua M. L., et al. 2007. Expression of ectonucleotidase CD39 by Foxp3+ Treg cells: hydrolysis of extracellular ATP and immune suppression. Blood 110: 1225–1232. [DOI] [PubMed] [Google Scholar]
- 32.Angerami M. T., Suarez G. V., Vecchione M. B., Laufer N., Ameri D., Ben G., Perez H., Sued O., Salomón H., Quiroga M. F. 2017. Expansion of CD25-negative forkhead box P3-positive T cells during HIV and Mycobacterium tuberculosis infection. Front. Immunol. 8: 528. [DOI] [PMC free article] [PubMed] [Google Scholar]
- 33.Tang Y., Jiang L., Zheng Y., Ni B., Wu Y. 2012. Expression of CD39 on FoxP3+ T regulatory cells correlates with progression of HBV infection. BMC Immunol. 13: 17. [DOI] [PMC free article] [PubMed] [Google Scholar]
- 34.Tse E., Kwong Y.-L. 2015. Epstein Barr virus-associated lymphoproliferative diseases: the virus as a therapeutic target. Exp. Mol. Med. 47: e136. [DOI] [PMC free article] [PubMed] [Google Scholar]
- 35.Le Clorennec C., Youlyouz-Marfak I., Adriaenssens E., Coll J., Bornkamm G. W., Feuillard J. 2006. EBV latency III immortalization program sensitizes B cells to induction of CD95-mediated apoptosis via LMP1: role of NF-kappaB, STAT1, and p53. Blood 107: 2070–2078. [DOI] [PubMed] [Google Scholar]
- 36.Wada J., Onishi H., Suzuki H., Yamasaki A., Nagai S., Morisaki T., Katano M. 2010. Surface-bound TGF-beta1 on effusion-derived exosomes participates in maintenance of number and suppressive function of regulatory T-cells in malignant effusions. Anticancer Res. 30: 3747–3757. [PubMed] [Google Scholar]
- 37.Bi X. W., Wang H., Zhang W. W., Wang J. H., Liu W. J., Xia Z. J., Huang H. Q., Jiang W. Q., Zhang Y. J., Wang L. 2016. PD-L1 is upregulated by EBV-driven LMP1 through NF-κB pathway and correlates with poor prognosis in natural killer/T-cell lymphoma. J. Hematol. Oncol. 9: 109. [DOI] [PMC free article] [PubMed] [Google Scholar]
- 38.Gatalica Z., Bilalovic N., Vranic S., Arguello D., Reddy S., Ghosh N. 2015. PD-L1 and PD1 expression in lymphomas. Blood 126: 3899. [Google Scholar]
- 39.Xing W., Dresser K., Zhang R., Evens A. M., Yu H., Woda B. A., Chen B. J. 2016. PD-L1 expression in EBV-negative diffuse large B-cell lymphoma: clinicopathologic features and prognostic implications. Oncotarget 7: 59976–59986. [DOI] [PMC free article] [PubMed] [Google Scholar]
- 40.Chong L. C., Twa D. D. W., Mottok A., Ben-Neriah S., Woolcock B. W., Zhao Y., Savage K. J., Marra M. A., Scott D. W., Gascoyne R. D., et al. 2016. Comprehensive characterization of programmed death ligand structural rearrangements in B-cell non-Hodgkin lymphomas. Blood 128: 1206–1213. [DOI] [PubMed] [Google Scholar]
- 41.Chen B. J., Chapuy B., Ouyang J., Sun H. H., Roemer M. G., Xu M. L., Yu H., Fletcher C. D., Freeman G. J., Shipp M. A., Rodig S. J. 2013. PD-L1 expression is characteristic of a subset of aggressive B-cell lymphomas and virus-associated malignancies. Clin. Cancer Res. 19: 3462–3473. [DOI] [PMC free article] [PubMed] [Google Scholar]
- 42.Paydas S., Bağır E., Seydaoglu G., Ercolak V., Ergin M. 2015. Programmed death-1 (PD-1), programmed death-ligand 1 (PD-L1), and EBV-encoded RNA (EBER) expression in Hodgkin lymphoma. Ann. Hematol. 94: 1545–1552. [DOI] [PubMed] [Google Scholar]
- 43.Zhang M., Sun H., Zhao S., Wang Y., Pu H., Wang Y., Zhang Q. 2017. Expression of PD-L1 and prognosis in breast cancer: a meta-analysis. Oncotarget 8: 31347–31354. [DOI] [PMC free article] [PubMed] [Google Scholar]
- 44.Amarnath S., Mangus C. W., Wang J. C. M., Wei F., He A., Kapoor V., Foley J. E., Massey P. R., Felizardo T. C., Riley J. L., et al. 2011. The PDL1-PD1 axis converts human TH1 cells into regulatory T cells. Sci. Transl. Med. 3: 111ra120. [DOI] [PMC free article] [PubMed] [Google Scholar]
- 45.Li Z., Dong P., Ren M., Song Y., Qian X., Yang Y., Li S., Zhang X., Liu F. 2016. PD-L1 expression is associated with tumor FOXP3(+) regulatory T-cell infiltration of breast cancer and poor prognosis of patient. J. Cancer 7: 784–793. [DOI] [PMC free article] [PubMed] [Google Scholar]
- 46.Galanina N., Kline J., Bishop M. R. 2017. Emerging role of checkpoint blockade therapy in lymphoma. Ther. Adv. Hematol. 8: 81–90. [DOI] [PMC free article] [PubMed] [Google Scholar]
- 47.Rosenberg W. 1999. Mechanisms of immune escape in viral hepatitis. Gut 44: 759–764. [DOI] [PMC free article] [PubMed] [Google Scholar]
- 48.Chang C., Wu S.-Y., Kang Y.-W., Lin K.-P., Chen T.-Y., Medeiros L. J., Chang K.-C. 2015. High levels of regulatory T cells in blood are a poor prognostic factor in patients with diffuse large B-cell lymphoma. Am. J. Clin. Pathol. 144: 935–944. [DOI] [PubMed] [Google Scholar]
- 49.Nastoupil L. J., Sinha R., Flowers C. R. 2012. Management strategies for elderly patients with diffuse large B-cell lymphoma. Eur. Oncol. Haematol. 8: 123–126. [DOI] [PMC free article] [PubMed] [Google Scholar]
- 50.Kiyasu J., Miyoshi H., Hirata A., Arakawa F., Ichikawa A., Niino D., Sugita Y., Yufu Y., Choi I., Abe Y., et al. 2015. Expression of programmed cell death ligand 1 is associated with poor overall survival in patients with diffuse large B-cell lymphoma. Blood 126: 2193–2201. [DOI] [PMC free article] [PubMed] [Google Scholar]
Associated Data
This section collects any data citations, data availability statements, or supplementary materials included in this article.


