Comparing the neural transcriptomes of 5 phylogenetically independent pairs of monogamous and nonmonogamous vertebrates, Young et al. (1) claim to have found evidence for “a universal transcriptomic mechanism underlying the evolution of monogamy in vertebrates.” They state that “while evolutionary divergence time between species or clades did not explain gene expression similarity, characteristics of the mating system correlated with neural gene expression patterns.” Given the deep divergences among these clades, parallel evolution at the transcriptomic scale is highly unlikely, prompting us to reexamine their results.
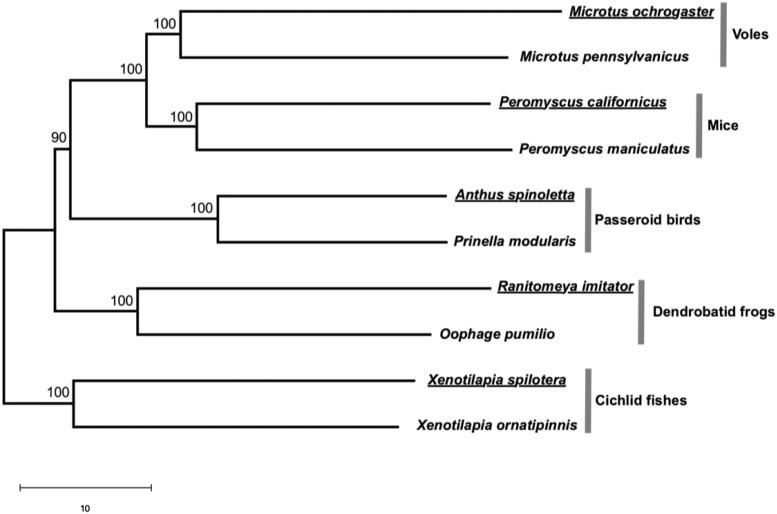
We followed a previous study (2) to compute the distance between each pair of transcriptomes on the basis of expression-level differences of orthologous genes and build a neighboring-joining tree of the 10 transcriptomes. Young et al.’s (1) conclusion means that the transcriptomes from the 5 monogamous species should be clustered in the tree, in exclusion of those from the nonmonogamous species. By contrast, we found that the transcriptome of each monogamous species is clustered with that of its nonmonogamous relative and that the neural transcriptome divergences followed the species phylogeny (Fig. 1).
Fig. 1.
Neighbor-joining (NJ) tree of the neural transcriptomes of the 10 species studied in Young et al. (1). Bootstrap percentages are placed on interior branches. Branch lengths are drawn to scale, and the scale bar below the tree shows 10 units in Euclidian distance. Names of monogamous species are underlined. Following ref. 2, for each gene i of species j, we converted the raw expression level Xij to the standardized expression level Yij = (Xij Xi)/Si, where Xi and Si are respectively the mean and SD of the expression level of gene i among the 10 species. We calculated the transcriptomic Euclidian distance between species j and k using the standardized expression levels of n = 1,979 genes by . Using standardized instead of raw expression levels equalizes the contributions of different genes to the distance. We then built the NJ tree using these distances. The confidence of the tree was assessed by bootstrapping all genes 100 times. The tree was inferred in R (4) and plotted by MEGA (5).
Despite the above finding, it is still of interest to identify individual genes that underwent concordant expression-level changes in the 5 monogamous lineages and test whether such genes are more numerous than the chance expectation. Young et al. (1) compared the expression levels of orthologous genes using DESeq2—a tool designed for testing differential gene expression between an experimental group and a control group (3)—by treating the 5 monogamous species as replicates in the experimental group and the 5 nonmonogamous species as replicates in the control group. This treatment is inappropriate because different species do not have the same expected expression levels and because the species are not independent from one another. Additionally, the DESeq2 analysis does not inform whether the number of significant cases exceeds the chance expectation, because even comparing 2 random groups of 5 species may yield some significant DESeq2 results.
To tackle the above problems, we directly compared the expression level of a gene between a monogamous species and its nonmonogamous relative. A gene is considered to have concordant expression changes in monogamous lineages if the expression ratio between the 2 species within each clade is ≥2—commonly considered a substantial expression change—and the direction of the expression difference is the same among all clades. This analysis identified 15 concordant genes. To examine whether this number exceeds the chance expectation, we switched the monogamous status between the 2 within-clade species for 1 or more clades (2), yielding a total of 15 distinct negative controls. The mean number of concordant genes in these controls is 7.2, while the maximum is 13. Thus, the observed number of concordant genes exceeds the random expectation (P < 1/15 = 0.067), but the excess is minute.
In conclusion, our reanalysis shows no transcriptome-wide parallel evolution in the repeated origins of vertebrate monogamy, although the neural expression levels of a very small number of genes may be generally associated with monogamy.
Footnotes
The authors declare no conflict of interest.
References
- 1.Young R. L., et al. , Conserved transcriptomic profiles underpin monogamy across vertebrates. Proc. Natl. Acad. Sci. U.S.A. 116, 1331–1336 (2019). [DOI] [PMC free article] [PubMed] [Google Scholar]
- 2.Yang J. R., Maclean C. J., Park C., Zhao H., Zhang J., Intra and interspecific variations of gene expression levels in yeast are largely neutral. Mol. Biol. Evol. 34, 2125–2139 (2017). [DOI] [PMC free article] [PubMed] [Google Scholar]
- 3.Love M. I., Huber W., Anders S., Moderated estimation of fold change and dispersion for RNA-seq data with DESeq2. Genome Biol. 15, 550 (2014). [DOI] [PMC free article] [PubMed] [Google Scholar]
- 4.R Development Core Team , R: A language and Environment for Statistical Computing (R Foundation for Statistical Computing, Vienna, 2010). [Google Scholar]
- 5.Kumar S., Stecher G., Li M., Knyaz C., Tamura K., MEGA X: Molecular evolutionary genetics analysis across computing platforms. Mol. Biol. Evol. 35, 1547–1549 (2018). [DOI] [PMC free article] [PubMed] [Google Scholar]


