

Abstract
HIV-1 protease (HIV-1-pr) plays an important role in viral replication and maturation, making it one of the most attractive targets for anti-retroviral therapy. To design new effective inhibitors able to combat drug resistance in mutant HIV-1-pr variants, it is essential to gain further understanding about the mechanisms by which the recently proposed inhibitors deactivate the mutant HIV-1-pr variants. In the present work, we explored the interactions between two P2-ligands (DRV, and one new derivative, 4UY) with wild type (WT) and two multiple mutant HIV-1-pr variants (p20 and p51) with all atom molecular dynamics (MD) simulations, binding free energy calculations, and principal component analysis (PCA). The trajectories of MD simulations show that both 4UY and DRV primarily bind with the active sites, flap and 80s loop regions of HIV-1-pr variants through either hydrogen bonds or hydrophobic interactions. More hydrogen bonds and hydrophobic interactions were located for 4UY/HIV-1-pr complexes than for DRV/HIV-1-pr counterparts. More importantly, 4UY was found to have an extra hydrogen bond with the backbone of Gly48′ in the flap region of the HIV-1-prs. The flap tip-tip distance (I50-I50′) and flap tip-active site distance (I50-D25 and I50′-D25′) indicate that the flaps turn more closed in 4UY bound HIV-1-prs than DRV bound ones, and the former also have more compact hydrophobic cavities than the latter. Further, the vector projections from PCA indicate that 4UY/DRV inhibitor binding projects the closing of flap in HIV-1-pr variants. In line with the above trajectory analysis, the thermodynamics calculation with MM-PBSA method suggests much stronger binding affinity for 4UY/HIV-1-pr than DRV/HIV-1-pr by 4.3-6.4 kcal/mol. Although p20 and p51 also induce weaker binding due to multiple mutants for 4UY inhibitor by 1.9-1.8 kcal/mol, their bindings to the new P2 ligand (4UY) are indeed significantly enhanced as compared to DRV. The thermodynamic components responsible for the binding differences and the contribution from key residues to the binding were also discussed in detail.
Keywords: HIV-1-pr, DRV, 4UY, molecular dynamics simulation, binding free energy, principal component analysis
Graphical Abstract

1. Introduction
Human immunodeficiency virus type 1 protease (HIV-1-pr), a retroviral aspartyl protease, is responsible for the production of viral enzymes and structural proteins critical to HIV viral maturation and infectivity. Thus, HIV-1-pr is an important target for HIV/AIDS therapy.1,2,3 The protease is a homodimer of two 99 amino acid subunits, and each monomer consists of one α-helix and two antiparallel β-sheets. Catalytic aspartic acid residues from two monomers, Asp25 and Asp25′, meet at the dimer interface and form the catalytic active sites.4,5 The active sites can be characterized as a channel of eight subsites (S4-S1 and S1′-S4′), each of which corresponds to an amino acid of the substrate (P4-P1 and P1′-P4′ from N to C terminals).6 One strategy to combat AIDS is to use protease inhibitors (PIs) to deactivate the actives sites and close the flap region of HIV-1-pr.
The second generation PI, DRV also known as TMC114, is one of the most potent one among nine FDA approved PIs. It has high antiviral activity and high genetic barrier to the generation of resistant viruses.7,8 It is speculated that the bis-THF oxygen atoms may form hydrogen bonds with the backbone N-H groups of residues Asp30 (Asp30′) of HIV-1-pr, enhancing the binding of the PI with HIV-1-pr.9 Thus, one of the major strategies to combat protease drug resistance is to design PIs that are able to promote hydrogen bonds with the backbone atoms in the active sites and/or flap region of HIV-1-prs.10 However, similar to the previous PIs drug resistance issues still exist on DRV for HIV-1-pr mutant variants, such as the single mutants like D30N and I50V.11,12 Recently, several HIV-1 patient-derived protease variants bearing multiple mutations like p20 and p51 also show high level of resistance to DRV.13,14,15,16,17
Very recently, a novel P2-ligand 4UY (Figure 1), amino-bis-tetrahydrofuran derivative chemically similar to DRV was suggested to improve the drug resistance of DRV.16,10 4UY was modified from DRV by introducing methylamine at P2 site C4 of bis-THF moiety and methoxy group replacing amine group in P2′ region. The new P2 ligand exhibits not only hydrogen bonds with S2 subsites (Asp29 and Asp30) but also hydrogen bond interactions with the backbone atoms in the flap region (Gly48/Gly48′) of wild type HIV-1-pr.16 The stronger interaction may enhance the potency for the new PI to deal with drug resistances. For this end the two multiple mutant HIV-1-pr variants in Figure 2 with highlighted mutated residues were intensively explored using two P2-ligands (DRV and 4UY), 16 where HIV-1DRVRP20, also known as p20, consists of 11 residue substitutions, and the other HIV-1DRVRP51 (p51) has 14 residue substitutions. 4UY shows active against two DRV-resistant HIV-1 variants (HIV-1DRVRP20 and HIV-1 DRVRP51) that were resulted from using the mixture of eight multidrug resistant HIV-1 variants as a starting viral population.18.
Figure 1.

(a) The HIV-1-pr structure in 4UY inhibitor-bound state (PDB ID: 5BRY), chains A and B in cyan and magenta colored cartoons, respectively. (b) Molecular structure of P2-ligands amino-bistetrahydrofuran derivative (4UY) and Darunavir (DRV/TMC114) with labelled P1, P2, P1′ and P2′ moieties.
Figure 2.

DRV-resistant HIV-1 variant p20 (HIV-1DRVRP20) with highlighted mutated residues.
In the present study, all atom molecular dynamics (MD) simulations were performed to provide a comprehensive understanding about drug resistance mechanism at a molecular level and to obtain detailed information about the binding of two chemically similar P2-ligands DRV and 4UY to wild type (WT) and mutant HIV-1-pr variants p20 and p51. In addition, to quantitatively binding free energies of DRV and 4UY to the WT HIV-1-pr and mutant variants were calculated using molecular mechanics/Poisson-Boltzmann surface area (MM-PBSA) method. The P2-ligands (DRV and 4UY) primarily bind with HIV-1-pr via hydrophobic interaction and hydrogen bonding. Further, principal component analysis (PCA) was performed to probe the difference in conformational changes induced by inhibitor binding. The combination of various computational techniques, such as MD simulation, MM-PBSA, PCA and decomposition analysis of interactions is able to offer new insights into the dynamic behavior, principal interactions, and binding mode of DRV and 4UY to the HIV-1-pr WT and mutant variants. This study can not only reveal the binding mode of P2-ligands against WT and mutant HIV-1-pr variants, but also provide significant dynamical information for designing potent inhibitors inhibiting the WT and mutant HIV-1-prs. Many groups explored the HIV-1 protease drug resistance using MD simulations and binding free energy analysis.19,20
2. System Preparation and Theoretical Methods
2.1. System Preparation and Molecular Dynamics Simulations
The crystal structures of WT HIV-1-pr complexed with DRV (PDB ID: 1T3R) and 4UY (PDB ID: 5BRY) were obtained from Protein Data Bank (PDB). Two DRV-resistant mutant variants (HIV-1DRVRP20 and HIV-1DRVRP51), the p20 variant with 11 substitutions (L10I/I15V/K20R/L24I/V32I/M36I/M46L/L63P/A71T/V82A/L89M) and p51 with 14 substitutions (L10I/I15V/K20R/L24I/V32I/L33F/M361/M46L/I54M/L63P/K70Q/V82I/I84V/L89M), were manually adapted from the crystal structures using PyMOL.21 In total, we have created three apo HIV-1-pr structures, three HIV-1-pr/DRV complexes, and three HIV-1-pr/4UY complexes. Because of the important effect of Asp25/Asp25′ on protease-ligand binding,22 a monoprotonated state was assigned to the oxygen atom OD2 of Asp25′ of the protease.23,24,25 AMBER14SB force field was assigned for HIV-1-prs.26 The structures of DRV and 4UY were optimized with Gaussian 09 program at HF/6-31G* level.27 Restrained electrostatic potential (RESP) charges and the general Amber force field (GAFF) were then assigned to the optimized structures with antechamber.28 Each system was solvated in a truncated octahedral box of TIP3P water molecules with a 12.0 Å buffer along each dimension.29 An applicable number of Cl− counterions were added to neutralize the systems.
For each system, energy minimization and MD simulation were performed using the GPU-supported pmemd module in AMBER16.30,31,32,33 Energy minimization was carried out in two steps. Water molecules were firstly minimized for 1000 steps of energy minimization with steepest descent method while keeping force constants over proteins and protein-ligand complexes. In the second stage of minimization, the entire system was energy minimized without positional restraints for 2000 steps with conjugate gradient method. Minimized systems were slowly heated to bring system’s temperature from 0K to 300K in NVT ensemble with time step of 2 fs. Systems were then equilibrated until pressure and density of systems were stabilized in NPT ensemble. Final production MD simulations were performed for 500 ns under NPT conditions. Berendsen thermostat was used in NPT ensemble with target pressure of 1 bar and pressure coupling constant of 2ps. During the MD simulations, all bonds involving hydrogen atoms were constrained using the SHAKE algorithm,34 and a time step of 2 fs was adopted. The Particle mesh Ewald (PME) method was used to calculate all of the long-range electrostatic interactions.35 The cutoff distances for the long-range electrostatic and van der Waals interactions were set to 10.0 Å. For temperature scaling, langevin dynamics was used with a collision frequency of 2 ps.
2.2. Principal Component Analysis (PCA)
PCA is an important tool for probing conformation changes of proteins.36,37 The cpptraj module was used for performing PCA.38 The collective motions of protein-ligand complexes were studied by using the positional covariance matrix C based on atomic coordinates and its eigenvectors. The elements of the positional covariance matrix C were determined by the equation as following.
| (1) |
where qi is Cartesian coordinate of the ith Cα atom, and N is the number of Cα atom considered. The average was over the equilibrated trajectory after superimposition on a reference structure to remove overall translations and rotations using a least-square fit procedure. The matrix C is symmetric and can be diagonalized by an orthogonal coordinate transformation matrix T, which transforms the matrix C into a diagonal matrix Λ of eigenvalues λi :
| (2) |
where the columns represent the eigenvectors corresponding to the direction of motion of relative to <qi>, and each eigenvector associated with an eigenvalue that describes the total mean-square fluctuation of the system along the corresponding eigenvector.
2.3. Binding Free Energy Calculations
The binding free energy of protein-ligand complexes were evaluated using MM/PBSA program in AMBER16. For each complex, 200 snapshots were extracted along MD trajectory from the last 100ns MD simulations with an interval of 500ps. The binding energy (ΔG) in condensed phase can be simply defined by the following equations.39,40
| (3) |
| (4) |
Where ΔG is the binding free energy in solution that consists of the molecular mechanics energy in the gas phase (ΔEMM), the solvation free energy (ΔGsol) and the conformational entropy effect due to the binding (TΔS)
| (5) |
Where ΔEvdw and ΔEele correspond to the van der Waals and electrostatic interactions in gas phase, respectively.
| (6) |
Where ΔGpb and ΔGnp are the polar and non-polar contributions to the solvation free energy, respectively. The ΔGsol is calculated with the PBSA module, where the dielectric constant is set to 1 inside the solute and 80.0 in the solvent. The nonpolar contribution of the solvation free energy is calculated as a function of the solvent accessible surface area (SASA), as follows:
| (7) |
Where, SASA was estimated using the MSMS program, with a solvent probe radius of 1.4 Å. The values of empirical constants γ and β were set to 0.000542 kcal mol−1 Å−2 and 0.92 kcal/mol, respectively.
The contribution of entropy (TΔS) to the binding free energy arises from changes in the translational, rotational and vibrational degrees of freedom, and was calculated by using classical statistical thermodynamics and normal mode analysis using the AMBER mmpbsa_py_nabnmode program.
Experimental binding free energies for the WT proteases were calculated from published inhibition constants Ki by the following equation:
| (8) |
The inhibition constants for HIV-1-pr/DRV and HIV-1-pr/4UY were obtained from King et al. and Ghosh et al. respectively.41,16,42 However, inhibition constants for the mutant variants were not available.
2.4. Residue-Inhibitor Interaction Decomposition
In order to understand the inhibitor-residue interaction in more detail, the interaction energy was further decomposed into the contributions from each residue of the protease. On account of the huge demand of computational resources for PB calculations, the interaction between DRV/4UY and each HIV-1-pr residue was computed using the MM-GBSA decomposition process applied in the mm_pbsa module in AMBER16.
Further, hydrogen bonds formed between HIV-1-pr and the inhibitors were analyzed using cpptraj in AMBER 16.38 A hydrogen bond was identified when the distance between proton donor and acceptor atoms is less than 3.5 Å and the angle of donor-H-acceptor greater than 120°. The occupancy of a hydrogen bond was computed by dividing the number of snapshots showing the hydrogen bond by the total number of snapshots along the MD trajectory. These methodologies were used for HIV-1-pr and inhibitors in previous publications.42,43
3. Results and Discussion
To discuss structural variation due to the inhibitors, 500ns explicit solvent MD simulations were initially performed for three apo HIV-1-pr variants (WT, p20 and p51), and WT and mutant HIV-1-pr variants complexed with 4UY/DRV were then explored.
3.1. Stability of apo HIV-1-pr and its interaction with 4UY/DRV inhibitor
To obtain information about the stability and evaluate the reliability of MD simulation, the root-mean-square deviation (RMSD) of the backbone atoms relative to the corresponding minimized structure was calculated. Figure 3a shows the RMSD over 500ns MD trajectories for apo proteases. WT has a slightly higher mean value (1.79 Å) than mutant variants, p20 (1.76 Å) and p51 (1.77 Å). The RMSDs of WT and mutant HIV-1-pr variant complexed with 4UY/DRV were plotted in Figures 3b and 3c, respectively. The ligand molecules remain in the active site without significant conformational changes in the HIV-1-prs. The p20 mutant variant binding with DRV shows higher variation and less stable as compared to other complexes, whereas the RMSD of p20/4UY reflects that the binding of p20 with 4UY tends to be stable throughout simulation. Mean RMSD value for p20/4UY does show improvement (1.65 Å) over p20/DRV (1.81Å), and is similar to those of WT/4UY and WT/DRV(~1.61 Å), and slightly better than p51/4UY and p51/DRV (1.67 Å). Overall, the results indicate that the binding of the inhibitors, especially 4UY stabilizes the conformation of the HIV-1-pr.
Figure 3.

Root-mean-square deviation (RMSD) plot for backbone atoms of WT and mutant HIV-1-pr variants and inhibitor complexes relative to their initial minimized structure as a function of time. (a) apo HIV-1-pr variants (b) WT and mutant HIV-1-pr variants bound to 4UY and (c) HIV-1-pr variants bound to DRV.
3.2. Flap flexibility in apo HIV-1-pr and its interaction with 4UY/DRV inhibitor
In order to check the flap flexibility in apo HIV-1-pr variants as well as the influence from 4UY/DRV inhibitors, the root mean square fluctuations (RMSFs) were calculated for individual residues (Figure 4). RMSF of backbone atoms may provide direct insights into the structural fluctuation and flexibility of different regions of HIV-1-pr variants. In line with the fact reflected by the above RMSD, Figure 4 shows that the apo structures have larger RMSF values than 4UY/DRV bound HIV-1-prs. The residues at active sites 24(24′)-29(29′) stay relatively rigid in both apo and inhibitor bound structures, whereas the flap region around 50(50′) in apo structures show high flexibility, but their RMSFs are significantly decreased in the 4UY/DRV bound structures due to the binding with the inhibitors. The 80s loop in chain A around residue 84 shows more rigid in 4UY/DRV bound structures than apo structures. The RMSF height of flap region of 4UY/DRV bound structures decreases by 1.1-1.2Å, indicating that inhibitor interaction (especially 4UY) with amino acid residue Gly48/48′ backbone binding considerably stabilizes the flap region.
Figure 4.

Root-mean-square fluctuation (RMSF) vs residue index for the WT HIV-1-pr and its mutant variants p20 and p51 (a) apo structures (b) HIV-1-pr/4UY complexes and (c) HIV-1-pr/DRV complexes. The residues in active site, flap region, and 80s loop region are highlighted in red, black and blue circles, respectively.
Active Site to Flap Tip Distances.
The inter-residue distances of D25-I50, D25′-I50′, and I50-I50′ have often been used to reflect the vertical and horizontal motion of flap regions. The active site to flap tip distance frequency distribution and time series plots were depicted in Figure 5 and Figure S1, respectively. Figure 5 shows that the distributions are significantly narrower in both 4UY (solid line) and DRV (dot line) bound structures than those of apo (dash line) structures. The binding of the inhibitors with HIV-I-prs compress the hydrophobic cavity. For chain A, the mean distances of the catalytic aspartate-flap tip (D25-I50) for DRV bound structures locate at around 13.8-14.1Å, smaller than those of 4UY bound complexes by 0.3-0.9Å oppositely in chain B the DRV bound structures locate at around 15.1-15.8 Å, much higher than 4UY bound complexes by 0.9-1.5Å. The results indicate that 4UY may bind more strongly to the residues in chain B as compared to apo and DRV bound HIV-1-pr structures.
Figure 5.
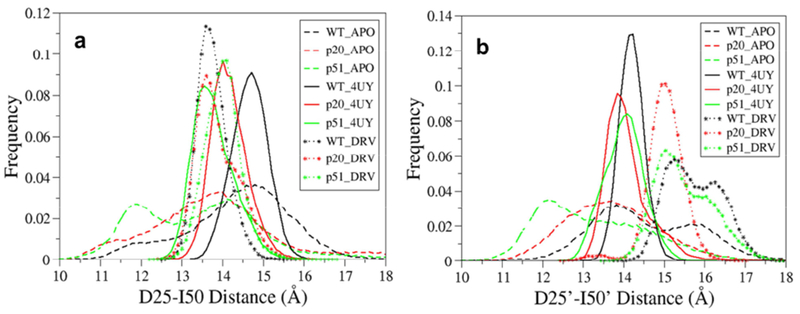
Histogram distribution of (a) D25-I50 Cα distance, and (b) D25′-I50′ Cα distance for the WT and mutant HIV-1-pr and its interaction with 4UY and DRV
Flap Tip-Flap Tip Distances.
To explore the relative motion of the flap tips, the distance between the two Cα atoms of I50 and I50′ is calculated. The frequency distribution and time series plot for I50-I50′ distance were shown in Figure 6 and Figure S2, respectively. The frequency distribution plot clearly shows that 4UY bound complexes have only single narrow peak around 6.0Å however, apo and DRV bound structures show two small peaks, one also being around 6.0Å and the other beyond 7.0 Å. The mean values of I50-I50′ for the apo structure are 7.35, 6.10, and 6.20 Å, whereas DRV bound structures show 6.78, 6.10, and 6.36 Å. There is a substantial decrease in distance for 4UY bound structures with mean values of 6.12, 6.10, and 6.20Å for WT, p20 and p51, respectively. The frequency distributions in Figure 6 as well as the mean values for I50-I50′ suggest that the binding of 4UY to HIV-1-prs leads to the flap tips less opened and tighter binding as compared to DRV bound and apo structures.
Figure 6.

Histogram distribution of I50-I50′ Cα distance for the WT and mutant HIV-1-pr and its interaction with 4UY/DRV.
3.3. Analysis of TriCa angle of apo HIV-1-pr and its interaction with 4UY/DRV inhibitor
To explain the flap dynamics behavior of proteins, Scott and Schiffer introduced the flap curling in and out that makes the flap open and close, respectively, in order to access the substrate/inhibitor.44 The frequency distribution and time series plots of TriCa angle (Gly48-Gly49-Ile50) were shown in Figure 7 and Figure S3, respectively. Analyzing the TriCa angle frequency distribution plot, it shows that the TriCa angle is narrower in 4UY bound structures compared to apo and DRV bound structures. The TriCa angle mean values are 135.7°, 137.8° and 138.7° for apo WT, p20 and p51, respectively. The TriCa angle 48-49-50 mean values are 135.0°, 137.9° and 141.0° for DRV bound structures, whereas 4UY bound structures shows 137.9°, 139.7° and 141.9° for WT, p20 and p51, respectively. The results indicate the stability of flap tip-flap tip distance in 4UY bound structures compared to apo and DRV bound structures.
Figure 7.

TriCa angle (Gly48-Gly49-Ile50) for the WT and mutant HIV-1-pr variants and its interaction with 4UY/DRV.
3.4. Principal Component Analysis (PCA)
To identify the overall patterns of motion on HIV-1-pr variants interacting with P2-ligands, we have used PCA to see the dominant motions observed during a simulation by visual inspection. The dominant movements defined by the first eigenvector are obtained by performing the PCA on the last 100ns MD trajectory of each system. The porcupine plots were drawn using the projections on principal component PC1 was shown in Figure 8. The arrow in each Cα atom represents the direction of motion, while the length of the arrow characterizes the movement strength. As seen in Figure 8, WT-4UY, p20-4UY, WT-DRV, and p20-DRV complexes show projecting mode towards closing the flap region; however, the p51-4UY and p51-DRV complexes project to opening the flap. In the WT-4UY and WT-DRV complexes, the flap elbows experience the largest movements among the different segments of the protease, as indicated by length of the vectors. Whereas in mutant variants bound to 4UY and DRV, the protease move as a whole in and outward/inward manner, as indicated by the vectors. The results signify that 4UY/DRV inhibitor binding project the closing of flap in HIV-1-pr.
Figure 8.

Collective motions corresponding to PC1 obtained by performing principal component analysis on MD simulation trajectory from the last 100 ns. (a) WT HIV-1-pr/4UY (b) p20 HIV-1-pr/4UY (c) p51 HIV-1-pr/4UY (d) WT HIV-1-pr/DRV (e) p20 HIV-1-pr/DRV (f) p51 HIV-1-pr-DRV complexes.
3.5. Binding Mode Analysis
Hydrogen bonds and hydrophobic contacts were shown in Figure 9 for the final snapshots from MD trajectories of complexes of DRV with WT and mutant HIV-1-prs. WT HIV-1-pr/DRV complex shows hydrogen bonds with Asp25, Asp25′, and Asp30′. Only two hydrogen bonds with Asp25 and Asp30′ exist for p20 and p51 mutant HIV-1-prs with DRV, and Asp25′ does not show clear hydrogen bond with DRV.
Figure 9.

The WT and mutant HIV-1-pr variants binding with DRV. (a) WT HIV-1-pr/DRV (b) p20 HIV-1-pr/DRV, and (c) p51 HIV-1-pr/DRV complexes. Ligplot showing hydrogen bonding and hydrophobic contacts of DRV with HIV-1-pr.
Both 3-dimensional and 2-dimensional plots for the 4UY complexed with WT, p20 and p51 HIV-1-prs were shown in Figures 10-12. There are considerably more hydrogen bonds and hydrophobic contacts than DRV complexes. The MD simulations and binding mode analysis clearly show that 4UY could be more potent against DRV-resistant HIV-1-pr variants. Specifically, according to Figure 10b the binding mode of 4UY with WT HIV-1-pr shows six hydrogen bonding interaction with residues Asp25/Asp25′, Gly27′, Asp29′, Asp30′, and Gly48′, and sixteen hydrophobic contacts with residues Asp25′, Arg8, Leu23, Gly27, Ala28, Asp30, Val32, Ile47, Gly48, Gly49, Ile50, Leu76, Val82, Ile84, Ala28′, and Pro81′, which locate at the active sites, flap and 80s loop regions, respectively. As shown in Figure 10a, the methoxy group in 4UY, which replaces the amine group of DRV at P2′ side, directly interact with the side group of Asp30 through van der Waals interaction, while the newly introduced methylamine as a donor forms a hydrogen bond with the backbone of Gly48′, which supports the binding mode analysis from the experimental studies.16 Table S2 confirms the hydrogen bond (N-H⋯O) between the methylamine of 4UY with the backbone oxygen of Gly48′ in an occupancy of 67% and an average distance of 2.95Å. In spite of the binding enhancement, the other advantage of the backbone binding lies in the minimal distortion of the protease backbone around the enzyme’s active site.16
Figure 10.

(a) The WT HIV-1-pr binding with 4UY. The amino acids interactions with 4UY are highlighted. (b) Ligplot showing hydrogen bonding and hydrophobic contacts of 4UY with WT HIV-1-pr.
Figure 12.

(a) The p51 HIV-1-pr binding with 4UY. The amino acids interactions with 4UY are highlighted. (b) Ligplot showing hydrogen bonding and hydrophobic contacts of 4UY with p51 HIV-1-pr.
In p20/4UY complex (Figure 11) the hydrogen bond with Gly27′ is absent, but the other five with Asp25, Ile50, Asp29′, Asp30′, and especially Gly48′ still remain. The detailed hydrophobic contacts, such as Arg8, Leu23, Gly27, Ala28, Asp30, Ile47, Gly48, Gly49, Leu76, Pro81, Ala82, Ile84, Leu23′, Asp25′, Gly27′, Ala28′, and Ile50′, are slightly different from WT-4UY complex. Figure 11a again clearly illustrates that 4UY interacts with the backbone of residue Gly48′ in p20 through a hydrogen bond of N-H⋯O, which has lower occupancy than that in the complex of 4UY and WT HIV-1-pr. In p51/4UY complex (Figure 12) there are only three hydrogen bonds with Asp25, Ile50, and Asp29′, and 14 hydrophobic contacts with Arg8, Gly27, Asp30, Ile47, Gly48, Gly49, Ile82, Leu23′, Asp25′, Gly27′, Ala28′, Gly48′, Ile50′, and Val84′. As compared with WT-4UY and p20-4UY complexes (Figures 10 and 11), in Figure 12 the hydrogen bond of the methylamine group of the P2-ligand with the backbone atoms of residue Gly48′ of p51 is not clearly shown. Hydrogen bond analysis does indicates that N-H⋯O between 4UY and Gly48′ of p51 has rather long distance (3.30Å) and low occupancy (43%).
Figure 11.

(a) The p20 HIV-1-pr binding with 4UY. The amino acids interactions with 4UY are highlighted. (b) Ligplot showing hydrogen bonding and hydrophobic contacts of 4UY with p20 HIV-1-pr.
In view of the important role of hydrogen bond, the hydrogen bond analysis between two P2-ligands (DRV and 4UY) and binding site residues of WT and mutant HIV-1-pr variants was performed. The type, distance, and occupancy of hydrogen bonds for DRV and 4UY were summarized in Tables S1 and S2, respectively. The water that makes bridges between inhibitor and flap tip residues Ile50/Ile50′ was observed and their distance and occupancy of hydrogen bonds were calculated. The amino acid residues Asp25, Asp30′, and Gly27′ show hydrogen bonds with DRV (Table S1). The amino residue Asp30′ show >90% occupancy with DRV. The hydrogen bonds with a high percentage of occupancy indicate that the interactions between amino acid residues and inhibitors are relatively strong. The hydrogen bond interactions between the HIV-1-pr variants and 4UY was shown in Table S2. Apart from binding in the active site region, it is observed that 4UY is shown stable hydrogen bond in the flap region, with the Gly48/Gly48′ of WT and mutant HIV-1-pr variants.
3.6. Binding Free Energy Analysis
The binding free energies for all DRV and 4UY bound complexes performed with the MM-PBSA method were summarized in Table 1 and Figure 13. The binding free energies (ΔG) of complexes WT-DRV, p20-DRV and p51-DRV are −13.77, −12.22, and −10.2 kcal/mol, respectively. Similar to a number of HIV-1-pr single mutants, the two groups of mutants also show binding affinity decrease, 1.55 kcal/mol for p20 and a significant decrease of 3.57 kcal/mol for p51. The weaker binding due to the mutations is responsible to their drug resistance. Consistent with the above binding mode analysis that more hydrogen bonds and more hydrophobic contacts than DRV complexes, the binding free energies of WT-4UY, p20-4UY, and p51-4UY complexes also tend to be −18.41, −16.52, and −16.63 kcal/mol, respectively, much stronger than DRV counterparts by 4-6 kcal/mol. The binding affinities of WT HIV-1-pr to DRV and 4UY are reasonably close to the available experimental values −15.20 and −16.23 kcal/mol.16 Though the two group mutants also induce weaker binding for inhibitor 4UY, the binding affinities decrease by only 1.89 kcal/mol for p20 and 1.78 kcal/mol for p51. And their binding to 4UY is even much stronger than the binding of WT to DRV, implying that the performance of 4UY may be improved in the aspect of the drug resistance for p20 and p51. A comparison of the free energy components between 4UY and DRV complexes in Table 1 indicates that the binding enhancement for inhibitor 4UY mostly arises from van der Waals energy (ΔEvdw) for all three complexes in a range of 6-13 kcal/mol. The polar contributions including electrostatic energy and polar solvation energy components(ΔEele + ΔGpol) oppositely weaken the binding, by ~3.4 kcal/mol for WT yet dramatically for p20 and p51 variants by ~5.2, and 9.2 kcal/mol, respectively. The nonpolar terms (ΔGnonpol) for all of the DRV and 4UY systems are similar within ~−5.7 to −6.2 kcal/mol. As a result (ΛH=ΔEvdw+ΔGele+ΔGpol+ΔGnonpol), the binding enthalpies for three 4UY complexes are stronger than those of DRV counterparts by 4.1, 3.1, and 3.7 kcal/mol for WT, p20 and p51 HIV-1-pr, respectively.
Table 1.
Binding free energies of HIV-1 PR-DRV and HIV-1 PR-4UY complexes computed by the MM-PBSA method. All energies are reported in kcal/mol.
| Componenta | Wild-DRV | p20-DRV | p51-DRV | Wild-4UY | p20-4UY | p51-4UY |
|---|---|---|---|---|---|---|
| ΔEvdw | −58.11 (0.23)d |
−56.32 (0.25) |
−54.67 (0.27) |
−64.51 (0.24) |
−64.09 (0.27) |
−67.21 (0.26) |
| ΔEele | −53.02 (0.35) |
−57.34 (0.43) |
−55.58 (0.43) |
−60.91 (0.42) |
−56.98 (0.50) |
−40.39 (0.33) |
| ΔGpol | 73.54 (0.29) |
77.62 (0.33) |
76.85 (0.34) |
84.02 (0.35) |
82.42 (0.40) |
70.89 (0.31) |
| ΔGnonpol | −5.80 (0.01) |
−5.71 (0.01) |
−5.75 (0.01) |
−6.15 (0.01) |
−6.14 (0.01) |
−6.17 (0.01) |
| ΔH | −43.42 (0.27) |
−41.74 (0.30) |
−39.14 (0.33) |
−47.56 (0.35) |
−44.79 (0.35) |
−42.88 (0.34) |
| −TΔS | 29.65 (0.32) |
29.52 (0.38) |
28.94 (0.38) |
29.15 (0.41) |
28.27 (0.44) |
26.25 (0.39) |
| ΔG | −13.77 | −12.22 | −10.2 | −18.41 | −16.52 | −16.63 |
| Gexp | −15.20b −13.20c |
N/A | N/A | −16.23 b | N/A | N/A |
Component: ΔEvdw is the van der Waals free energy; ΔEele is the electrostatic free energy; ΔGpol is the polar solvation energy; ΔGnonpol is the nonpolar solvation energy; ΔH = ΔEvdw + ΔEele + ΔGpol + ΔGnonpol; −TΔS is the entropic contribution.
The experimental value Gexp is obtained from the reference King et al. and Ghosh et al.41,16 using equation ΔGexp = RT lnKi, Ki inhibition constant.
The experimental value Gexp is obtained from the reference Kovalevsky et al.11
Standard error of the mean (SEM) values are enclosed in bracket ( ).
Figure 13.

Contributions of the binding free energy components of inhibitor DRV (a) and 4UY (b) to WT and mutant HIV-1-pr variants.
An inhibitor that binds a protein becomes less mobile, and the resulting loss in configurational entropy (−TΔS) opposes the attractive forces (ΔH) that drive binding.45 In spite of strong binding enthalpies, the penalties in binding affinity due to entropy loss for inhibitor 4UY are unexpectedly smaller than those for DRV by 0.5-2.7kcal/mol. The results for WT HIV-1 variants matched our expectations and the experimental binding energy values. All three 4UY/HIV-1-pr variants show higher binding free energy than DRV/HIV-1-pr variants.
3.7. Decomposition Analysis of Binding Free Energies
In order to determine the contribution of individual amino acid residues of HIV-1-pr variants to the overall binding affinity of the DRV and 4UY, a binging free energy decomposition analysis was performed using MM-GBSA method. The interaction enthalpies are decomposed into each protein residue and ligand pair, and the decomposition of ΔGbind values on a per-residue basis has contributions from van der Waals energy, electrostatic interaction, polar and non-polar solvation free energy. The per-residue decomposition method is extremely useful to explain the drug-resistant mechanism at atomic detail and also helpful to reveal the contribution of individual residues in protein-ligand interactions.40 The 4UY/HIV-1-pr variants inhibitor-residue interaction spectrum is shown in Figure 14 and energy contributions of each residue are shown in Table 2, whereas DRV/HIV-1-pr variants inhibitor-residue interaction spectrum and energy contributions for each residue are shown in Figure S4 and Table S3, respectively. A lot of residues directly participate in hydrogen bond and hydrophobic interactions. The major contributions with more than −1.0 kcal/mol for 4UY interacting with HIV-1-pr variants mainly come from amino acid residues Asp25/Asp25′, Ala28/Ala28′, Ile47, Gly48′, Asp29′, Gly49/Gly49′, Ile50/Ile50′ and Ile84/Ile84′, whereas the key contributing residues in DRV interacting with HIV-1-pr variants are Asp25, Ala28/Ala28′, Ile50/Ile50′, Ile84/Ile84′, Gly27′, Asp30′ and Ile47′. Comparing the contribution of all residues, 4UY/HIV-1-pr complexes show stronger interactions than DRV/HIV-1-pr complexes. The binding energy of Gly48′ that interacts with the modified methylamine group of 4UY is in the range from −0.5 to – 0.7 kcal/mol. In 4UY/HIV-1-pr complexes, the binding energy of active site residue Asp25 in the range from −4.09 to −4.81 kcal/mol, and flap region residue Ile50 in the range from −2.33 to −2.99 kcal/mol. The active site residues and flap region residues are shown more stable interaction with 4UY than DRV. The 4UY/HIV-1-pr variant 80s loop residue Ile84 in WT variant is shown −1.73 kcal/mol, and p20 variant is shown −1.57 kcal/mol, whereas in p51 the Ile84 is mutated residue Val84 is shown almost similar interaction (−1.15 kcal/mol). The other important residue in 80s loop Val82 in WT, mutated Ala82 in p20, and mutated Ile82 in p51 variants are shown more stable interaction with 4UY than DRV. The mutation in 80s loop region doesn’t decrease the binding affinity of 4UY, whereas DRV binding is decreased significantly.
Figure 14.

Decomposition of ΔG on a per-residue basis for the WT and mutant HIV-1-pr/4UY complexes: (a) WT, (b) p20 and (c) p51 variants
Table 2.
Decomposition of binding energies for the WT HIV-1-pr/4UY on a per-residue basis. All energies are reported in kcal/mol.
| WT | P20 | P51 | |||||||||||||||
|---|---|---|---|---|---|---|---|---|---|---|---|---|---|---|---|---|---|
| Tvdw | Tele | Tsol | Tsur | Tot | Tvdw | Tele | Tsol | Tsur | Tot | Tvdw | Tele | Tsol | Tsur | Tot | |||
| Asp25 | 0.94 | −13.4 | 8.46 | −0.06 | −4.09 | Asp25 | 0.61 | −15.84 | 10.52 | −0.10 | −4.81 | Asp25 | −0.28 | −10.82 | −6.40 | −0.06 | −4.77 |
| Ala28 | −1.67 | 0.79 | −0.49 | −0.15 | −1.53 | Ala28 | −1.28 | 0.66 | −0.38 | −0.19 | −1.19 | Ala28 | −1.69 | 0.51 | −0.19 | −0.22 | −1.60 |
| Ile47 | −1.29 | 0.31 | −0.18 | −0.17 | −1.33 | Ile47 | −0.90 | 0.25 | −0.20 | −0.16 | −1.02 | Ile47 | −1.10 | 0.15 | −0.02 | −0.15 | −1.18 |
| Gly49 | −0.80 | −1.76 | 1.60 | −0.09 | −1.04 | Gly49 | −0.72 | −2.09 | 1.48 | −0.06 | −1.39 | Gly49 | −0.67 | −2.21 | 1.57 | −0.08 | −1.40 |
| Ile50 | −2.03 | −0.56 | 0.44 | −0.18 | −2.33 | Ile50 | −2.24 | −1.19 | 0.67 | −0.22 | −2.99 | Ile50 | −2.20 | −1.08 | 0.55 | −0.25 | −2.99 |
| Ile84 | −1.63 | 0.01 | 0.04 | −0.15 | −1.73 | Ile84 | −1.48 | 0.01 | 0.06 | −0.16 | −1.57 | Val84 | −1.07 | −0.17 | 0.20 | −0.11 | −1.15 |
| Asp25′ | 0.44 | −4.69 | 1.88 | −0.08 | −2.45 | Asp25′b | −0.86 | −0.91 | 1.10 | −0.07 | −0.74 | Asp25′b | −1.38 | 1.05 | −0.33 | −0.09 | −0.77 |
| Ala28′ | −2.11 | −2.13 | 1.12 | −0.13 | −3.26 | Ala28′ | −2.17 | −2.10 | 1.20 | −0.13 | −3.20 | Ala28′ | −2.21 | −2.13 | 0.92 | −0.16 | −3.58 |
| Asp29′b | −1.25 | 3.04 | −2.60 | −0.14 | −0.95 | Asp29′ | −1.44 | 3.55 | −3.20 | −0.13 | −1.22 | Asp29′ | −1.28 | −0.45 | 0.85 | −0.15 | −1.03 |
| Gly48′ b | −0.79 | −1.79 | 2.04 | −0.23 | −0.77 | Gly48′ b | −0.56 | −1.50 | 1.75 | −0.18 | −0.50 | Gly48′ b | −1.14 | −1.22 | 1.84 | −0.24 | −0.76 |
| Gly49′ | −1.29 | −1.56 | 1.79 | −0.14 | −1.19 | Gly49′ b | −0.97 | −1.41 | 1.54 | −0.11 | −0.95 | Gly49′ | −1.27 | −1.61 | 1.91 | −0.13 | −1.10 |
| Ile50′ | −2.67 | −1.21 | 1.15 | −0.20 | −2.93 | Ile50′ | −2.66 | −1.14 | 1.16 | −0.24 | −2.89 | Ile50′ | −2.77 | −1.54 | 1.37 | −0.29 | −3.21 |
| Ile84′ | −1.34 | 0.09 | −0.05 | −0.11 | −1.41 | Ile84′ | −1.58 | 0.15 | −0.11 | −0.11 | −1.66 | Val84′ | −0.68 | 0.17 | −0.11 | −0.05 | −0.63 |
Energies are shown as contributions from van der Waals energy (Tvdw), electrostatic energy (Tele), polar solvation energy (Tsol), nonpolar solvation energy (Tsur), and sum of them (Tot) of WT, p20 and p51 HIV-1-pr/4UY complexes. Residues of ∣ ΔG ∣ ≥1.0 kcal/mol were listed.
Residues with energies that did not meet ∣ ΔG ∣ ≥1.0 kcal/mol.
4. Conclusion
In the present study, we have explored the interactions between HIV-1-prs (WT and mutant variants p20 and p51) and P2-ligand (4UY and DRV) using a combination of all atom MD simulations, binding free energy calculation, decomposition and PCA. From the MD simulation results, the RMSD and RMSF profiles of HIV-1-pr variants interacting P2-ligand (4UY/DRV) obtained proved the stability of 4UY/HIV-1-pr variants over DRV/HIV-1-pr variants during simulation. The binding free energies between the P2-ligands (4UY/DRV) and WT HIV-1-pr are in good agreement with the experimental data, suggesting that the molecular force fields used here are suitable for the description of protease-inhibitor interactions. The binding free energy calculations reveal the high stability of WT and mutant 4UY/HIV-1-pr variants than DRV/HIV-1-variants. The results of PCA proved the closing of flap regions in HIV-1-pr variants on P2-ligand binding. Further analysis of per-residue interaction energies in 4UY/HIV-1-pr variants shows stable hydrogen bond and hydrophobic interactions with active site (Asp25/Asp25′, Ala28/Ala28′, Asp29′), flap region (Ile47, Gly48′, Gly49/Gly49′, Ile50/Ile50′) and 80s loop region (Ile84/Ile84′). The basic amine in 4UY shown flap region backbone binding with Gly48′ makes it gain in binding affinity of the system, which agrees with experimental result. 4UY that has P2-moiety with strong flap backbone binding may confer desirable features in the future design of potent HIV-1-pr inhibitors. This study gives mechanistic insights into the mutational effect on HIV-1-pr/P2-ligand (4UY/DRV) interaction and sheds light on the design of potent inhibitors for the drug resistant HIV-1-pr variants.
Supplementary Material
In General, 4UY has more hydrogen bonds and hydrophobic contacts with HIV-1-prs including both WT and multiple mutants (p20 and p51), bring about smaller hydrophobic cavity than in the case of DRV.
4UY binds stronger to HIV-1-prs by 4.3-6.4 kcal/mol that DRV. It was also found that although p20 and p51 also induce weaker binding due to multiple mutants for 4UY inhibitor by 1.9-1.8 kcal/mol, their bindings to the new P2 ligand (4UY) are indeed significantly enhanced as compared to DRV. This well explain why 4UY has better performance to be against drug resistance.
The thermodynamic components responsible for the binding differences and the contribution from key residues to the binding were also discussed in detail, and a few key residues were located.
Acknowledgement
This work was supported by the National Institute of General Medical Science of the National Institute of Health (SC3GM105576).
Footnotes
Publisher's Disclaimer: This is a PDF file of an unedited manuscript that has been accepted for publication. As a service to our customers we are providing this early version of the manuscript. The manuscript will undergo copyediting, typesetting, and review of the resulting proof before it is published in its final citable form. Please note that during the production process errors may be discovered which could affect the content, and all legal disclaimers that apply to the journal pertain.
References
- 1.Barre-Sinoussi F; Chermann JC; Rey F; Nugeyre MT; Chamaret S; Gruest J; Dauguet C; Axler-Blin C; Vezinet-Brun F; Rouzioux C; Rozenbaum W; Montagnier L, Isolation of a T-lymphotropic retrovirus from a patient at risk for acquired immune deficiency syndrome (AIDS). Science 1983, 220 (4599), 868–71. [DOI] [PubMed] [Google Scholar]
- 2.Gallo RC; Sarin PS; Gelmann EP; Robert-Guroff M; Richardson E; Kalyanaraman VS; Mann D; Sidhu GD; Stahl RE; Zolla-Pazner S; Leibowitch J; Popovic M, Isolation of human T-cell leukemia virus in acquired immune deficiency syndrome (AIDS). Science 1983, 220 (4599), 865–7. [DOI] [PubMed] [Google Scholar]
- 3.Brik A; Wong CH, HIV-1 protease: mechanism and drug discovery. Org. Biomol. Chem. 2003, 1 (1), 5–14. [DOI] [PubMed] [Google Scholar]
- 4.Navia MA; Fitzgerald PM; McKeever BM; Leu CT; Heimbach JC; Herber WK; Sigal IS; Darke PL; Springer JP, Three-dimensional structure of aspartyl protease from human immunodeficiency virus HIV-1. Nature 1989, 337 (6208), 615–20. [DOI] [PubMed] [Google Scholar]
- 5.Wlodawer A; Miller M; Jaskolski M; Sathyanarayana BK; Baldwin E; Weber IT; Selk LM; Clawson L; Schneider J; Kent SB, Conserved folding in retroviral proteases: crystal structure of a synthetic HIV-1 protease. Science 1989, 245 (4918), 616–21. [DOI] [PubMed] [Google Scholar]
- 6.Lapatto R; Blundell T; Hemmings A; Overington J; Wilderspin A; Wood S; Merson JR; Whittle PJ; Danley DE; Geoghegan KF; et al. , X-ray analysis of HIV-1 proteinase at 2.7 A resolution confirms structural homology among retroviral enzymes. Nature 1989, 342 (6247), 299–302. [DOI] [PubMed] [Google Scholar]
- 7.Ghosh AK; Dawson ZL; Mitsuya H, Darunavir, a conceptually new HIV-1 protease inhibitor for the treatment of drug-resistant HIV. Bioorganic Med. Chem. 2007, 15 (24), 7576–80. [DOI] [PMC free article] [PubMed] [Google Scholar]
- 8.Pokorna J; Machala L; Rezacova P; Konvalinka J, Current and Novel Inhibitors of HIV Protease. Viruses 2009, 1 (3), 1209–39. [DOI] [PMC free article] [PubMed] [Google Scholar]
- 9.Tie Y; Boross PI; Wang YF; Gaddis L; Hussain AK; Leshchenko S; Ghosh AK; Louis JM; Harrison RW; Weber IT, High resolution crystal structures of HIV-1 protease with a potent non-peptide inhibitor (UIC-94017) active against multi-drug-resistant clinical strains. J. Mol. Biol. 2004, 338 (2), 341–52. [DOI] [PubMed] [Google Scholar]
- 10.Ghosh AK; Osswald HL; Prato G, Recent Progress in the Development of HIV-1 Protease Inhibitors for the Treatment of HIV/AIDS. J. Med. Chem. 2016, 59 (11), 5172–208. [DOI] [PMC free article] [PubMed] [Google Scholar]
- 11.Kovalevsky AY; Tie Y; Liu F; Boross PI; Wang YF; Leshchenko S; Ghosh AK; Harrison RW; Weber IT, Effectiveness of nonpeptide clinical inhibitor TMC-114 on HIV-1 protease with highly drug resistant mutations D30N, I50V, and L90M. J. Med. Chem. 2006, 49 (4), 1379–87. [DOI] [PMC free article] [PubMed] [Google Scholar]
- 12.Wang YF; Tie Y; Boross PI; Tozser J; Ghosh AK; Harrison RW; Weber IT, Potent new antiviral compound shows similar inhibition and structural interactions with drug resistant mutants and wild type HIV-1 protease. J. Med. Chem. 2007, 50 (18), 4509–15. [DOI] [PMC free article] [PubMed] [Google Scholar]
- 13.Saskova KG; Kozisek M; Rezacova P; Brynda J; Yashina T; Kagan RM; Konvalinka J, Molecular characterization of clinical isolates of human immunodeficiency virus resistant to the protease inhibitor darunavir. J. Virol. 2009, 83 (17), 8810–8. [DOI] [PMC free article] [PubMed] [Google Scholar]
- 14.Louis JM; Aniana A; Weber IT; Sayer JM, Inhibition of autoprocessing of natural variants and multidrug resistant mutant precursors of HIV-1 protease by clinical inhibitors. Proc. Natl. Acad. Sci. U.S.A 2011, 108 (22), 9072–7. [DOI] [PMC free article] [PubMed] [Google Scholar]
- 15.Kozisek M; Lepsik M; Grantz Saskova K; Brynda J; Konvalinka J; Rezacova P, Thermodynamic and structural analysis of HIV protease resistance to darunavir - analysis of heavily mutated patient-derived HIV-1 proteases. FEBS J. 2014, 281 (7), 1834–47. [DOI] [PubMed] [Google Scholar]
- 16.Ghosh AK; Martyr CD; Osswald HL; Sheri VR; Kassekert LA; Chen S; Agniswamy J; Wang YF; Hayashi H; Aoki M; Weber IT; Mitsuya H, Design of HIV-1 Protease Inhibitors with Amino-bis-tetrahydrofuran Derivatives as P2-Ligands to Enhance Backbone-Binding Interactions: Synthesis, Biological Evaluation, and Protein-Ligand X-ray Studies. J. Med. Chem. 2015, 58 (17), 6994–7006. [DOI] [PMC free article] [PubMed] [Google Scholar]
- 17.Agniswamy J; Louis JM; Roche J; Harrison RW; Weber IT, Structural Studies of a Rationally Selected Multi-Drug Resistant HIV-1 Protease Reveal Synergistic Effect of Distal Mutations on Flap Dynamics. PloS one 2016, 11 (12), e0168616. [DOI] [PMC free article] [PubMed] [Google Scholar]
- 18.Koh Y; Amano M; Towata T; Danish M; Leshchenko-Yashchuk S; Das D; Nakayama M; Tojo Y; Ghosh AK; Mitsuya H, In vitro selection of highly darunavir-resistant and replication-competent HIV-1 variants by using a mixture of clinical HIV-1 isolates resistant to multiple conventional protease inhibitors. J. Virol. 2010, 84 (22), 11961–9. [DOI] [PMC free article] [PubMed] [Google Scholar]
- 19.Chen J; Wang X; Zhu T; Zhang Q; Zhang JZ, A Comparative Insight into Amprenavir Resistance of Mutations V32I, G48V, I50V, I54V, and I84V in HIV-1 Protease Based on Thermodynamic Integration and MM-PBSA Methods. Journal of chemical information and modeling 2015, 55 (9), 1903–13. [DOI] [PubMed] [Google Scholar]
- 20.Chen J; Peng C; Wang J; Zhu W, Exploring molecular mechanism of allosteric inhibitor to relieve drug resistance of multiple mutations in HIV-1 protease by enhanced conformational sampling. Proteins 2018, 86 (12), 1294–1305. [DOI] [PubMed] [Google Scholar]
- 21.Schrodinger, LLC, The PyMOL Molecular Graphics System, Version 1.8. 2015. [Google Scholar]
- 22.Harte WE; Beveridge DL, Prediction of the protonation state of the active site aspartyl residues in HIV-1 protease-inhibitor complexes via molecular dynamics simulation. J. Am. Chem. Soc. 1993, 115 (10), 3883–3886. [Google Scholar]
- 23.Hyland LJ; Tomaszek TA Jr.; Meek TD, Human immunodeficiency virus-1 protease. 2. Use of pH rate studies and solvent kinetic isotope effects to elucidate details of chemical mechanism. Biochemistry 1991, 30 (34), 8454–63. [DOI] [PubMed] [Google Scholar]
- 24.Soares RO; Batista PR; Costa MG; Dardenne LE; Pascutti PG; Soares MA, Understanding the HIV-1 protease nelfinavir resistance mutation D30N in subtypes B and C through molecular dynamics simulations. Journal of molecular graphics & modelling 2010, 29 (2), 137–47. [DOI] [PubMed] [Google Scholar]
- 25.Batista PR; Wilter A; Durham EH; Pascutti PG, Molecular dynamics simulations applied to the study of subtypes of HIV-1 protease common to Brazil, Africa, and Asia. Cell biochemistry and biophysics 2006, 44 (3), 395–404. [DOI] [PubMed] [Google Scholar]
- 26.Maier JA; Martinez C; Kasavajhala K; Wickstrom L; Hauser KE; Simmerling C, ff14SB: Improving the Accuracy of Protein Side Chain and Backbone Parameters from ff99SB. J. Chem. Theory Comput. 2015, 11 (8), 3696–713. [DOI] [PMC free article] [PubMed] [Google Scholar]
- 27.Frisch MJ; Trucks GW; Schlegel HB; Scuseria GE; Robb MA; Cheeseman JR; Scalmani G; Barone V; Mennucci B; Petersson GA; et al. Gaussian 09 Revision D.01; Gaussian Inc.:Wallingford CT, 2009. [Google Scholar]
- 28.Wang J; Wolf RM; Caldwell JW; Kollman PA; Case DA, Development and testing of a general amber force field. J. Comput. Chem. 2004, 25 (9), 1157–74. [DOI] [PubMed] [Google Scholar]
- 29.Jorgensen WL; Chandrasekhar J; Madura JD; Impey RW; Klein ML, Comparison of simple potential functions for simulating liquid water. J. Chem. Phys. 1983, 79 (2), 926–935. [Google Scholar]
- 30.Le Grand S; Götz AW; Walker RC, SPFP: Speed without compromise—A mixed precision model for GPU accelerated molecular dynamics simulations. Comput. Phys. Commun. 2013, 184 (2), 374–380. [Google Scholar]
- 31.Gotz AW; Williamson MJ; Xu D; Poole D; Le Grand S; Walker RC, Routine Microsecond Molecular Dynamics Simulations with AMBER on GPUs. 1. Generalized Born. J. Chem. Theory Comput. 2012, 8 (5), 1542–1555. [DOI] [PMC free article] [PubMed] [Google Scholar]
- 32.Salomon-Ferrer R; Gotz AW; Poole D; Le Grand S; Walker RC, Routine Microsecond Molecular Dynamics Simulations with AMBER on GPUs. 2. Explicit Solvent Particle Mesh Ewald. J. Chem. Theory Comput. 2013, 9 (9), 3878–88. [DOI] [PubMed] [Google Scholar]
- 33.Case D; Betz R; Cerutti D; Cheatham TI; Darden T; Duke R; Giese T; Gohlke H; Goetz A; Greene D; Homeyer N; et al. AMBER 2016; University of California: San Francisco, 2016. [Google Scholar]
- 34.Ryckaert J-P; Ciccotti G; Berendsen HJC, Numerical integration of the cartesian equations of motion of a system with constraints: molecular dynamics of n-alkanes. J. Comput. Phys. 1977, 23 (3), 327–341. [Google Scholar]
- 35.Essmann U; Perera L; Berkowitz ML; Darden T; Lee H; Pedersen LG, A smooth particle mesh Ewald method. J. Chem. Phys. 1995, 103 (19), 8577–8593. [Google Scholar]
- 36.Chen J; Liang Z; Wang W; Yi C; Zhang S; Zhang Q, Revealing origin of decrease in potency of darunavir and amprenavir against HIV-2 relative to HIV-1 protease by molecular dynamics simulations. Sci. Rep. 2014, 4, 6872. [DOI] [PMC free article] [PubMed] [Google Scholar]
- 37.David CC; Jacobs DJ, Principal component analysis: a method for determining the essential dynamics of proteins. Methods Mol. Biol. 2014, 1084, 193–226. [DOI] [PMC free article] [PubMed] [Google Scholar]
- 38.Roe DR; Cheatham TE 3rd, PTRAJ and CPPTRAJ: Software for Processing and Analysis of Molecular Dynamics Trajectory Data. J. Chem. Theory Comput. 2013, 9 (7), 3084–95. [DOI] [PubMed] [Google Scholar]
- 39.Miller BR 3rd; McGee TD Jr.; Swails JM; Homeyer N; Gohlke H; Roitberg AE, MMPBSA.py: An Efficient Program for End-State Free Energy Calculations. J. Chem. Theory Comput. 2012, 8 (9), 3314–21. [DOI] [PubMed] [Google Scholar]
- 40.Genheden S; Ryde U, The MM/PBSA and MM/GBSA methods to estimate ligand-binding affinities. Expert Opin. Drug Discov. 2015, 10 (5), 449–61. [DOI] [PMC free article] [PubMed] [Google Scholar]
- 41.King NM; Prabu-Jeyabalan M; Nalivaika EA; Wigerinck P; de Bethune MP; Schiffer CA, Structural and thermodynamic basis for the binding of TMC114, a next-generation human immunodeficiency virus type 1 protease inhibitor. J. Virol. 2004, 78 (21), 12012–21. [DOI] [PMC free article] [PubMed] [Google Scholar]
- 42.Meher BR; Wang Y, Exploring the drug resistance of V32I and M46L mutant HIV-1 protease to inhibitor TMC114: flap dynamics and binding mechanism. J. Mol. Graph. Model. 2015, 56, 60–73. [DOI] [PMC free article] [PubMed] [Google Scholar]
- 43.Meher BR; Wang Y, Interaction of I50V mutant and I50L/A71V double mutant HIV-protease with inhibitor TMC114 (darunavir): molecular dynamics simulation and binding free energy studies. J. Phys. Chem. B 2012, 116 (6), 1884–900. [DOI] [PMC free article] [PubMed] [Google Scholar]
- 44.Scott WR; Schiffer CA, Curling of flap tips in HIV-1 protease as a mechanism for substrate entry and tolerance of drug resistance. Structure 2000, 8 (12), 1259–65. [DOI] [PubMed] [Google Scholar]
- 45.Chang CE; Chen W; Gilson MK, Ligand configurational entropy and protein binding. Proc. Natl. Acad. Sci. U.S.A 2007, 104 (5), 1534–9. [DOI] [PMC free article] [PubMed] [Google Scholar]
Associated Data
This section collects any data citations, data availability statements, or supplementary materials included in this article.