Abstract
Statement of the Problem:
Assessment of bone density changes plays an important role in diagnosis, treatment, and follow-up procedures. The feasibility of cone-beam computed tomography (CBCT) for assessment of bone density changes is still controversial.
Purpose:
The aim of this study was to investigate the capability of bone density contrast dissociation of CBCT compared to digital periapical radiography.
Materials and Method:
In this in vitro, experimental study, we designed radiographic phantom for bone density simulation. The phantom was a polytetrafluoroethylene rectangular cube with five-chambers. Five micro-tubes (2 mL) containing different concentrations of dipotassium phosphate (K2HPO4) were placed within these chambers. Different concentrations of K2HPO4 were scanned by CBCT; the mean voxel value of each micro-tube was measured and compared with the concentration of K2HPO4 that represented bone density.
Results:
CBCT results showed that there were no significant correlations between 300 mg/mL and lower concentrations of K2HPO4 and CBCT voxel values (P≤0.52) but there was a significant correlation between concentrations of K2HPO4 higher than 300 mg/mL and CBCT voxel values (p< 0.001).
Conclusion:
CBCT is a reliable method for the assessment of bone density changes in the high range of bone density but it is not reliable for such assessment in the lower range of bone density. Digital periapical imaging method may not be applied for the assessment of bone density, whereas in higher densities, the employment of CBCT seems to be feasible.
Keywords: CBCT , Intraoral digital radiography , Bone density
Introduction
Bone mineral density is demonstrated by the amount of bone mineral mass contained in a certain volume of a structure, described in units of mass per area in two-dimensional images or per volume in three-dimensional (3D) images[1].
Bone tissue is a live skeletal system that constantly changes. Bone modeling and remodeling are involved in these bone alterations. In the process of bone remodeling, osteoclasts as the bone resorbing cells, are activated to remove the pre-existing bone tissue and subsequently, new bone is deposited by bone forming cells namely osteoblasts in bone modeling. Therefore, there is a process of activation and resorption or activation and formation[2].
When bone resorption and formation are balanced, the net quantity of bone density is maintained. On the other hand, when bone resorption and formation are unequal, the net quantity of bone density is altered. Bone modeling and remodeling are activated at different time points. Active bone modeling and remodeling is stimulated by bone diseases and some impediments including postmenopausal osteoporosis, osteoarthritis, fracture healing, and implantation surgeries[2].
Bone density assessment performs an essential part in diagnosis, treatment, and follow-up procedures of conditions such as implantation surgery, osteoporosis, and bone lesions. Several methods may be used to determine bone mineral density, including digital image analysis of microradiographs, single photon absorciom-etry, dual photon absorciometry, dual-energy X-ray absorciometry (DEXA) and quantitative ultrasound[1].
Regarding the easy access and low radiation dose, conventional imaging methods such as intra-oral periapical radiography is still the first step investigation method in clinic for assessment of bony changes. Therefore, despite the development of various imaging methods, conventional radiography is yet the backbone in the diagnosis of osseous changes in the jaws[3-4]. However, conventional radiographs have limitation for assessment of bone alterations and their accuracy in the assessment of bone density is yet unknown[5].
Employing more accurate imaging methods are necessary in detecting the bone density changes in conditions when early or accurate recognition of these changes are crucial. Concerning the limitations of conventional radiography, cone-beam computed tomography (CBCT) has been suggested to be used for oral and maxillofacial imaging in diagnosis, treatment planning, and follow-ups. This advanced imaging method provides a good spatial resolution, grey density range, and contrast, as well as a good pixel/noise ratio[6-7]. It is known that in CBCT, the diagnostic accuracy is higher than the conventional radiography in many aspects. In the current literature, there is controversy on the precision of grey density values (voxel value) of CBCT images as a feasible tool for assessment of bone density alteration[1-2,5,8]. This study examines the capability and accuracy of CBCT in estimating bone density changes in comparison with digital periapical radiography as an example of conventional imaging methods.
Materials and Method
Phantom design
In this study, we designed custom fabricated radiograp-hic phantoms to simulate bone mineral density. The phantoms was a five-chamber, polytetrafluoroethylene ([C2F4]n) rectangular cube (20.0×45.0×80.0cm) (Figure 1). Polypropylene micro-tubes (2 mL; diameter, 1 cm; height, 4cm) were placed within the chambers. Each micro-tube contained a specific concentration of aqueous solutions of dipotassium hydrogen phosphate (K2HPO4). For digital periapical radiography, the micro-tubes containing concentrations of K2HPO4 were used as phantoms (Figure 2).
Figure1.
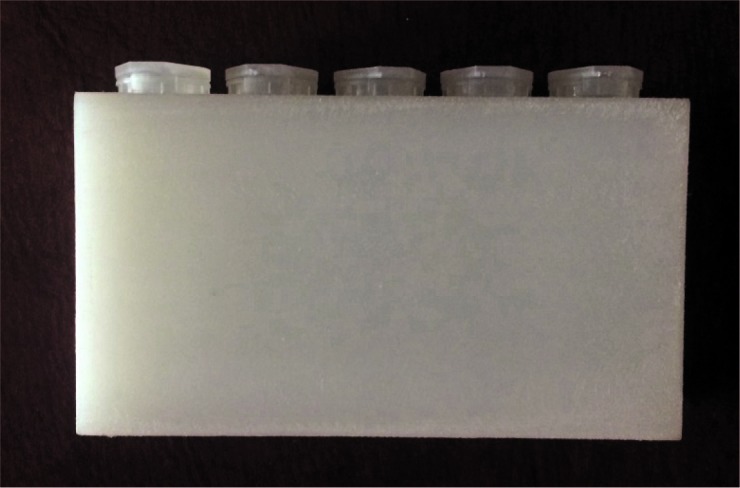
Polytetrafluoroethylene phantom
Figure2.
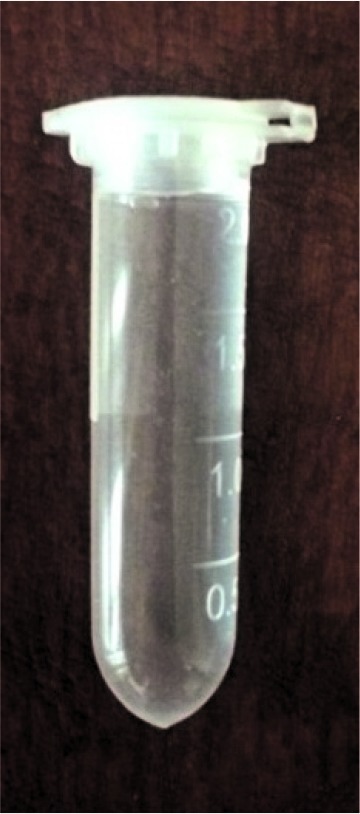
Micro-tube containing K2HPO4 solution
The nine different concentrations of K2HPO4 (0,100, 200, 300, 400, 600, 800, 1000 and 1200 mg/mL) were selected to represent the alveolar bone with a broad range of mineralization, from trabecular (40 to 800 mg/mL) to cortical (800 to 1200 mg/mL) bone. These concentrations were adjusted based on similar published studies[9-11].
Radiologic evaluation
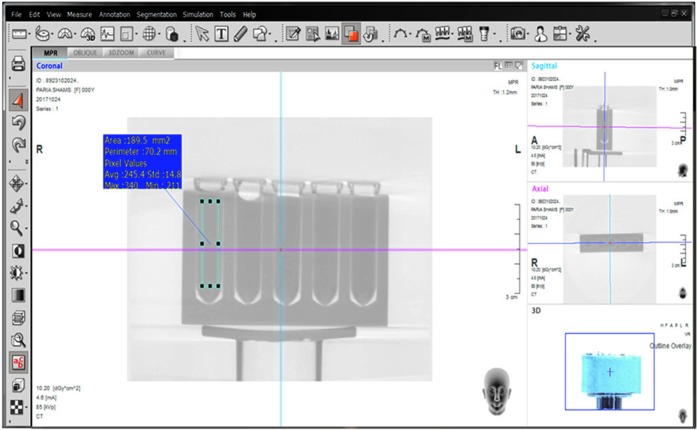
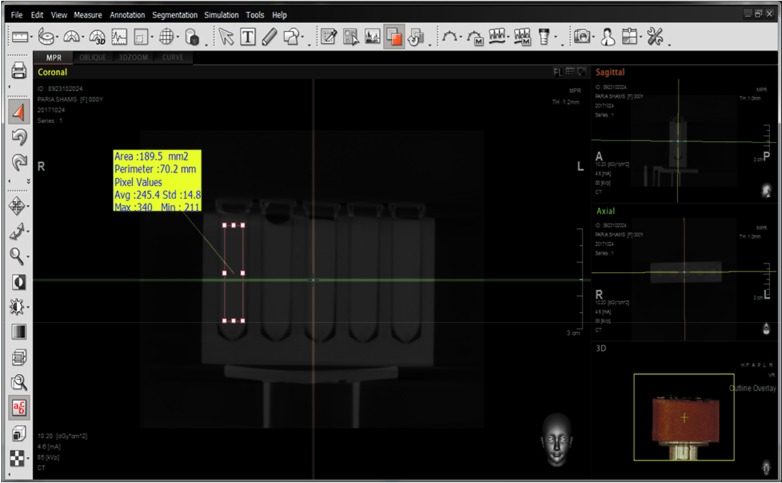
We employed CBCT to evaluate density, and compared it to a conventional method (digital periapical radiography) as a common radiographic method used in clinic. The different concentrations of K2HPO4 were scanned in CBCT in groups of five. All CBCT scans were acquired by a CBCT unit Pax-i3D (VATECH Global, Korea). The phantom was centered in the middle of FOV (diameter, 12 cm; height, 9 cm). The CBCT unit was set at 85 kVp and 4.6 mA, with a 24-second exposure time. All scans were set at a standard mode, which resulted in images with a voxel size of 0.2 mm. CBCT scans were obtained. The data were reconstructed and evaluated by a single evaluator (radiologist) with experience in the use of Ez3D-i software (VATECH Global, Korea). On cross-sectional slices, rectangular regions of interest (approximately 200 mm2) were selected within the tubes, and the mean CBCT voxel values were obtained and then compared with the concentration of K2HPO4 that represented the bone density (Figure 3).
Figure3.
CBCT data example in Ez3D-i software (inverted)
The digital periapical radiographs were captured by DIGORA Optime Imaging System (Soredex Corporation, Tuusula, Finland), with a size 2 (3.0×4.0 cm) photostimulable phosphor (PSP) sensor (Digora Optime, Sordex, Tuusula, Finland). The exposure setting was 70 kVp, 8mA and 0.2-second exposure time. A film holder (Kerr Dental Europe, Bioggio, Switzerland) was used and the tube-sensor fixed distance was 30 cm. The digital periapical radiographs were exported from the Digora system as DICOM (Digital Imaging and Communications in Medicine) files into the Scanora Lite imaging software (Palodex, Tuusula, Finland) and ImageJ software (National Institutes of Health (NIH), Bethesda, MD, USA) (Figure 4).
Figure4.
CBCT data example in Ez3D-i software
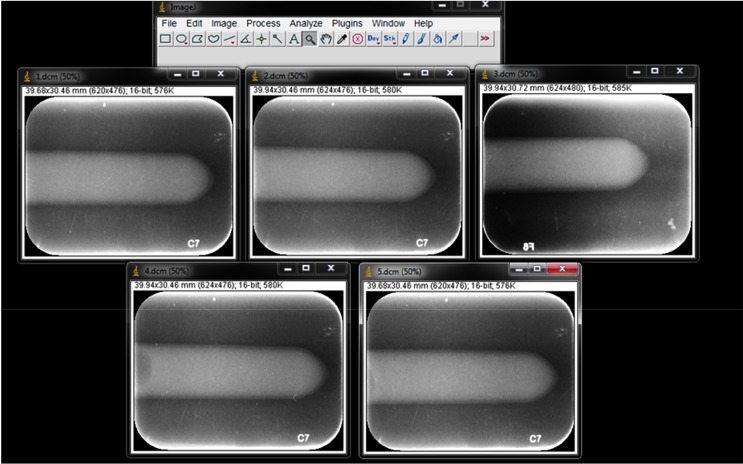
The digital periapical radiographs were evaluated subjectively and objectively. First, the images were illustrated directly on the computer monitor screen by Scanora Lite software. Five images (concentrations 40, 120, 300, 600 and 1200 mg/mL) were presented to five experienced observers (two oral and maxillofacial radiologists, three general dentists), who were aware of the study design but blinded to the concentration and order of the images. Images were not in order of concentration and were arranged randomly (Figure 5). The radiographs were displayed on a 19-inch monitor (Samsung Syncmaster) situated in a room with subdued lighting. Each observer had unlimited viewing time and assessed the images independently. The observers were asked to rank the images from the highest density to the lowest and report any equal densities if applicable. Observers submitted their records in datasheets. To analyze the observers’ rankings, we assigned points to each image (from 1 to 5) as 1 being the lowest and 5 being the highest density. These numbers were compared in order to compare their observations (Table 1).
Figure5.
Five periapical images presented to the observers for comparison
Table 1.
Ranking the digital periapical images by observers
| First observer | 1200>120>300>40>600 |
| Second observer | 40>300>120=1200>600 |
| Third observer | 600>300>1200>120>40 |
| Fourth observer | 1200>120>600>40>300 |
| Fifth observer | 120>40>600>300>1200 |
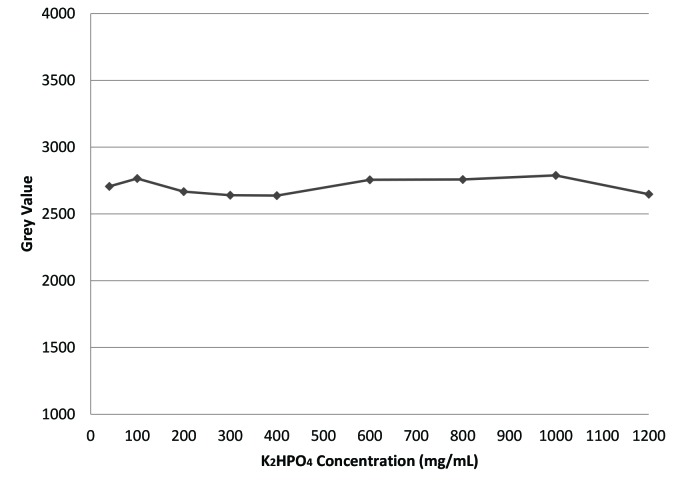
Subsequently, a radiologist with experience in using ImageJ software performed the image analysis of nine radiographs yielded from different concentrations (40, 100, 200, 300, 400, 600, 800, 1000 and 1200 mg/ mL), Rectangular regions of interest (approximately 200 mm2) were selected within the tubes, and the mean grey value of each micro-tube was measured. We compared the mean grey values with the concentration of K2HPO4 that represented the bone density.
Statistical analysis
We employed general linear model analysis followed by Sidak (post hoc) test to evaluate the relationship between different concentrations of K2HPO4 and mean voxel values of CBCT (in software program Ez3D-i). p Values less than 0.05 were considered as statistically significant. For data analysis in the digital periapical radiographs subjective assessment, the relationship between different concentrations of K2HPO4 (bone density) and the rankings recorded by the observers was assessed by ICC. For data analysis in the digital periapical radiographs objective assessment, the relationship between different concentrations of K2HPO4 and the mean grey value of digital periapical radiographs in software program ImageJ was assessed by linear regression analysis.
Results
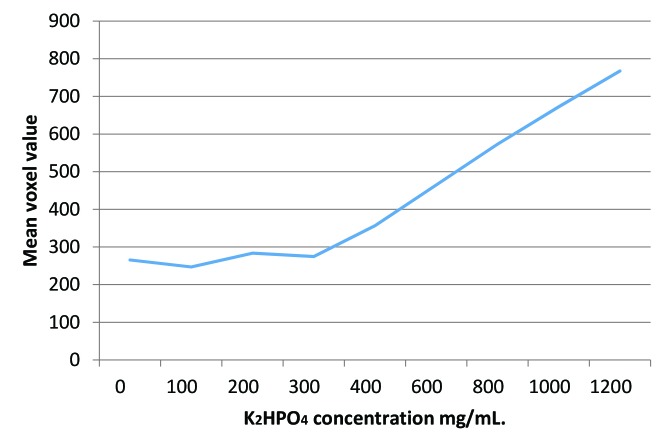
There was no significant relationship between 300 mg/ mL and lower concentrations of K2HPO4 and CBCT voxel values (p≤ 0.52) but there was a significant relationship between concentrations of K2HPO4 higher than 300mg/mL and CBCT voxel values (p< 0.001; Figure 6).
Figure6.
This graph shows the relationship between K2HPO4 concentration and CBCT voxel value
In the subjective evaluation of five digital periapical radiographies performed by five observers, there was no relationship between the five proposed concentrations and the given rankings (ICC= - 0.05, p= 0.54). In the objective evaluation of nine digital periapical radiographs, performed by program ImageJ software, there was no relationship between these concentrations and the yielded grey values (p=0.91; Figure 7). The agreement among the observers was assessed by ICC= - 0.05 (p= 0.54) that showed there was no correlation among observers’ rankings.
Figure7.
This graph depicts the relationship between K2HPO4 concentration and digital grey value in periapical image
Discussion
Ideally, the process of bone assessment should be supported by real clinical images, but ethical issues and unlikelihood of obtaining bone tissues in desired mineral densities, make it impossible. Phantom studies overcome these ethical issues. We used micro-tubes containing concentrations of K2HPO4 solutions as radiographic phantoms to simulate bone mineral density. K2HPO4 is a salt with high water solubility and the atomic number very close to that of calcium hydroxyapatite (15.58 and 15.86, respectively)[9] Solutions of K2HPO4 can be easily prepared; thus, K2HPO4 would be a simple and convenient reference material to evaluate imaging methods properties and simulate bone mass. The current study adopted a range of different concentrations of K2HPO4 to represent the alveolar bone with a broad range of mineralization, from trabecular (40 to 800 mg/ mL) to cortical bone (800 to 1200 mg/mL). According to Matsumura et al.[10], various concentrations of K2HPO4 can be used to simulate the attenuation characteristics of trabecular bone (50-800mg/mL), and cortical bone (800-1200mg/mL). They indicated that CBCT scans acquired from K2HPO4 phantom, reliably imitated mineralized tissues in the maxillofacial region. Oliveira et al.[9] designed solutions of K2HPO4 at concentrations 50, 200, 400, 600, 800, 1000 and 1200 mg/mL. This concentration range was selected to represent a broad range of X-ray attenuation characteristics of bone mass. Oliveira et al.[11] prepared solutions of K2HPO4 at six concentrations (1200, 1000, 800, 600, 400 and 200 mg/mL). This concentration range was selected to represent the alveolar bone with a broad range of mineralization.
Dentists generally use conventional-imaging methods such as intra-oral radiography in the clinic to assess bone changes, but the accuracy of these methods in the assessment of bone density is not investigated in previous studies. In the initial stage of the evaluation process in our study, digital periapical radiographs were evaluated by observers to simulate the clinical process of evaluating periapical radiographs. Observers’ rankings revealed the unlikelihood of correct ranking of the images based on density. There were no correlations between K2HPO4 concentrations and the observers’ recorded grades. This consequently means that digital periapical radiographs could not help the observers assess bone density.
In order to identify the inevitability of the first stage results, we investigated the digital periapical radiographs objectively by the means of ImageJ software. This assessment revealed that although the K2HPO4 concentration of the last radiograph was 40 times the concentration of the first one, no statistically significant relationship was detected between their grey values.
Generally, we demonstrated that digital periapical radiography is not sensitive to bone density changes and could only detect the presence or absence of bone mass. In other words, different bone densities do not create different results is digital periapical radiography subjectively or objectively and consequently, this technique is not sensitive to density variations in the range of bone mineral density.
Various grey shadows in these radiographic images are the result of volume difference, diameter difference, and presence or absence of bone mass. Geha et al.[12] indicated that the contrast in intraoral images represented the change in object thickness rather than the change in X-ray attenuation. Bender et al.[13] expressed that bone lesions, created within the cancellous structure are not detectable in intraoral images and are only visualized when they destructed cortical bone. Mohajery et al.[14] demonstrated that women with osteoporosis could not be distinguished from women with normal bone density using panoramic and periapical radiography. Although these studies have been carried out on relevant subjects, no study has directly addressed the relationship between bone density changes and conventional imaging output. CBCT is a more accurate and recent imaging method for investigating bone mass alterations but because of a few features such as difficult accessibility, higher dose, and higher expenses, this method is not commonly employed in clinic. There is still considerable disagreement concerning the accuracy and feasibility of CBCT in assessment of bone density alterations.
As mentioned before, density alterations in the range of 300 mg/mL and lower is not detectable by CBCT. However, K2HPO4 concentrations higher than 300 mg/ mL are distinguished by CBCT and this result indicate that CBCT can detect K2HPO4 concentration changes 300mg/mL and above. The current study demonstrated that density changes in high-density objects (such as cortical bone and medium to high-density cancellous bone) could be detected by CBCT, but this method is not reliable for this assessment in low-density objects.
Sanjana et al.[15] concluded that the bone densities for hyperdense structures on CBCT show a significant difference, on the other hand, the grey value for hypodense structures is not reliable. Hohlweg et al.[16], Naitoh et al.[17] and Parsa et al.[18] reported that voxel values of CBCT could be used to estimate bone density. They assessed higher densities such as cancellous and cortical bone and described the results generally for all densities. However, lower density range is missing from their investigations. Nomura et al.[8] designed a water phantom with sample tubes containing various concentration of hydroxyapatite. They revealed that there was no correlation between the voxel values of CBCT and the CT numbers of MSCT. Nevertheless, the concentrations of hydroxyapatite in their study were up to 100 mg/mL, which was lower than the density range we found the CBCT was sensitive to.
Cassetta et al.[7] had results incompatible with our study. They demonstrated that the use of CBCT to evaluate the bone density of jaws is not useful when the values are taken as absolute values, therefore, they are not reliable to assess bone density changes. In their study, exposure conditions for each group were different from our study. This might explain the different results yielded by our study. We hope that further studies assess the relat-ionship between density changes in higher densities and voxel values of CBCT in various exposure conditions.
Conclusion
This study demonstrated that CBCT is a reliable method for the assessment of bone density changes in high-density range (such as cortical bone and medium to high-density cancellous bone) but it is not reliable for this assessment in lower density range. Digital periapical radiography is not a reliable method when it comes to bone density changes both when the evaluation is objective and subjective. Digital periapical imaging method may not be applied for the assessment of bone density; while in higher densities, the employment of CBCT seems to be feasible.
Acknowledgement
This study was a part of a doctral thesis in dentistry supported by Tehran University of Medical Sciences (TUMS).
Conflict of Interest:The authors declare that they have no conflict of interest.
References
- 1.Campos MJ, de Souza TS, Mota Júnior SL, Fraga MR, Vitral RW. Bone mineral density in cone beam computed tomography: Only a few shades of gray. World J Radiol. 2014; 6: 607–612. doi: 10.4329/wjr.v6.i8.607. [DOI] [PMC free article] [PubMed] [Google Scholar]
- 2.Kim DG. Can dental cone beam computed tomography assess bone mineral density? . J Bone Metab. 2014;21:117–126. doi: 10.11005/jbm.2014.21.2.117. [DOI] [PMC free article] [PubMed] [Google Scholar]
- 3.Shah N, Bansal N, Logani A. Recent advances in imaging technologies in dentistry. World J Radiol. 2014; 6: 794–807. doi: 10.4329/wjr.v6.i10.794. [DOI] [PMC free article] [PubMed] [Google Scholar]
- 4.Avril L, Lombardi T, Ailianou A, Burkhardt K, Varoquaux A, Scolozzi P, et al. Radiolucent lesions of the mandible: a pattern-based approach to diagnosis. Insights Imaging. 2014; 5: 85–101. doi: 10.1007/s13244-013-0298-9. [DOI] [PMC free article] [PubMed] [Google Scholar]
- 5.Pauwels R, Nackaerts O, Bellaiche N, Stamatakis H, Tsiklakis K, Walker A, et al. Variability of dental cone beam CT grey values for density estimations. Br J Radiol. 2013; 86: 20120135. doi: 10.1259/bjr.20120135. [DOI] [PMC free article] [PubMed] [Google Scholar]
- 6.Tanomaru-FIlho M, Jorge ÉG, Guerreiro-Tanomaru JM, Reis JM, Spin-Neto R, Gonçalves M. Two- and tridimensional analysis of periapical repair after endodontic surgery. Clin Oral Investig. 2015; 19: 17–25. doi: 10.1007/s00784-014-1225-2. [DOI] [PubMed] [Google Scholar]
- 7.Cassetta M, Stefanelli LV, Di Carlo S, Pompa G, Barbato E. The accuracy of CBCT in measuring jaws bone density. Eur Rev Med Pharmacol Sci. 2012; 16: 1425–1429. [PubMed] [Google Scholar]
- 8.Nomura Y, Watanabe H, Honda E, Kurabayashi T. Reliability of voxel values from cone-beam computed tomography for dental use in evaluating bone mineral density. Clin Oral Implants Res. 2010; 21: 558–562. doi: 10.1111/j.1600-0501.2009.01896.x. [DOI] [PubMed] [Google Scholar]
- 9.Matsumura S, Sobue T, Yadav S, Lurie A, Tadinada A. Value of a radiographic phantom to evaluate various tissue densities using CBCT. Oral Surg Oral Med Oral Pathol. 2017; 124: e30. [Google Scholar]
- 10.Oliveira ML, Freitas DQ, Ambrosano GM, Haiter-Neto F. Influence of exposure factors on the variability of CBCT voxel values: a phantom study. Dentomaxillofac Radiol. 2014; 43: 20140128. doi: 10.1259/dmfr.20140128. [DOI] [PMC free article] [PubMed] [Google Scholar]
- 11.Oliveira ML, Tosoni GM, Lindsey DH, Mendoza K, Tetradis S, Mallya SM. Influence of anatomical location on CT numbers in cone beam computed tomography. Oral Surg Oral Med Oral Pathol Oral Radiol. 2013; 115: 558–564. doi: 10.1016/j.oooo.2013.01.021. [DOI] [PubMed] [Google Scholar]
- 12.Geha H, Bechara B, Faddoul T, Noujeim M. A mathematical model relating changes of grey values to changes of thicknesses of a stepwedge. Dentomaxillofac Radiol. 2013; 42: 50719185. doi: 10.1259/dmfr/50719185. [DOI] [PMC free article] [PubMed] [Google Scholar]
- 13.Bender IB, Seltzer S. Roentgenographic and direct observation of experimental lesions in bone: II. 1961. J Endod. 2003; 29: 707–712. doi: 10.1097/00004770-200311000-00006. [DOI] [PubMed] [Google Scholar]
- 14.Mohajery M, Brooks SL. Oral radiographs in the detection of early signs of osteoporosis. Oral Surg Oral Med Oral Pathol. 1992; 73: 112–117. doi: 10.1016/0030-4220(92)90167-o. [DOI] [PubMed] [Google Scholar]
- 15.Patrick S, Birur NP, Gurushanth K, Raghavan AS, Gurudath S. Comparison of gray values of cone-beam computed tomography with hounsfield unitsof multislice computed tomography: An in vitro study. Indian J Dent Res. 2017; 28: 66–70. doi: 10.4103/ijdr.IJDR_415_16. [DOI] [PubMed] [Google Scholar]
- 16.Hohlweg-Majert B, Metzger MC, Kummer T, Schulze D. Morphometric analysis-Cone beam computed tomography to predict bone quality and quantity. J Craniomaxillofac Surg. 2011; 39: 330–334. doi: 10.1016/j.jcms.2010.10.002. [DOI] [PubMed] [Google Scholar]
- 17.Naitoh M, Hirukawa A, Katsumata A, Ariji E. Evaluation of voxel values in mandibular cancellous bone: relationship between cone-beam computed tomography and multislice helical computed tomography. Clin Oral Implants Res. 2009; 20: 503–506. doi: 10.1111/j.1600-0501.2008.01672.x. [DOI] [PubMed] [Google Scholar]
- 18.Parsa A, Ibrahim N, Hassan B, Motroni A, van der, Stelt P, Wismeijer D. Reliability of voxel gray values in cone beam computed tomography for preoperative implant planning assessment. Int J Oral Maxillofac Implants. 2012; 27: 1438–1442. [PubMed] [Google Scholar]


