

Abstract
Positron emission tomography (PET) radiopharmaceuticals can noninvasively measure free fatty acid (FFA) uptake into adipose tissue. We studied 29 volunteers to test whether abdominal and femoral subcutaneous adipose tissue FFA uptake measured using [1-11C]palmitate PET agrees with FFA storage rates measured using an intravenous bolus of [1-14C]palmitate and adipose biopsies. The dynamic left ventricular cavity PET images combined with blood sample radioactivity corrected for the 11CO2 content were used to create the blood time activity curve (TAC), and the constant (Ki) was determined using Patlak analysis of the TACs generated for regions of interest in abdominal subcutaneous fat. These data were used to calculate palmitate uptake rates in abdominal subcutaneous adipose tissue (µmol·kg−1·min−1). Immediately after the dynamic imaging, a static image of the thigh was taken to measure the standardized uptake value (SUV) in thigh adipose tissue, which was scaled to each participant’s abdominal adipose tissue SUV to calculate thigh adipose palmitate uptake rates. Abdominal adipose palmitate uptake using PET [1-11C]palmitate was correlated with, but significantly (P < 0.001) greater than, FFA storage measured using [1-14C]palmitate and adipose biopsy. Thigh adipose palmitate measured using PET calculation was positively correlated (R2 = 0.44, P < 0.0001) with and not different from the biopsy approach. The relative differences between PET measured abdominal subcutaneous adipose tissue palmitate uptake and biopsy-measured palmitate storage were positively correlated (P = 0.03) with abdominal subcutaneous fat. We conclude that abdominal adipose tissue FFA uptake measured using PET does not equate to adipose FFA storage measured using biopsy techniques.
Keywords: Patlak analysis, [1-11C]palmitate, [U-13C]palmitate
INTRODUCTION
In postabsorptive humans adipose tissue lipolysis is virtually the only source of plasma free fatty acids (FFAs). Our group (16, 17, 27) and others (8, 29) have reported that adipose tissue is also one of the tissues that clears FFA from the circulation. Furthermore, depot- and sex-specific differences in direct FFA storage rates appear to suggest that fatty acids are redistributed from some depots to others in a manner that could account for differences in body fat distribution (16). Thus being able to measure direct FFA uptake in different adipose tissue beds simultaneously will be helpful in the investigation of the mechanisms of differences in body fat distribution. The approach we have used most commonly involves the intravenous administration of a 14C- or 3H-labeled FFA tracer followed by carefully timed adipose tissue biopsies (16, 17, 27). Although it is also possible to measure rates of direct FFA storage in visceral adipose tissue using biopsy techniques (1), positron emission tomography (PET) technology offers a much less invasive approach to measure both subcutaneous and visceral adipose FFA uptake (8).
PET imaging studies of tissue FFA uptake are widely accepted as quantitative (5, 8, 15, 25), and when tracers such as [1-11C]palmitate are used, these studies can offer insights into oxidative FFA metabolism (4). However, we found no studies that address whether direct uptake of FFA by adipose tissue as measured by PET can be interpreted as evidence for storage of FFA in adipocyte lipids, which is a process of intense interest when it comes to the study of body fat distribution. Therefore, we directly compared adipose FFA uptake measured by [11C]palmitate PET with direct FFA storage measured using [1-14C]palmitate and tissue biopsies.
RESEARCH DESIGN AND METHODS
Subjects.
Twenty-nine volunteers ranging from normal weight to obese [body mass index (BMI) 19.7–36.9 kg/m2] participated in this study. The protocol was approved by the Institutional Review Board and conducted at the Center for Translational Science Activities Clinical Research Trials Unit and the Nuclear Medicine Department at the Mayo Clinic (Rochester, MN). Written informed consent was obtained from all volunteers.
Materials.
[U-13C]palmitate was purchased from Cambridge Isotope Laboratories (Andover, MA). [l-14C]palmitate was purchased from NEN Life Science Products (PerkinElmer, Boston, MA). [1-11C]palmitate was synthesized by the Nuclear Medicine PET Radiochemistry Laboratory of the Mayo Clinic using previously described techniques (14, 30).
Study protocol.
The study participants came to the Mayo Clinic Center for Translational Science Activities Clinical Research Unit where a screening blood sample was collected and body fat was measured using dual energy X-ray absorptiometry (GE Lunar; General Electric, Madison, WI). On a separate day, the volunteers reported to the Division of Nuclear Medicine after a 12-h overnight fast for the combined [U-13C]palmitate/[1-14C]palmitate infusions/[1-11C]palmitate PET/computed topography (CT) study. Two catheters were inserted: one into the antecubital vein for infusion of [U-13C]palmitate/[1-14C]palmitate and [1-11C]palmitate and the other into a hand vein in the opposite arm for blood sampling. The hand with the intravenous catheter used for blood sampling was placed in a heated box to facilitate sampling of arterialized blood (12). The [U-13C]palmitate continuous infusion (2 nmol·kg−1·min−1) was started ~30 min before the anticipated PET scan to assure isotopic steady state was achieved. In the PET scan suite, each participant underwent a CT scan for localization and attenuation correction of the PET images. Upon completion of the CT scan, an intravenous bolus of [1-11C]palmitate was administered over 1 min. A dynamic PET scan was acquired over the lower chest/upper abdomen commencing with the injection of ~1,110 MBq (30 mCi) of [1-11C]palmitate using the following scan sequence: 20 frames at 3 s, 12 frames at 10 s, 4 frames at 20 s, and 4 frames at 300 s. Hand vein blood samples were obtained before and at frequent intervals after the [1-11C]palmitate bolus. These data were used to determine [U-13C]palmitate enrichment as well as to measure the proportion of blood 11C radioactivity in CO2 versus palmitate. Palmitate uptake in leg adipose tissue was measured by performing a CT scan and static PET scan of the upper thigh immediately after the dynamic scan was completed.
After completion of the PET scan each volunteer received an intravenous bolus of study [1-14C]palmitate timed such that we could perform abdomen and thigh adipose tissue biopsies 30 min later. The biopsies were collected under local anesthesia with sterile technique as previously described (28). After completion of the study, the intravenous catheters were removed and the volunteers were allowed to leave.
Sample analysis.
Plasma palmitate concentrations and enrichment were measured by ultraperformance liquid chromatography with ultraviolet detection and ultraperformance liquid chromatography/mass spectrometry (21, 24), respectively. The PET image arterial time activity curves (TACs) were corrected for 11CO2 according to the procedure of Bergmann et al. (2) follows. Two 1-ml aliquots of blood samples were placed into tubes containing 3 ml of isopropyl alcohol and 1.0 ml of 0.9 M sodium bicarbonate. One milliliter of 6 N HCl was added to one aliquot and 1 ml of 0.1 NaOH was added to the other. These samples were infused with N2 for 10 min. Radioactivity in the samples was assayed with a gamma-well counter, and the data were corrected for isotopic decay. Total 11C radioactivity was measured in the alkalinized aliquot, and non-11CO2 radioactivity (i.e., palmitate) was measured in the acidified aliquot. The 11CO2 in each sample was calculated from the difference.
Adipose tissue analysis.
Abdominal and thigh subcutaneous adipose tissue samples were thoroughly rinsed of blood with saline. An aliquot of the biopsy sample was flash frozen and stored at −80°C until assayed for 14C-labeled lipid radioactivity as previously described (28).
PET/CT image analysis.
Concurrent with the dynamic PET acquisition was a list mode acquisition, from which we retrospectively grouped the data into frames of different duration. All PET images were reconstructed with iterative ordered subset expectation maximization reconstruction algorithm and a Gaussian postfilter of 7 mm. The PET data were corrected for attenuation (using the CT images), random coincidences, and scatter; all frames were decay corrected to the start of the acquisition. Cross calibration of image data and blood samples were performed on the day of each study by imaging a known activity concentration and counting aliquots of this solution in the well counter.
The PET images were transferred to a workstation running PMOD (PMOD Technologies, version 2.8; Zurich, Switzerland). The dynamic images were summed to create a high-count, low-noise image that were used, along with the CT images, as a guide for region of origin (ROI) placement. ROIs were drawn in the left ventricle (LV) cavity and abdominal aorta for the generation of TACs, as well as abdominal subcutaneous and thigh adipose tissue. We used a combination of the measured blood 11C radioactivity and the PET image radioactivity (hybrid approach – see below) for the blood TAC (7) to calculate tissue uptake. The average values for the LV and aorta were used for most of the statistical comparisons; however, we also generated TACs using the maximum count in the aorta ROI to assess whether this provides superior results.
The uptake rate constant (Ki) was determined using the Patlak analysis of the TACs generated for each ROI in the trunk (23). The blood input function was derived from a TAC using the ROI in the LV cavity combined with results from the blood samples corrected for the 11CO2 content. Ki (ml·kg tissue −1·min−1) was then multiplied by whole blood palmitate concentration to calculate palmitate uptake rates in abdominal subcutaneous adipose tissue (µmol kg−1 min−1). The palmitate uptake rates in thigh adipose tissue from the PET images were calculated as follows: standardized uptake values (SUVs), which represent the uptake in an ROI normalized by the amount of radioactivity administered per body weight, were calculated for thigh adipose tissue of the static image and for abdominal adipose tissue of the last frame of the dynamic image. The palmitate uptake rates in thigh adipose tissue were calculated by scaling the palmitate uptake rate in each participant’s abdominal adipose tissue by the ratio of SUV in thigh to abdominal adipose tissue. This assumes that the relative FFA uptake rates for thigh and abdominal adipose tissue are equal to the relative SUVs for these two adipose tissue depots. It has been has shown that the uptake rate constant (or Ki which is the slope of Patlak analysis) is proportional to SUV (10). This means that Ki for abdominal adipose tissue is proportional to SUV for abdominal adipose tissue and Ki for thigh adipose tissue is proportional to SUV for thigh adipose tissue. Therefore, the ratio of uptake rates Ki for thigh adipose tissue to abdominal adipose tissue is equal to the ratio of SUV for thigh adipose tissue to abdominal adipose tissue.
Statistical analysis.
All data are provided as means ± SD unless otherwise indicated. We used paired t-tests to compare adipose tissue palmitate storage calculated using the combination of the [U-13C]palmitate disappearance rates and fractional storage of [1-14C]palmitate in adipose tissue lipid as previously described (17). Pearson’s linear regression analysis was used to determine the degree of agreement between adipose tissue palmitate uptake by biopsy and the various [1-11C]palmitate PET approaches.
RESULTS
Subject characteristics.
Sex, age, BMI, body composition, plasma, and whole blood palmitate concentration data for the volunteers are provided in Table 1. We recruited participants with a wide range of BMI and anticipated plasma FFA concentrations to increase our chances of detecting associations between the PET and biopsy methods. Palmitate flux measured using the [1-13C]palmitate averaged 139 ± 39 µmol/min.
Table 1.
Subject characteristics
| Sex, male/female | 6/23 |
| Age, yr | 35 ± 8 |
| BMI, kg/m2 | 27.8 ± 5.2 |
| Body fat, % | 35 ± 10 |
| Visceral fat, kg | 3.7 ± 3.1 |
| UBSQ fat, kg | 14.7 ± 6.8 |
| Leg fat, kg | 10.5 ± 4.1 |
| Plasma palmitate, µmol/l | 175 ± 53 |
| Whole blood palmitate, µmol/l | 102 ± 26 |
Values represent means ± SD; n = 29 subjects. BMI, body mass index; UBSQ, upper body subcutaneous.
Adipose palmitate uptake by PET versus palmitate storage by biopsy.
Table 2 provides the adipose tissue palmitate uptake values measured using PET [1-11C]palmitate and adipose tissue palmitate storage measured using the [1-14C]palmitate bolus/biopsy approach. Abdominal adipose palmitate uptake using PET [1-11C]palmitate was calculated using three different approaches as described in research design and methods: LV-hybrid, aorta average-hybrid, and aortal max-hybrid. All three approaches of measuring abdominal adipose tissue palmitate uptake were significantly (P < 0.001) greater than abdominal adipose tissue FFA storage measure using [1-14C]palmitate and adipose biopsy. Of interest, thigh adipose palmitate measured using PET calculation was not different from the biopsy approach.
Table 2.
PET [1-11C]palmitate uptake versus biopsy [1-14C]palmitate storage
| Abdominal Adipose Palmitate Uptake (PET) |
||||||
|---|---|---|---|---|---|---|
| LV hybrid | Aorta average hybrid | Aorta max hybrid | Abdominal Adipose Palmitate Storage (Biopsy) | Thigh Adipose Palmitate Uptake (PET) | Thigh Adipose Palmitate Storage (Biopsy) | |
| Means ± SD | 0.89 ± 0.37 | 1.18 ± 0.47 | 0.79 ± 0.39 | 0.39 ± 0.24 | 0.36 ± 0.15 | 0.32 ± 0.18 |
| t-Test P value | <0.001 | <0.001 | <0.001 | – | 0.15 | – |
| r | 0.50 | 0.31 | 0.45 | – | 0.67 | – |
| P value | 0.006 | 0.100 | 0.015 | – | <0.001 | – |
All adipose tissue palmitate uptake rates are expressed as µmol·kg fat−1·min−1. The positron emission tomography (PET) abdominal adipose palmitate uptake rates are compared (r and P) with abdominal adipose palmitate storage using the bolus/biopsy approach, and the PET thigh adipose palmitate uptake rates are compared (r and P) with thigh adipose palmitate storage using the bolus/biopsy approach. LV, left ventricle.
Abdominal adipose tissue palmitate uptake rates measured using PET and the LV hybrid and aorta max-hybrid approaches were significantly correlated with the rates of palmitate storage by the bolus/biopsy approach (Table 2 and Fig. 1, A and B), whereas the abdominal adipose tissue PET and bolus biopsy values were not significantly correlated when palmitate uptake was calculated using the aorta average-hybrid approach (Table 2 and Fig. 1C). Again, the palmitate uptake in thigh adipose tissue measure with was strongly correlated with thigh adipose palmitate storage measured using [1-14C]palmitate bolus/adipose biopsy approach (Table 2 and Fig. 1D). There were no sex differences in the relationship between palmitate uptake in abdominal adipose tissue (LV hybrid) and biopsy measured palmitate storage rates.
Fig. 1.

Relationships between adipose tissue positron emission tomography (PET) [1-11C]palmitate uptake and biopsy-measured [1-14C]palmitate storage. Palmitate storage in abdominal and thigh subcutaneous fat measured using a bolus/biopsy approach is plotted versus adipose palmitate uptake measured using PET with [1-11C]palmitate. A: abdominal subcutaneous palmitate uptake measured with biopsy versus PET calculated using the left ventricle (LV) hybrid time activity curve for the input function. B: abdominal subcutaneous palmitate uptake measured with biopsy versus PET calculated using the aorta max-hybrid time activity curve for the input function. C: abdominal subcutaneous palmitate uptake measured with biopsy versus PET calculated using the aorta average-hybrid time activity curve for the input function. D: femoral subcutaneous palmitate uptake measured with biopsy versus PET calculated using the ratio of the standardized uptake values in thigh versus abdominal adipose tissue.
The three different PET approaches to measuring palmitate uptake in abdominal subcutaneous adipose tissue were in good agreement. Direct uptake of palmitate by abdominal adipose tissue measured using the LV hybrid correlated with the aorta average hybrid approach (r = 0.89, P < 0.0001) and the aorta max-hybrid approach (r = 0.90, P < 0.0001). These values were also correlated between the aorta average-hybrid and aorta max-hybrid approaches (r = 0.83, P < 0.0001).
We noted that the differences between PET measured abdominal subcutaneous adipose tissue palmitate uptake and biopsy-measured palmitate storage were not consistent and that it tended to be more pronounced in participants with obesity compared with those without. To examine this possibility more specifically, we assessed the relationship between the amount of abdominal subcutaneous adipose tissue measured by CT and the relative difference between PET (LV-hybrid model) and biopsy measures (Fig. 2). There was a significant (P = 0.03), positive correlation between the relative difference in PET-measured palmitate uptake and biopsy-measured palmitate storage.
Fig. 2.
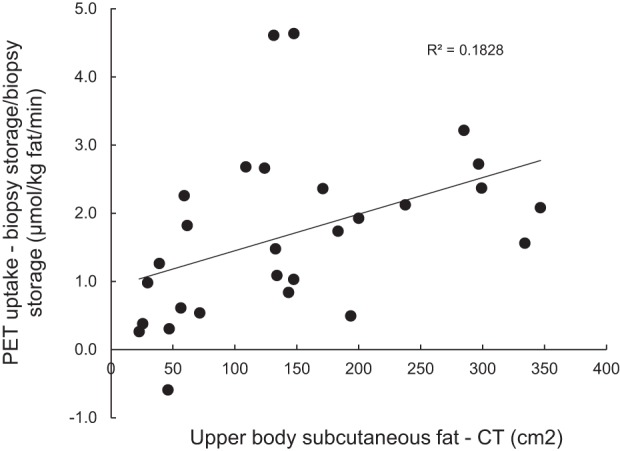
Abdominal fat and measures of abdominal adipose fatty acid uptake/storage. The amount of abdominal subcutaneous fat measured by a single slice computed topography (CT) of the abdomen is plotted versus the relative differences between palmitate storage in abdominal subcutaneous fat measured using a bolus/biopsy approach and adipose palmitate uptake measured using positron emission tomography (PET) with [1-11C]palmitate.
DISCUSSION
PET imaging provides a noninvasive method to measure FFA uptake in multiple tissues (6), including adipose tissue (3, 8). Although some investigators have validated PET-measured myocardial metabolism of FFA with independent methods (4), we found no reports comparing PET measures of adipose tissue FFA uptake with independent, biopsy-proven assessments of adipose tissue FFA storage rates. We undertook this study to determine whether we could substitute [1-11C]palmitate/PET approaches for the more invasive and time-consuming approach that involves a continuous infusion [U-13C]palmitate combined with an intravenous bolus of a 3H- or 14C-labeled FFA, followed by timed biopsies of subcutaneous (16) or visceral (1) fat. We found that the PET approaches to measuring palmitate uptake overestimated palmitate storage in abdominal fat as measured by a [1-14C]palmitate tracer, irrespective of the approach to handling the input function for PET. Despite the overestimate by PET for abdominal subcutaneous fat, PET measures of thigh adipose palmitate uptake were not only numerically similar to biopsy estimates of palmitate storage rates, they were well correlated. The difference between PET-measured abdominal adipose tissue FFA uptake and biopsy-measured FFA storage was statistically linked to the amount of abdominal subcutaneous fat. These data suggest to us that there may be systematic errors in the assessment of adipose tissue FFA metabolism if one attempts to equate PET-measured FFA “uptake” with direct FFA storage.
Our [1-11C]palmitate/PET imaging protocol involves 20 min of dynamic imaging to measure palmitate uptake in truncal tissues, followed by a static scan of the legs (6). This approach seems to be appropriate for heart (4) and liver (11). The main reason we opted for a 20-min dynamic scan duration was because our initial studies indicated the Patlak plot became nonlinear after 20 min, probably due to the recycling of palmitate tracer into circulating VLDL particles, which typically begins 20–30 min after the FFA tracer is administered (28). This problem can create errors in the input function absent heroic efforts (11) to distinguish different plasma lipid fractions; the short half-life of 11C requires immediate sample processing. We suspect that limiting the dynamic scan time to 20 min to avoid [11C]palmitate recycling into VLDL may have contributed to the finding that calculated palmitate uptake in abdominal subcutaneous fat was substantially greater than palmitate storage as measured by the bolus/biopsy approach. Analysis of our preexisting data suggests there is insufficient appearance of [11C]palmitate in VLDL-triglyceride (TG) during the studies to account for potential errors in the Patlak analysis. We have measured the appearance of FFA in VLDL-TG in over 100 volunteers (18) and almost never detect radiolabeled FFA in VLDL-TG at 15 min after a bolus injection of [14C]palmitate or [3H]palmitate. That said, there was always incorporation of the FFA tracer in VLDL-TG at the 30-min time point after a bolus. Thus there is the potential for a small, but measureable amount of the [11C]palmitate to appear in VLDL-TG between 15 and 20 min in the present study, at a time when the blood radioactivity content is low and would have minimal effects on the calculated tissue uptake. To the extent that a small amount of [11C]palmitate-VLDL is contaminating our measure of blood [11C]palmitate content, this would not be expected to materially affect our calculations of abdominal adipose tissue palmitate uptake. Although we have not measured the relative amounts of [14C]palmitate in the FFA and VLDL portions of plasma at 20 min after a bolus injection, we have made a worst case projection based upon our extensive database using [14C]palmitate and [3H]palmitate to measure incorporation of FFA into VLDL (18). If we assume that the radiolabeled palmitate begins appearing in VLDL immediately after the 15-min time point and increases linearly from that time to the 30-min sample, we can estimate the whole blood content of labeled VLDL at 20 min. If we also assume that the decrease in [14C]palmitate in plasma FFA decreases linearly from the 15-min to the 30-min sample, the whole blood content of labeled FFA-palmitate at 20 min can be estimated. Based on these previous data, we calculate that ~75% of plasma fatty acid (FFA + VLDL-TG) radioactivity is in the FFA fraction. We calculate that in the last 1 min of our dynamic PET scan the maximum contribution of a VLDL-labeled compound to blood lipid 11C would be 25%. This would be expected to have virtually no impact on the modeling of FFA uptake into abdominal adipose tissue, because Ki is equal to the total radioactivity concentration in tissue at time T minus “free” radioactivity in tissue at time T divided by the integral of the input function up to time T. Because there is negligible “free” nonspecific activity as compared with the total radioactivity in tissue, our calculations of Ki are accurate. If up to 25% of radioactivity is in VLDL, but total blood radioactivity is low, then that “free” radioactivity becomes a smaller percentage when considering tissue in Patlak analysis.
Patlak analysis is a linearization of a two compartment model in which the tracer becomes irreversibly trapped in the second compartment, in this case adipose tissue. By linearizing the model the rate parameter Ki can be found from a least squares fit (the slope of the Patlak plot), which is from equilibrium to the end of the acquisition (20 min). Thus, the analysis interprets the uptake in tracer for the majority of the dynamic scan, including the completion. In previous studies we found significant amounts of radiolabeled, nonesterified fatty acids present in adipose tissue if the biopsies were collected 15–20 min after a tracer injection (28). This is likely related to the ~3.5-min half-life of FFA (9) (thus only 5–6 half-lives had passed), the low rates of adipose tissue blood flow (13, 26), and the low fractional extraction of FFA across adipose tissue. This combination of factors might allow enough FFA-[1-11C]palmitate to remain in the adipose tissue microcirculation after 20 min to be interpreted as “uptake” in the model we employed. The finding that the relative excess of PET-measured abdominal subcutaneous adipose palmitate uptake relative to biopsy-measured palmitate storage was correlated with abdominal fat measured by CT could be explained by the ever lower rates of adipose blood flow in adults with obesity (13). The relatively good agreement between PET-measured femoral adipose tissue palmitate uptake and biopsy measured femoral adipose tissue palmitate storage could be explained by the additional passage of time that allowed the [1-11C]palmitate tracer to largely leave the femoral adipose microcirculation by the time of the static scan.
[1-11C]palmitate PET has been used to evaluate myocardial (4) and hepatic (11) FFA metabolism, being especially useful when FFA oxidation measures are of interest. For adipose tissue FFA uptake, {(18)F]fluoro-6-thia-hepta-decanoic acid [(18)F]FTHA} has been more widely used (3, 8, 20, 22). [(18)F]FTHA is a long-chain fatty acid substrate that, when entered into transported into the β-oxidation pathway in mitochondria, becomes trapped when oxidation past the first two acetyl-CoAs is blocked by a sulfur heteroatom. An advantage of [(18)F]FTHA is the longer half-life (>5 times that of 11C), allowing more deliberate and refined measures of plasma metabolites. However, it has the disadvantage of potentially different metabolic handling compared with carbon or hydrogen based tracers due to the presence of fluorine and sulfur in the molecule. When possible, we have used carbon-based FFA tracers for our studies, but this may be the first study to have included all thre carbon labeled palmitate tracers.
This appears to be one of the few studies (4) to directly compare FFA uptake using tissue sampling methods to PET-derived measures and the only one to assess adipose tissue. Although we did not compare PET and the bolus/biopsy measures of direct storage rates of FFA in adipose tissue in the postprandial state, it is possible the results could be different given the greater fractional storage of FFA in adipose tissue under these conditions (19). The finding that PET and biopsy measures of abdominal and femoral adipose palmitate uptake/storage are correlated is somewhat reassuring, although the amount of variance in directly measured storage that can be accounted for by PET-measured uptake is <50%. This will need to be taken into account when planning future studies of adipose FFA metabolism measured using PET methods.
In summary, PET measures of abdominal subcutaneous adipose tissue FFA uptake using a 20-min dynamic scan and [1-11C]palmitate substantially overestimates FFA storage measured using an independent tracer bolus/biopsy approach. It seems likely that this can be corrected by using a longer dynamic scan time, but this will also require processing of blood samples to account for both 11CO2 and other secondary FFA metabolites, such as VLDL, that incorporate the [11C]palmitate. Solving this problem would allow wider use of FFA-PET studies to investigate adipose tissue function. However, the lack of excellent agreement between adipose FFA uptake measured by PET and biopsy measured direct FFA storage will need to be considered when power calculations are conducted for future studies.
GRANTS
This study was supported by National Institute of Diabetes and Digestive and Kidney Diseases Grants DK-40484 and DK-45343 and the Mayo Clinic for Charlton Clinical Research and Trials Unit.
DISCLOSURES
No conflicts of interest, financial or otherwise, are declared by the authors.
AUTHOR CONTRIBUTIONS
M.D.J. conceived and designed research; N.G., Q.H., and B.J.K. performed experiments; Y.C., N.G., Q.H., B.J.K., and M.D.J. analyzed data; Y.C., Q.H., B.J.K., and M.D.J. interpreted results of experiments; Y.C. and M.D.J. prepared figures; Y.C. and M.D.J. drafted manuscript; B.J.K. and M.D.J. edited and revised manuscript; Y.C., N.G., Q.H., B.J.K., and M.D.J. approved final version of manuscript.
REFERENCES
- 1.Ali AH, Koutsari C, Mundi M, Stegall MD, Heimbach JK, Taler SJ, Nygren J, Thorell A, Bogachus LD, Turcotte LP, Bernlohr D, Jensen MD. Free fatty acid storage in human visceral and subcutaneous adipose tissue: role of adipocyte proteins. Diabetes 60: 2300–2307, 2011. doi: 10.2337/db11-0219. [DOI] [PMC free article] [PubMed] [Google Scholar]
- 2.Bergmann SR, Weinheimer CJ, Markham J, Herrero P. Quantitation of myocardial fatty acid metabolism using PET. J Nucl Med 37: 1723–1730, 1996. [PubMed] [Google Scholar]
- 3.Bucci M, Karmi AC, Iozzo P, Fielding BA, Viljanen A, Badeau RM, Borra R, Saunavaara V, Pham T, Hannukainen JC, Kalliokoski K, Haaparanta-Solin M, Viljanen T, Parkkola R, Frayn KN, Nuutila P. Enhanced fatty acid uptake in visceral adipose tissue is not reversed by weight loss in obese individuals with the metabolic syndrome. Diabetologia 58: 158–164, 2015. doi: 10.1007/s00125-014-3402-x. [DOI] [PubMed] [Google Scholar]
- 4.Coggan AR, Kisrieva-Ware Z, Dence CS, Eisenbeis P, Gropler RJ, Herrero P. Measurement of myocardial fatty acid esterification using [1-11C]palmitate and PET: comparison with direct measurements of myocardial triglyceride synthesis. J Nucl Cardiol 16: 562–570, 2009. doi: 10.1007/s12350-009-9102-0. [DOI] [PMC free article] [PubMed] [Google Scholar]
- 5.Guiducci L, Järvisalo M, Kiss J, Någren K, Viljanen A, Naum AG, Gastaldelli A, Savunen T, Knuuti J, Salvadori PA, Ferrannini E, Nuutila P, Iozzo P. [11C]palmitate kinetics across the splanchnic bed in arterial, portal and hepatic venous plasma during fasting and euglycemic hyperinsulinemia. Nucl Med Biol 33: 521–528, 2006. doi: 10.1016/j.nucmedbio.2006.02.003. [DOI] [PubMed] [Google Scholar]
- 6.Hames KC, Vella A, Kemp BJ, Jensen MD. Free fatty acid uptake in humans with CD36 deficiency. Diabetes 63: 3606–3614, 2014. doi: 10.2337/db14-0369. [DOI] [PMC free article] [PubMed] [Google Scholar]
- 7.Han Q, Cao Y, Gathaiya N, Kemp BJ, Jensen MD. Free fatty acid flux measured using [1-11C]palmitate positron emission tomography and [U-13C]palmitate in humans. Am J Physiol Endocrinol Metab 314: E413–E417, 2018. doi: 10.1152/ajpendo.00284.2017. [DOI] [PMC free article] [PubMed] [Google Scholar]
- 8.Hannukainen JC, Kalliokoski KK, Borra RJ, Viljanen AP, Janatuinen T, Kujala UM, Kaprio J, Heinonen OJ, Viljanen T, Haaparanta M, Iozzo P, Parkkola R, Nuutila P. Higher free fatty acid uptake in visceral than in abdominal subcutaneous fat tissue in men. Obesity (Silver Spring) 18: 261–265, 2010. doi: 10.1038/oby.2009.267. [DOI] [PubMed] [Google Scholar]
- 9.Heiling VJ, Miles JM, Jensen MD. How valid are isotopic measurements of fatty acid oxidation? Am J Physiol Endocrinol Metab 261: E572–E577, 1991. doi: 10.1152/ajpendo.1991.261.5.E572. [DOI] [PubMed] [Google Scholar]
- 10.Huang SC. Anatomy of SUV. Standardized uptake value. Nucl Med Biol 27: 643–646, 2000. doi: 10.1016/S0969-8051(00)00155-4. [DOI] [PubMed] [Google Scholar]
- 11.Iozzo P, Bucci M, Roivainen A, Nagren K, Jarvisalo MJ, Kiss J, Guiducci L, Fielding B, Naum AG, Borra R, Virtanen K, Savunen T, Salvadori PA, Ferrannini E, Knuuti J, Nuutila P. Fatty acid metabolism in the liver, measured by positron emission tomography, is increased in obese individuals. Gastroenterology 139: 846–856.e6, 2010. [DOI] [PubMed] [Google Scholar]
- 12.Jensen MD, Heiling VJ. Heated hand vein blood is satisfactory for measurements during free fatty acid kinetic studies. Metabolism 40: 406–409, 1991. doi: 10.1016/0026-0495(91)90152-M. [DOI] [PubMed] [Google Scholar]
- 13.Karpe F, Fielding BA, Ilic V, Macdonald IA, Summers LK, Frayn KN. Impaired postprandial adipose tissue blood flow response is related to aspects of insulin sensitivity. Diabetes 51: 2467–2473, 2002. doi: 10.2337/diabetes.51.8.2467. [DOI] [PubMed] [Google Scholar]
- 14.Kihlberg T, Valind S, Längström B. Synthesis of fatty acids specifically labelled with 11C in various positions, including 2H substitution, for in vivo studies of myocardium using PET. Nucl Med Biol 21: 1053–1065, 1994. doi: 10.1016/0969-8051(94)90177-5. [DOI] [PubMed] [Google Scholar]
- 15.Kisrieva-Ware Z, Coggan AR, Sharp TL, Dence CS, Gropler RJ, Herrero P. Assessment of myocardial triglyceride oxidation with PET and 11C-palmitate. J Nucl Cardiol 16: 411–421, 2009. doi: 10.1007/s12350-009-9051-7. [DOI] [PMC free article] [PubMed] [Google Scholar]
- 16.Koutsari C, Ali AH, Mundi MS, Jensen MD. Storage of circulating free fatty acid in adipose tissue of postabsorptive humans: quantitative measures and implications for body fat distribution. Diabetes 60: 2032–2040, 2011. doi: 10.2337/db11-0154. [DOI] [PMC free article] [PubMed] [Google Scholar]
- 17.Koutsari C, Mundi MS, Ali AH, Jensen MD. Storage rates of circulating free fatty acid into adipose tissue during eating or walking in humans. Diabetes 61: 329–338, 2012. doi: 10.2337/db11-0748. [DOI] [PMC free article] [PubMed] [Google Scholar]
- 18.Koutsari C, Mundi MS, Ali AH, Patterson BW, Jensen MD. Systemic free fatty acid disposal into very low-density lipoprotein triglycerides. Diabetes 62: 2386–2395, 2013. doi: 10.2337/db12-1557. [DOI] [PMC free article] [PubMed] [Google Scholar]
- 19.Koutsari C, Snozek CL, Jensen MD. Plasma NEFA storage in adipose tissue in the postprandial state: sex-related and regional differences. Diabetologia 51: 2041–2048, 2008. doi: 10.1007/s00125-008-1126-5. [DOI] [PMC free article] [PubMed] [Google Scholar]
- 20.Labbé SM, Grenier-Larouche T, Croteau E, Normand-Lauzière F, Frisch F, Ouellet R, Guérin B, Turcotte EE, Carpentier AC. Organ-specific dietary fatty acid uptake in humans using positron emission tomography coupled to computed tomography. Am J Physiol Endocrinol Metab 300: E445–E453, 2011. doi: 10.1152/ajpendo.00579.2010. [DOI] [PubMed] [Google Scholar]
- 21.Miles JM, Ellman MG, McClean KL, Jensen MD. Validation of a new method for determination of free fatty acid turnover. Am J Physiol Endocrinol Metab 252: E431–E438, 1987. doi: 10.1152/ajpendo.1987.252.3.E431. [DOI] [PubMed] [Google Scholar]
- 22.Ouellet V, Labbé SM, Blondin DP, Phoenix S, Guérin B, Haman F, Turcotte EE, Richard D, Carpentier AC. Brown adipose tissue oxidative metabolism contributes to energy expenditure during acute cold exposure in humans. J Clin Invest 122: 545–552, 2012. doi: 10.1172/JCI60433. [DOI] [PMC free article] [PubMed] [Google Scholar]
- 23.Patlak CS, Blasberg RG. Graphical evaluation of blood-to-brain transfer constants from multiple-time uptake data. Generalizations. J Cereb Blood Flow Metab 5: 584–590, 1985. doi: 10.1038/jcbfm.1985.87. [DOI] [PubMed] [Google Scholar]
- 24.Persson XM, Blachnio-Zabielska AU, Jensen MD. Rapid measurement of plasma free fatty acid concentration and isotopic enrichment using LC/MS. J Lipid Res 51: 2761–2765, 2010. doi: 10.1194/jlr.M008011. [DOI] [PMC free article] [PubMed] [Google Scholar]
- 25.Peterson LR, Herrero P, McGill J, Schechtman KB, Kisrieva-Ware Z, Lesniak D, Gropler RJ. Fatty acids and insulin modulate myocardial substrate metabolism in humans with type 1 diabetes. Diabetes 57: 32–40, 2008. doi: 10.2337/db07-1199. [DOI] [PubMed] [Google Scholar]
- 26.Romanski SA, Nelson RM, Jensen MD. Meal fatty acid uptake in adipose tissue: gender effects in nonobese humans. Am J Physiol Endocrinol Metab 279: E455–E462, 2000. doi: 10.1152/ajpendo.2000.279.2.E455. [DOI] [PubMed] [Google Scholar]
- 27.Santosa S, Jensen MD. Adipocyte fatty acid storage factors enhance subcutaneous fat storage in postmenopausal women. Diabetes 62: 775–782, 2013. doi: 10.2337/db12-0912. [DOI] [PMC free article] [PubMed] [Google Scholar]
- 28.Shadid S, Koutsari C, Jensen MD. Direct free fatty acid uptake into human adipocytes in vivo: relation to body fat distribution. Diabetes 56: 1369–1375, 2007. doi: 10.2337/db06-1680. [DOI] [PubMed] [Google Scholar]
- 29.Søndergaard E, Gormsen LC, Nellemann B, Jensen MD, Nielsen S. Body composition determines direct FFA storage pattern in overweight women. Am J Physiol Endocrinol Metab 302: E1599–E1604, 2012. doi: 10.1152/ajpendo.00015.2012. [DOI] [PubMed] [Google Scholar]
- 30.Zielinski F, Robinson G Jr. Synthesis of high purity 11C labeled palmitic acid for measurement of regional myocardial perfusion and metabolism. Int J Nucl Med Biol 11: 121–128, 1984. doi: 10.1016/0047-0740(84)90047-0. [DOI] [PubMed] [Google Scholar]