Abstract
The aberrant expression of long non-coding RNAs (lncRNAs) has been associated with a variety of malignancies, including colorectal cancer (CRC); however, the key lncRNAs associated with patient prognosis and their biological roles in CRC are yet to be determined. The aim of the present study was to determine the key lncRNAs associated with patient prognosis as well as their biological roles in CRC. Therefore, a dataset from The Cancer Genome Atlas containing the lncRNA expression data of 521 CRC and normal colorectal mucosal tissues, as well as the corresponding clinical data, were screened. A total of 1,180 significantly differentially expressed lncRNAs were associated with CRC as determined by t-tests in edgeR. Kaplan-Meier analysis revealed that 56 of the 1,180 lncRNAs were associated with overall survival (OS); 7 of the 56 lncRNAs were identified as key lncRNAs associated with the Tumor-Node-Metastasis stage of CRC by Kruskal-Wallis test. Subsequent univariate and multivariate Cox regression analyses of the 7 lncRNAs revealed 2 lncRNAs, DNAH17-AS1 and RP11-400N13.2, as potential independent prognostic factors for the OS of patients with CRC. Furthermore, the expression levelsof these 2 lncRNAs were significantly upregulated in CRC compared with those in normal tissues, which suggested that they may serve an oncogenic role in CRC. In addition, networks comprising the 2 lncRNAs and their respective co-expressed protein-coding genes (PCGs) were constructed using cor.test in R. Gene Ontology and Kyoto Encyclopedia of Genes and Genomes enrichment analyses of these PCGs were conducted; DNAH17-AS1- and RP11-400N13.2-associated PCGs were reported to be involved in G-protein coupling-related functions. Thus, these independent prognostic lncRNAs and their associated functions identified in the present study may provide novel insight into potential prognostic biomarkers and therapeutic targets for the treatment of CRC.
Keywords: DNAH17-AS1, RP11-400N13.2, colorectal cancer, long non-coding RNA, bioinformatics analysis, independent prognostic biomarker, oncogenic
Introduction
Colon cancer is the most common type of tumor of the gastrointestinal tract, and ranks as the third highest cause of cancer-associated mortality worldwide (1). The etiology and pathogenesis of colon cancer are complex and are associated with various factors, such as diet- and lifestyle-associated genetic and epigenetic changes (2). Recent advances in the treatment of colon cancer have been reported, including surgery combined with chemotherapy, radiofrequency ablation or targeted therapy; however, the rate of postoperative recurrence remain at ~50%, leading to a poor overall survival (OS) for the patients with colon cancer (3). Therefore, there is an urgent need to identify novel biomarkers and potential therapeutic targets for this deadly disease (4).
Long non-coding RNAs (lncRNAs), which are >200 nucleotides in length, have been reported to act as key regulators of various biological processes; the aberrant expression of lncRNAs are associated with several diseases, including cancer (5–9). Accumulating evidence has suggested that lncRNAs could serve as potential biomarkers for the early diagnosis, prognosis and prediction of metastasis for various types of malignancy (10–15).
In recent years, with advances in bioinformatics and interdisciplinary studies involving the development of a series of computational methods and software tools for the analysis of extensive biological data, numerous lncRNAs have been identified to be dysregulated in colon cancer. For instance, by a bioinformatic approach, a recent study classified Linc00659 as a novel oncogenic lncRNA involved in the tumorigenesis of colon cancer by modulating the progression of the cell cycle; downregulation of Linc00659 expression resulted in severe cell cycle arrest and enhanced the apoptosis of colon cancer cells (16). Similarly, based on bioinformatics analysis of The Cancer Genome Atlas (TCGA) and/or the Gene Expression Omnibus datasets, as well as subsequent experimental validation, metastasis-associated lung adenocarcinoma transcript 1 and small nuclear host gene 1 have been recently identified to be oncogenic lncRNAs, which may serve as potential diagnostic and therapeutic targets in colorectal cancer (CRC) (17–20). These results suggest the potential clinical value of lncRNAs in CRC; however, the lncRNAs associated with the prognosis and survival of patients, as well as their biological roles, require further investigation.
Therefore, the present study aimed to identify the key lncRNAs associated with their prognostic and biological roles using a comprehensive bioinformatics process. The gene expression datasets downloaded from The Cancer Genome Atlas (TCGA) database, which includes the corresponding survival and Tumor-Node-Metastasis (TNM) stage (21) status of patients with CRC, were utilized to construct a prognostic prediction system.
Materials and methods
TCGA CRC data mining and screening
The level 3 normalized lncRNA expression data of CRC, CRC gene expression data and corresponding clinical data were obtained from the TCGA database (https://cancergenome.nih.gov). The expression profiling platform RNA-seqv2 was used. No further normalizations were applied to the level 3 lncRNA expression profile data. A total of 521 samples were obtained, of which 480 were CRC tissues and 41 were adjacent normal tissues. The lncRNA expression profile of tumor and normal tissues was determined to screen for differentially expressed lncRNAs using edgeR (http://www.bioconductor.org/packages/release/bioc/html/edgeR.html; R software; version 3.4.2; Bell Laboratories) with thresholds of |log2[fold-change (FC)]|>2.0 and adjusted P-value [false discovery rate (FDR)]<0.05. A volcano plot was generated using theplot function in R (https://www.rdocumentation.org/packages/graphics/versions/3.6.0/topics/pl; R software; version 3.4.2; Bell Laboratories).
Survival analysis
Kaplan-Meier analysis followed by a log-rank test was performed to assess the OS between low- and high-lncRNA expression groups using the R package ‘survival’ (https://cran.r-project.org/web/packages/survival/index.html; R software; version 3.4.2; Bell Laboratories). The Kruskal-Wallis test was used to evaluate the association between tumor stage. The staging system of colon cancer using UICC/AJCC (7th edition) (21), and the lncRNAs that were significantly associated with OS. Additionally, univariate and multivariate Cox regression analyses were used to evaluate the association between the expression levels of lncRNAs and the OS of patients with CRC, and to identify independent prognostic values of lncRNAs. P<0.05 was considered to indicate a statistically significant difference.
Analysis of co-expressed protein-coding genes (PCGs)
To determine the association between lncRNAs and co-expressed PCGs, the Pearson correlation coefficients (r) of the lncRNAs and PCGs were calculated using the cor.test function in R. The PCGs with |r|>0.4 and P<0.001 were considered as lncRNA-associated PCGs.
Functional and pathway enrichment analyses
The identified co-expressed PCGs were further investigated using clusterProfiler R package (http://www.bioconductor.org/packages/release/bioc/html/clusterProfiler.html; R software; version 3.4.2; Bell Laboratories), including functional Gene Ontology (GO) (22) and Kyoto Encyclopedia of Genes and Genomes (KEGG) (23) pathway enrichment analyses. P<0.05 was considered to indicate a statistically significant difference.
Results
Identification of significantly differentially expressed lncRNAs in CRC
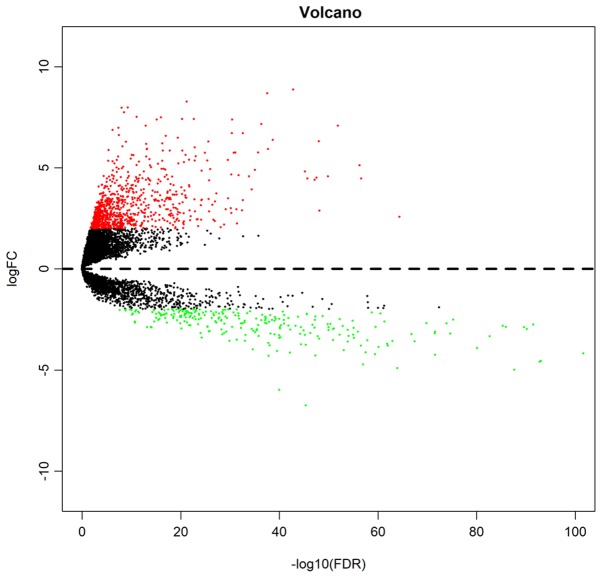
In a preliminary screening, the data of 480 CRC and 41 adjacent normal colorectal mucosal tissues were extracted from the symbol matrix. A total of 1,180 significant differentially expressed lncRNAs were identified with |logFC|>2 and FDR<0.05, of which 916 were upregulated and 264 were downregulated. A volcano plot of the identified lncRNAs was constructed (Fig. 1). The top 10 upregulated and downregulated lncRNAs are presented in Tables I and II.
Figure 1.
Volcano plot of significantly differentially expressed lncRNAs associated with colorectal cancer. Red, green and black dots represent upregulated, downregulated and non-differentially expressed lncRNAs, respectively. lncRNA, long non-coding RNA; FC, fold-change; FDR, false discovery rate.
Table I.
Top 10 upregulated lncRNAs with significantly different expression between tumor and normal tissues in The Cancer Genome Atlas colon cancer data.
| lncRNA | Ensembl_Gene_ID | logFC | P-value | FDR |
|---|---|---|---|---|
| PVT1 | ENSG00000249859 | 2.58 | 1.70×10−67 | 4.23×10−65 |
| CCAT1 | ENSG00000247844 | 4.47 | 1.68×10−59 | 2.51×10−57 |
| BLACAT1 | ENSG00000281406 | 5.12 | 3.88×10−59 | 5.59×10−57 |
| LINC02163 | ENSG00000251026 | 7.08 | 1.19×10−54 | 1.37×10−52 |
| CRNDE | ENSG00000245694 | 4.58 | 1.30×10−52 | 1.31×10−50 |
| MAFG-AS1 | ENSG00000265688 | 2.88 | 7.82×10−51 | 7.51×10−49 |
| RP5-884M6.1 | ENSG00000228742 | 6.31 | 1.04×10−50 | 9.69×10−49 |
| CASC19 | ENSG00000254166 | 4.51 | 3.30×10−50 | 3.02×10−48 |
| RP5-1120P11.1 | ENSG00000237686 | 4.41 | 7.64×10−50 | 6.65×10−48 |
| AC007128.1 | ENSG00000229970 | 4.48 | 2.64×10−48 | 2.17×10−46 |
lncRNA, long non-coding RNA; FC, fold-change; FDR, false discovery rate.
Table II.
Top 10 downregulated lncRNAs with significantly different expression between tumor and normal tissues in The Cancer Genome Atlas colon cancer data.
| lncRNA | Ensembl_Gene_ID | logFC | P-value | FDR |
|---|---|---|---|---|
| XXbac-B476C20.9 | ENSG00000225335 | −2.72 | 2.14×10−173 | 1.60×10−169 |
| CDKN2B-AS1 | ENSG00000240498 | −5.21 | 9.05×10−140 | 3.39×10−136 |
| LINC01645 | ENSG00000224968 | −4.60 | 6.90×10−127 | 1.72×10−123 |
| PP7080 | ENSG00000188242 | −3.48 | 3.24×10−124 | 6.07×10−121 |
| XXyac-YM21GA2.7 | ENSG00000214888 | −5.69 | 7.06×10−120 | 1.06×10−116 |
| RP11-1090M7.1 | ENSG00000265489 | −4.48 | 1.49×10−116 | 1.85×10−113 |
| RP11-396O20.2 | ENSG00000254645 | −5.01 | 1.71×10−114 | 1.83×10−111 |
| AC007182.6 | ENSG00000224721 | −4.67 | 4.65×10−108 | 4.35×10−105 |
| AC106869.2 | ENSG00000226087 | −4.18 | 2.71×10−105 | 2.25×10−102 |
| LINC00682 | ENSG00000245870 | −4.55 | 1.18×10−96 | 8.82×10−94 |
lncRNA, long non-coding RNA; FC, fold-change; FDR, false discovery rate.
Analysis of significant differentially expressed lncRNAs in CRC samples associated with OS and pathological stages
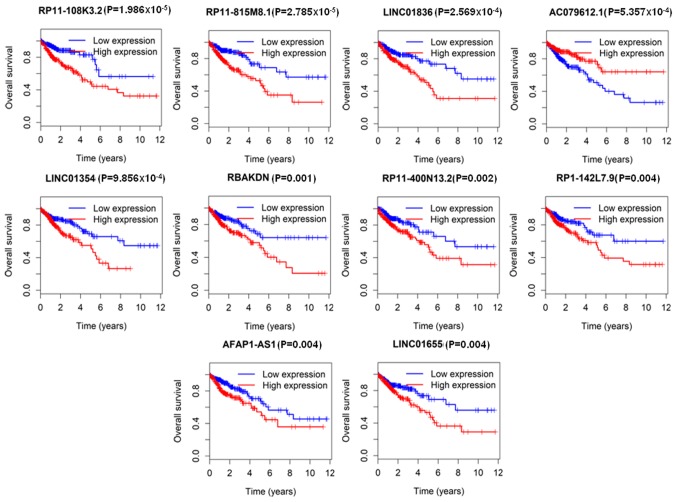
To investigate the association between lncRNA expression and OS, the expression profile of the 1,180 lncRNAs in tumor samples were determined, of which 56 lncRNAs were associated with OS, as determined by Kaplan-Meier analysis (Table III). The top 10 lncRNAs significantly associated with OS (P<0.05) were RP11-108K3.2, RP11-815M8.1, LINC01836, AC079612.1, LINC01354, RBAKDN, RP11-400N13.2, RP1-142L7.9, AFAP1-AS1 and LINC01655 (Fig. 2).
Table III.
lncRNAs significantly associated with OS.
| lncRNA | Ensembl_Gene_ID | P-value |
|---|---|---|
| RP11-108K3.2 | ENSG00000259306 | 1.98646×10⁻⁵ |
| RP11-815M8.1 | ENSG00000238042 | 2.78454×10⁻⁵ |
| LINC01836 | ENSG00000267530 | 0.000256940 |
| AC079612.1 | ENSG00000196758 | 0.000535749 |
| LINC01354 | ENSG00000231768 | 0.000985613 |
| RBAKDN | ENSG00000273313 | 0.001143877 |
| RP11-400N13.2 | ENSG00000228437 | 0.002268513 |
| RP1-142L7.9 | ENSG00000270661 | 0.003700521 |
| AFAP1-AS1 | ENSG00000272620 | 0.004000305 |
| LINC01655 | ENSG00000227925 | 0.004380952 |
| RP11-10A14.5 | ENSG00000248538 | 0.004693149 |
| RP11-384P7.7 | ENSG00000260947 | 0.004845978 |
| RP11-434D9.2 | ENSG00000249894 | 0.005561553 |
| RP11-742B18.1 | ENSG00000249001 | 0.007363036 |
| CTC-327F10.4 | ENSG00000251320 | 0.008786437 |
| AC064834.1 | ENSG00000224099 | 0.00890189 |
| ARHGEF26-AS1 | ENSG00000243069 | 0.008966797 |
| RP3-380B8.4 | ENSG00000233064 | 0.009485845 |
| LINC01829 | ENSG00000236780 | 0.009974597 |
| GAS1RR | ENSG00000226237 | 0.013908392 |
| RP11-84A19.4 | ENSG00000269967 | 0.014180465 |
| LINC02043 | ENSG00000232233 | 0.016339686 |
| LINC00922 | ENSG00000261742 | 0.016854765 |
| RP11-278L15.2 | ENSG00000243885 | 0.017325027 |
| RP1-122P22.4 | ENSG00000268628 | 0.018507105 |
| RP11-366L20.2 | ENSG00000197301 | 0.019632443 |
| DUXAP8 | ENSG00000206195 | 0.020361403 |
| CTB-181H17.1 | ENSG00000272219 | 0.020685373 |
| MIR31HG | ENSG00000171889 | 0.021365649 |
| AC012531.25 | ENSG00000260597 | 0.023942649 |
| FOXD3-AS1 | ENSG00000230798 | 0.024144909 |
| AC007128.1 | ENSG00000229970 | 0.027145232 |
| DNAH17-AS1 | ENSG00000267432 | 0.02735923 |
| LINC01833 | ENSG00000259439 | 0.027941465 |
| RP11-429J17.5 | ENSG00000254548 | 0.028089082 |
| LL22NC03-N14H11.1 | ENSG00000272872 | 0.031532618 |
| RP1-79C4.4 | ENSG00000271811 | 0.031571197 |
| CTB-186G2.4 | ENSG00000267375 | 0.031679272 |
| RP11-114H23.2 | ENSG00000258088 | 0.033221364 |
| LINC00484 | ENSG00000229694 | 0.035515205 |
| RP1-29C18.10 | ENSG00000212939 | 0.035961207 |
| AC073326.3 | ENSG00000228540 | 0.036298277 |
| RP11-126H7.4 | ENSG00000204049 | 0.036449014 |
| CTD-2619J13.13 | ENSG00000268307 | 0.037145687 |
| LINC01748 | ENSG00000226476 | 0.038383393 |
| RP11-532F6.3 | ENSG00000272463 | 0.042708274 |
| RP11-728G15.1 | ENSG00000256008 | 0.043149989 |
| LINC01060 | ENSG00000249378 | 0.045508319 |
| KCNQ1OT1 | ENSG00000269821 | 0.045529181 |
| LINC01996 | ENSG00000261863 | 0.046591159 |
| ELFN1-AS1 | ENSG00000236081 | 0.046625182 |
| HOTAIR | ENSG00000228630 | 0.047908786 |
| LINC00461 | ENSG00000245526 | 0.04796558 |
| CTD-2600O9.1 | ENSG00000187185 | 0.048650792 |
| LEF1-AS1 | ENSG00000232021 | 0.049375626 |
| FLJ16779 | ENSG00000275620 | 0.049920309 |
lncRNA, long non-coding RNA.
Figure 2.
Top 10 lncRNAs associated with overall survival derived from 1,180 significantly differentially expressed genes. Patients were divided into high and low expression groups according to the median value of all patients. The data of the top 10 of the 56 lncRNAs are presented. lncRNA, long non-coding RNA.
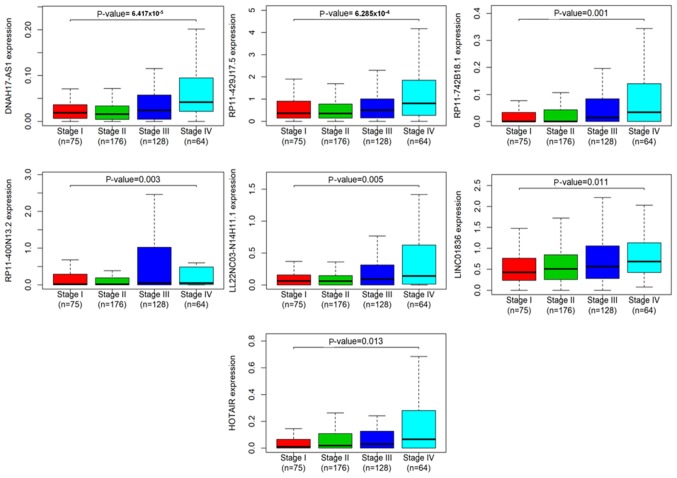
The association between clinical stages (UICC/AJCC 7th Edition) (21) and the 56 lncRNAs associated with OS was determined via a Kruskal-Wallis test. The results demonstrated that 7 lncRNAs were identified as key lncRNAs associated with the Tumor-Node-Metastasis (TNM) stages of colon cancer, including DNAH17-AS1, RP11-429J17.5, RP11-742B18.1, RP11-400N13.2, LL22NC03-N14H11.1, LINC01836 and HOTAIR (Table IV; Fig. 3). The detailed information of the patients at each TNM stage is presented in Table SI. Notably, these 7 lncRNAs were upregulated in colon cancer tissues compared with adjacent normal tissues, suggesting that they may serve a tumorigenic role in the initiation and progression of CRC.
Table IV.
lncRNAs significantly associated with tumor clinical stage.
| lncRNA | Ensembl_Gene_ID | P-value |
|---|---|---|
| FLJ16779 | ENSG00000275620 | 0.049920309 |
| DNAH17-AS1 | ENSG00000267432 | 6.42×10⁻⁵ |
| RP11-429J17.5 | ENSG00000254548 | 0.000628536 |
| RP11-742B18.1 | ENSG00000249001 | 0.00141941 |
| RP11-400N13.2 | ENSG00000228437 | 0.003179863 |
| LL22NC03-N14H11.1 | ENSG00000272872 | 0.005376623 |
| LINC01836 | ENSG00000267530 | 0.011461646 |
| HOTAIR | ENSG00000228630 | 0.013000989 |
lncRNA, long non-coding RNA.
Figure 3.
A total of 7 lncRNAsare significantly associated with the clinical stages of patients with colorectal cancer. The horizontal axis represents the clinical stage, whereas the vertical axis represents the expression levels of 7 lncRNAs that were significantly associated with the clinical stages of patients with colorectal cancer. lncRNA, long noncoding RNA.
Identification of independent prognostic lncRNAs in CRC
In order to detect potential independent prognostic lncRNAs in patients with CRC, univariate and multivariate Cox regression analyses of these 7 lncRNAs associated with TNM stage were performed. The association between the expression levels of lncRNAs and the OS of patients with colon cancer was explored using the R package ‘survival’; 2 lncRNAs, DNAH17-AS1 and RP11-400N13.2, were identified to be independent prognostic factors for OS in patients with CRC (P<0.05; Tables V and VI).
Table V.
Cox regression analyses of the association between DNAH17-AS1 and patient clinicopathological characteristics.
| Univariate | Multivariate | |||||||
|---|---|---|---|---|---|---|---|---|
| Characteristic | P-value | HR | HR (lower 0.95) | HR (upper 0.95) | P-value | HR | HR (lower 0.95) | HR (upper 0.95) |
| Age, years | 1.54×10⁻² | 1.024705 | 1.00467006 | 1.045139527 | 8.62×10⁻⁵ | 1.043293 | 1.021452741 | 1.065600322 |
| Sex | 8.11×10⁻¹ | 1.055993 | 0.675320904 | 1.651244946 | 5.15×10⁻¹ | 0.859753 | 0.545233986 | 1.355701712 |
| Stage | 4.32×10⁻¹⁰ | 2.260538 | 1.749817646 | 2.92032165 | 3.09×10⁻¹ | 1.481753 | 0.693752964 | 3.164805106 |
| T | 5.85×10⁻⁶ | 2.842169 | 1.809061684 | 4.465257511 | 4.32×10⁻² | 1.753715 | 1.017244601 | 3.023378521 |
| M | 6.75×10⁻¹⁰ | 4.348202 | 2.726493071 | 6.934496948 | 3.83×10⁻¹ | 1.584756 | 0.562533031 | 4.464537953 |
| N | 1.29×10⁻⁷ | 2.014039 | 1.553071957 | 2.611824311 | 2.84×10⁻¹ | 1.281519 | 0.813788046 | 2.01808327 |
| DNAH17-AS1 | 1.17×10⁻³ | 56.08087 | 4.924770723 | 638.6214937 | 1.61×10⁻² | 29.59342 | 1.872773849 | 467.6327355 |
HR, hazard ratio; HR (lower 0.95), hazard ratio (lower 95% CI); HR (upper 0.95), hazard ratio (upper 95%CI); T, tumor; N, node; M, metastasis.
Table VI.
Cox regression analyses of the association between RP11-400N13.2 and patient clinicopathological characteristics.
| Univariate | Multivariate | |||||||
|---|---|---|---|---|---|---|---|---|
| Characteristic | P-value | HR | HR (lower 0.95) | HR (upper 0.95) | P-value | HR | HR (lower 0.95) | HR (upper 0.95) |
| Age, years | 1.54×10⁻² | 1.024705 | 1.00467006 | 1.045139527 | 3.70×10⁻⁴ | 1.03741 | 1.016647195 | 1.058596272 |
| Sex | 8.11×10⁻¹ | 1.055993 | 0.675320904 | 1.651244946 | 7.37×10⁻¹ | 0.925432 | 0.588464244 | 1.455355124 |
| Stage | 4.32×10⁻¹⁰ | 2.260538 | 1.749817646 | 2.92032165 | 2.61×10⁻¹ | 1.54623 | 0.722569696 | 3.308782317 |
| T | 5.85×10⁻⁶ | 2.842169 | 1.809061684 | 4.465257511 | 3.02×10⁻² | 1.842378 | 1.059948791 | 3.202377507 |
| M | 6.75×10⁻¹⁰ | 4.348202 | 2.726493071 | 6.934496948 | 3.49×10⁻¹ | 1.628719 | 0.586703577 | 4.521408077 |
| N | 1.29×10⁻⁷ | 2.014039 | 1.553071957 | 2.611824311 | 4.82×10⁻¹ | 1.181526 | 0.741699234 | 1.882169148 |
| RP11-400N13.2 | 2.49×10⁻⁴ | 1.14629 | 1.065532018 | 1.233169628 | 6.46×10⁻³ | 1.117075 | 1.031523289 | 1.209722556 |
HR, hazard ratio; HR (lower 0.95), hazard ratio (lower 95% CI); HR (upper 0.95), hazard ratio (upper 95% CI); T, tumor stage; N, node stage; M, metastasis stage.
Analyses of PCGs co-expressed with lncRNAs DNAH17-AS1 and RP11-400N13.2
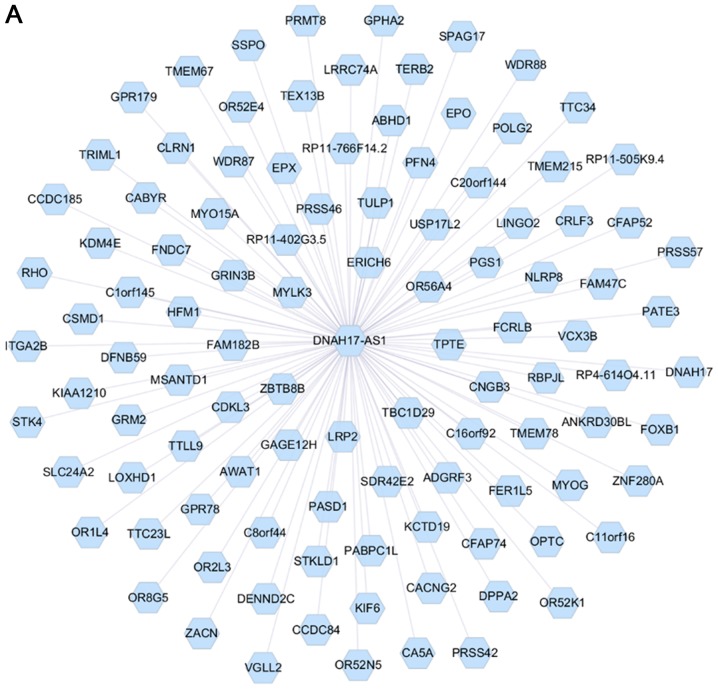
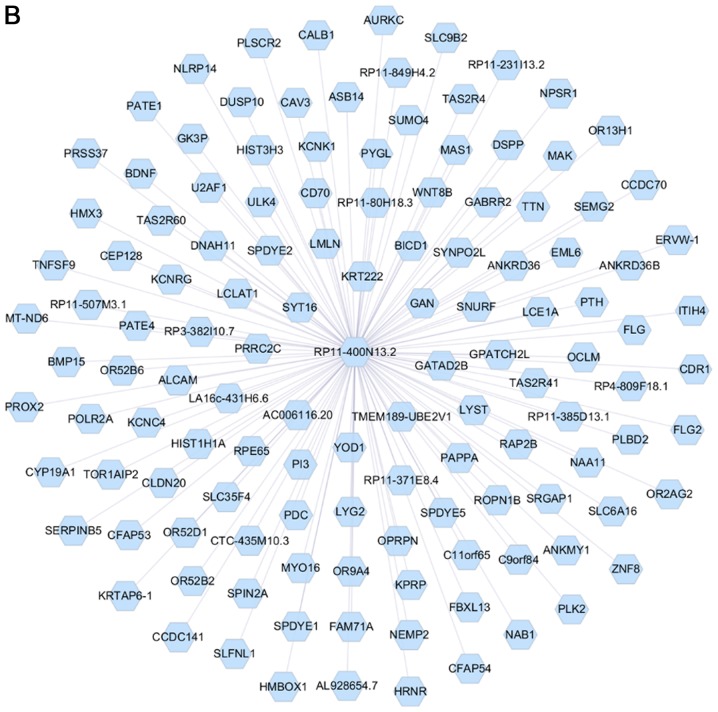
Analysis of the PCGs co-expressed with DNAH17-AS1 and RP11-400N13.2 was conducted using the cor.test function with thresholds of |r|>0.4 and P<0.001. The results revealed that 1,048 PCGs were co-expressed with DNAH17-AS1 (Fig. 4A). Due to a large number of PCGs in DNAH17-AS1, only the top 100 genes with a lower P-value were presented in Fig. 4A. A total of 126 PCGs co-expressed with RP11-400N13.2 (Fig. 4B). The top 10 significant PCGs that were identified to be co-expressed with the 2 lncRNAs are listed in Table VII.
Figure 4.
Interactions between two long non-coding RNAs and co-expressed PCGs. (A) DNAH17-AS1 was co-expressed with 1,048 PCGs. (B) RP11-400N13.2 was co-expressed with 126 PCGs. PCGs, protein-coding genes.
Table VII.
Co-expression analyses between DNAH17-AS1 and RP11-400N13.2 and the top 10 significant protein-coding genes.
| A, Genes co-expressed with DNAH17-AS1 | |||
|---|---|---|---|
| Co-expressed gene | Ensembl_Gene_ID | ra | P-value |
| DNAH17 | ENSG00000187775 | 0.656 | 2.73×10−65 |
| SSPO | ENSG00000197558 | 0.564 | 4.89×10−45 |
| TPTE | ENSG00000274391 | 0.505 | 4.31×10⁻³⁵ |
| DPPA2 | ENSG00000163530 | 0.473 | 1.96×10⁻³⁰ |
| GPR179 | ENSG00000277399 | 0.473 | 2.22×10⁻³⁰ |
| RP11-505K9.4 | ENSG00000260300 | 0.454 | 8.07×10⁻²⁸ |
| CFAP74 | ENSG00000142609 | 0.453 | 1.15×10⁻²⁷ |
| POLG2 | ENSG00000256525 | 0.451 | 1.99×10⁻²⁷ |
| KIF6 | ENSG00000164627 | 0.449 | 3.41×10⁻²⁷ |
| STKLD1 | ENSG00000198870 | 0.445 | 9.44×10⁻²⁷ |
| B, Genes co-expressed with RP11-400N13.2 | |||
| Co-expressed gene | Ensembl_Gene_ID | ra | P-value |
| RP11-371E8.4 | ENSG00000259066 | 0.439 | 5.20×10⁻²⁶ |
| RP11-507M3.1 | ENSG00000276087 | 0.438 | 8.64×10⁻²⁶ |
| HIST3H3 | ENSG00000168148 | 0.428 | 1.26×10⁻²⁴ |
| RP4-809F18.1 | ENSG00000255595 | 0.428 | 1.34×10⁻²⁴ |
| OPRPN | ENSG00000171199 | 0.426 | 2.51×10⁻²⁴ |
| RP11-385D13.1 | ENSG00000251537 | 0.423 | 4.79×10⁻²⁴ |
| OR52B2 | ENSG00000255307 | 0.422 | 5.87×10⁻²⁴ |
| OR52B6 | ENSG00000187747 | 0.422 | 7.24×10⁻²⁴ |
| OR2AG2 | ENSG00000188124 | 0.401 | 1.44×10⁻²¹ |
| BDNF | ENSG00000176697 | 0.397 | 3.93×10⁻²¹ |
Pearson's correlation coefficient.
GO and KEGG enrichment analyses of the PCGs co-expressed with DNAH17-AS1 and RP11-400N13.2
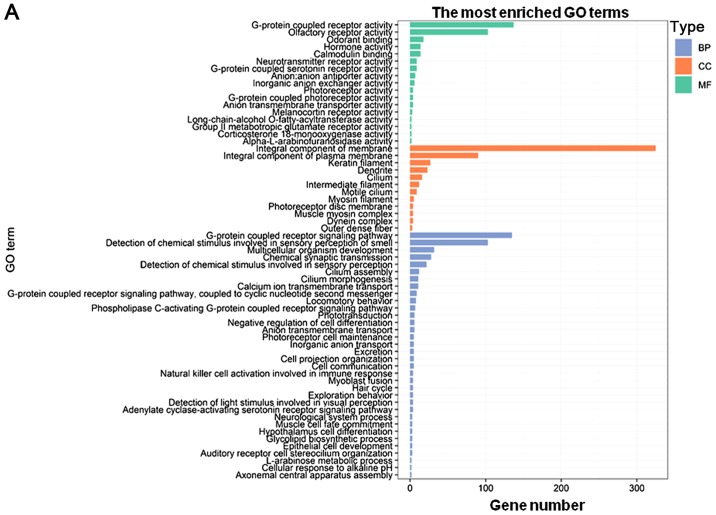
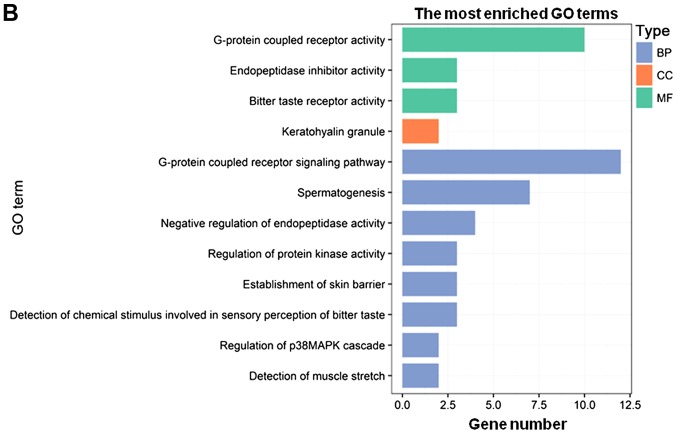
To further investigate the potential roles of the two independent prognostic lncRNAs identified in the present study, functional enrichment analyses for their co-expressed PCGs were performed using the clusterProfiler R package. The results indicated that the PCGs co-expressed with DNAH17-AS1 were mainly enriched in ‘G-protein coupled receptor signaling pathway’, ‘detection of chemical stimulus involved in sensory perception of smell’, ‘integral component of membrane’, ‘integral component of plasma membrane’, ‘G-protein coupled receptor activity’ and ‘olfactory receptor activity’. Collectively, these PCGs were associated with G-protein coupling and cell membrane function (Fig. 5A). Additionally, the PCGs co-expressed with RP11-400N13.2 were mainly enriched in ‘G-protein coupled receptor signaling pathway’, ‘G-protein coupled receptor activity’, ‘spermatogenesis’, ‘negative regulation of endopeptidase activity’ and ‘endopeptidase inhibitor activity’, which are involved in G-protein coupling and endopeptidase function (Fig. 5B). Functional enrichment analysis revealed a high level of involvement of the associated PCGs inG-protein coupling, which suggested a crucial biological function of DNAH17-AS1 and RP11-400N13.2. The detailed information of the genes with G-protein-associated functions co-expressed with DNAH17-AS1 and RP11-400N13.2 is presented in Table SII. A total of 3 of these genes, 5′-hydroxytryptamine receptor 6, melanocortin 5 receptor and prokineticin receptor 2, were significantly associated with OS (P<0.05; Fig. S1).
Figure 5.
GO enrichment analysis maps of co-expressed PCGs associated with certain long non-coding RNAs. (A) The most enriched GO terms of PCGs co-expressed with DNAH17-AS1. (B) The most enriched GO terms of PCGs co-expressed with RP11-400N13.2. The colors of the columns represent the different types of terms. GO, Gene Ontology; PCGs, protein-coding genes; BP, biological process; CC, cellular component; MF, molecular function.
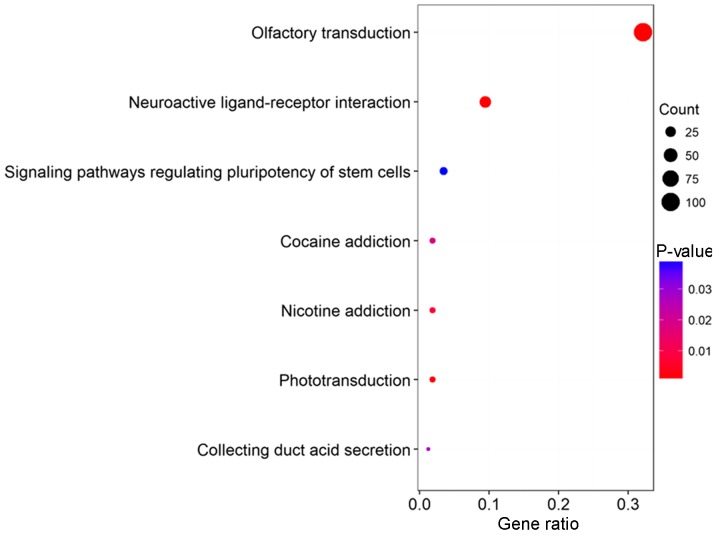
KEGG pathway enrichment analysis of the PCGs co-expressed with the two independent prognostic lncRNAs was performed using clusterProfiler package in R with a threshold of P<0.05. The results revealed that the PCGs co-expressed with DNAH17-AS1 were involved in seven pathways, including ‘olfactory transduction’, ‘neuroactive ligand-receptor interaction’, ‘phototransduction’, ‘nicotine addiction’, ‘cocaine addiction’, ‘collecting duct acid secretion’ and ‘signaling pathways regulating pluripotency of stem cells’ (Fig. 6). This result provided novel insights into the potential associations between these pathways and CRC, which warrant further investigation. Of note, P>0.05 was reported for the enriched pathways of the PCGs co-expressed with RP11-400N13.2.
Figure 6.
KEGG enrichment analysis of PCGs co-expressed with DNAH17-AS1. The size of the dots indicates the number of enriched PCGs; the color of the dots represents the degree of significance based on the P-value. KEGG, Kyoto Encyclopedia of Genes and Genomes; PCGs, protein-coding genes.
Discussion
In the present study, in silico analysis revealed 1,180 significantly differentially expressed lncRNAs that were associated with colorectal cancer, of which 56 and 7 genes were significantly associated with OS and TNM stage, respectively. Subsequent univariate and multivariate Cox regression analyses indicated that 2 of the 7 lncRNAs, DNAH17-AS1 and RP11-400N13.2, may be independent prognostic lncRNAs for the OS of patients with colorectal cancer.
To the best of our knowledge, lncRNAs DNAH17-AS1 and RP11-400N13.2 have not been previously associated with colon cancer; however, a missense variant p.R3953Y of DNAH17, the related protein of DNAH17-AS1, was reported in undifferentiated embryonal sarcoma of the liver in a child (24). Additionally, p.R3953 of DNAH17 exhibited a high level of conservation among a variety of species, suggesting that this allele may be an important locus associated with protein function (24). A recent study revealed the mutational profile and a distinct mutation signature of T:A>A:T transversion in early-stage hepatocellular carcinoma (HCC) with hepatitis B virus (HBV) infection; thus, as a key gene of the mutational profile, DNAH17 was proposed to serve an important role in the HBV-mediated transformation of liver cells (25). Additionally, the hypomethylation status of DNAH17 has been reported in HCC, which is associated with several clinical characteristics and may serve as a potential biomarker of tumor thrombosis in patients with HCC (26). In the present study, the lncRNA expression level of DNAH17-AS1 in CRC samples was analyzed and compared with that in normal samples; however, the expression level and the methylation status of DNAH17 were not analyzed. Although the expression level of DNAH17, as well as its methylation status in CRC samples, may be informative to determine the role of DNAH17 in CRC, this was beyond the scope of the present study. Therefore, relevant studies will be performed in the future.
A limited number of studies have investigated RP11-400N13.2; however, other RP11 family members have been frequently reported to be dysregulated in CRC. RP11-708H21.4, an RP11 family lncRNA located in the 17q21 gene desert region, was proposed to serve a suppressive role in the tumorigenesis of colorectal cancer and act as a novel powerful diagnostic biomarker, as well as a therapeutic target for the treatment of CRC (27). The expression levels of RP11-462C24.1, another member of the RP11 family, were determined to be significantly correlated with distant metastasis in patients with CRC, and may serve as a potential prognostic marker for such patients (28). Additionally, the dysregulation of RP11 family members has been reported to be involved in other types of cancer. For instance, a recent study revealed that overexpression of lncRNA RP11-190D6.2 inhibited the proliferation, migration and invasion of epithelial ovarian cancer (EOC) cells and may be considered a novel biomarker and therapeutic target for EOC (29). Furthermore, lncRNA RP11-436H11.5 was identified to function as a competing endogenous RNA to promote the proliferation and invasion of renal cell carcinoma (RCC) cells, which suggests that RP11-436H11.5 may be a potential therapeutic target to suppress RCC tumorigenesis (30). Collectively, the RP11 family of lncRNAs serve important roles in carcinogenesis and may be used as potential diagnostic and prognostic biomarkers for various types of cancer.
Following the identification of two independent prognostic lncRNAs in colorectal cancer, the co-expressed PCGs were analyzed, and stepwise GO and KEGG enrichment analyses were conducted to determine the potential biological functions of these lncRNAs associated with CRC and the signaling pathways involved. The results of the functional enrichment analysis of DNAH17-AS1 and RP11-400N13.2 differed; however, these lncRNAs were determined to possess similar G-protein coupling-associated functions. G-protein coupled receptors have been previously reported to be associated with CRC tumorigenesis (31–34). For example, the G-protein coupled receptor GPR55 may promote tumor progression by acting as an pro-oncogenic factor in CRC (31). In addition, GPR55 has been proposed to be involved in the migration of CRC cells and may serve as a potential target for the prevention of metastasis (32). On the contrary, orexin receptor type 1 and cholecystokinin A receptor, which belong to family A of the G-protein coupled receptors, serve opposing roles in the regulation of HT-29 CRC cell migration, but have also been reported to be involved in the pathogenesis of CRC metastasis (33). Furthermore, a recent study revealed that GPR109A, a G-protein coupled receptor for short-chain fatty acids, was silenced in CRC cells (34). In addition, the host immune system may employ interferon γ to counteract methylation-mediated silencing of GPR109A as a mechanism to suppress tumor development (34). Therefore, G-protein coupled receptors maybe associated with the carcinogenesis and metastasis of CRC; the roles of DNAH17-AS1 and RP11-400N13.2 in CRC, which may be mediated by these receptors, require further investigation.
In the present study, DNAH17-AS1 and RP11-400N13.2 were identified as potential independent prognostic lncRNAs for OS in patients with CRC. Further bioinformatics analyses revealed that these 2 lncRNAs may serve a pro-oncogenic role in CRC via G-protein coupling-related functions. Therefore, DNAH17-AS1 and RP11-400N13.2 may serve as prognostic biomarkers for CRC in the future. The detailed methodology of the present study is presented in Fig. S2.
Supplementary Material
Acknowledgements
Not applicable.
Glossary
Abbreviations
- lncRNAs
long non-coding RNAs
- CRC
colorectal cancer
- OS
overall survival
- PCGs
protein-coding genes
- GO
Gene Ontology
- KEGG
Kyoto Encyclopedia of Genes and Genomes
Funding
This study was funded by the National Natural Science Foundation of China (grant no. 81572416), the National Key Technologies R&D Program of China (grant no. 2016YFC1303200), and the Tianjin Medical University Cancer Institute and Hospital Cancer Translational Medicine Seed Funds (grant no. 1701-1).
Availability of data and materials
The datasets used and/or analyzed during the current study are available from the corresponding author on reasonable request.
Authors' contributions
LL designed and supervised the study and finalized the manuscript. WZ and BP made substantial contributions to the study design, performed the bioinformatics analysis and drafted the manuscript. All authors read and approved the final manuscript.
Ethics approval and consent to participate
Not applicable.
Patient consent for publication
Not applicable.
Competing interests
The authors declare that they have no competing interests.
References
- 1.Siegel RL, Miller KD, Jemal A. Cancer statistics, 2016. CA Cancer J Clin. 2016;66:7–30. doi: 10.3322/caac.21332. [DOI] [PubMed] [Google Scholar]
- 2.Ghareeb AE, Moawed FSM, Ghareeb DA, Kandil EI. Potential prophylactic effect of berberine against rat colon carcinoma induce by 1,2-dimethyl hydrazine. Asian Pac J Cancer Prev. 2018;19:1685–1690. doi: 10.22034/APJCP.2018.19.6.1685. [DOI] [PMC free article] [PubMed] [Google Scholar]
- 3.Sanoff HK, Sargent DJ, Campbell ME, Morton RF, Fuchs CS, Ramanathan RK, Williamson SK, Findlay BP, Pitot HC, Goldberg RM. Five-year data and prognostic factor analysis of oxaliplatin and irinotecan combinations for advanced colorectal cancer: N9741. J Clin Oncol. 2008;26:5721–5727. doi: 10.1200/JCO.2008.17.7147. [DOI] [PMC free article] [PubMed] [Google Scholar]
- 4.Dong Z, Zheng L, Liu W, Wang C. Association of mRNA expression of TP53 and the TP53 codon 72 Arg/Pro gene polymorphism with colorectal cancer risk in Asian population: A bioinformatics analysis and meta-analysis. Cancer Manag Res. 2018;10:1341–1349. doi: 10.2147/CMAR.S164892. [DOI] [PMC free article] [PubMed] [Google Scholar]
- 5.Xue W, Li J, Wang F, Han P, Liu Y, Cui B. A long non-coding RNA expression signature to predict survival of patients with colon adenocarcinoma. Oncotarget. 2017;8:101298–101308. doi: 10.18632/oncotarget.21064. [DOI] [PMC free article] [PubMed] [Google Scholar]
- 6.Dykes IM, Emanueli C. Transcriptional and posttranscriptional gene regulation by long non-coding RNA. Genomics Proteomics Bioinformatics. 2017;15:177–186. doi: 10.1016/j.gpb.2016.12.005. [DOI] [PMC free article] [PubMed] [Google Scholar]
- 7.Iyer MK, Niknafs YS, Malik R, Singhal U, Sahu A, Hosono Y, Barrette TR, Prensner JR, Evans JR, Zhao S, et al. The landscape of long non-coding RNAs in the human transcriptome. Nat Genet. 2015;47:199–208. doi: 10.1038/ng.3192. [DOI] [PMC free article] [PubMed] [Google Scholar]
- 8.Prensner JR, Chinnaiyan AM. The emergence of lncRNAs in cancer biology. Cancer Discov. 2011;1:391–407. doi: 10.1158/2159-8290.CD-11-0209. [DOI] [PMC free article] [PubMed] [Google Scholar]
- 9.Zhou M, Wang X, Li J, Hao D, Wang Z, Shi H, Han L, Zhou H, Sun J. Prioritizing candidate disease-related long non-coding RNAs by walking on the heterogeneous lncRNA and disease network. Mol Biosyst. 2015;11:760–769. doi: 10.1039/C4MB00511B. [DOI] [PubMed] [Google Scholar]
- 10.Lou Y, Jiang H, Cui Z, Wang X, Wang L, Han Y. Gene microarray analysis of lncRNA and mRNA expression profiles in patients with high-grade ovarian serous cancer. Int J Mol Med. 2018;42:91–104. doi: 10.3892/ijmm.2018.3588. [DOI] [PMC free article] [PubMed] [Google Scholar]
- 11.Jin B, Jin H, Wu HB, Xu JJ, Li B. Long non-coding RNA SNHG15 promotes CDK14 expression via miR-486 to accelerate non-small cell lung cancer cells progression and metastasis. J Cell Physiol. 2018;233:7164–7172. doi: 10.1002/jcp.26543. [DOI] [PMC free article] [PubMed] [Google Scholar]
- 12.Li S, Zhou J, Wang Z, Wang P, Gao X, Wang Y. Long noncoding RNA GAS5 suppresses triple negative breast cancer progression through inhibition of proliferation and invasion by competitively binding miR-196a-5p. Biomed Pharmacother. 2018;104:451–457. doi: 10.1016/j.biopha.2018.05.056. [DOI] [PubMed] [Google Scholar]
- 13.Liu Z, Yan Y, Cao S, Chen Y. Long non-coding RNA SNHG14 contributes to gastric cancer development through targeting miR-145/SOX9 axis. J Cell Biochem. 2018;119:6905–6913. doi: 10.1002/jcb.26889. [DOI] [PubMed] [Google Scholar]
- 14.Fan H, Lv P, Mu T, Zhao X, Liu Y, Feng Y, Lv J, Liu M, Tang H. lncRNA n335586/miR-924/CKMT1A axis contributes to cell migration and invasion in hepatocellular carcinoma cells. Cancer Lett. 2018;429:89–99. doi: 10.1016/j.canlet.2018.05.010. [DOI] [PubMed] [Google Scholar]
- 15.Ye XT, Huang H, Huang WP, Hu WL. lncRNA THOR promotes human renal cell carcinoma cell growth. Biochem Biophys Res Commun. 2018;501:661–667. doi: 10.1016/j.bbrc.2018.05.040. [DOI] [PubMed] [Google Scholar]
- 16.Tsai KW, Lo YH, Liu H, Yeh CY, Chen YZ, Hsu CW, Chen WS, Wang JH. Linc00659, a long noncoding RNA, acts as novel oncogene in regulating cancer cell growth in colorectal cancer. Mol Cancer. 2018;17:72. doi: 10.1186/s12943-018-0821-1. [DOI] [PMC free article] [PubMed] [Google Scholar]
- 17.Wu Q, Meng WY, Jie Y, Zhao H. lncRNA MALAT1 induces colon cancer development by regulating miR-129-5p/HMGB1 axis. J Cell Physiol. 2018;233:6750–6757. doi: 10.1002/jcp.26383. [DOI] [PubMed] [Google Scholar]
- 18.Yang H, Wang S, Kang YJ, Wang C, Xu Y, Zhang Y, Jiang Z. Long non-coding RNA SNHG1 predicts a poor prognosis and promotes colon cancer tumorigenesis. Oncol Rep. 2018;40:261–271. doi: 10.3892/or.2018.6412. [DOI] [PMC free article] [PubMed] [Google Scholar]
- 19.Xu Y, Zhang X, Hu X, Zhou W, Zhang P, Zhang J, Yang S, Liu Y. The effects of lncRNA MALAT1 on proliferation, invasion and migration in colorectal cancer through regulating SOX9. Mol Med. 2018;24:52. doi: 10.1186/s10020-018-0050-5. [DOI] [PMC free article] [PubMed] [Google Scholar]
- 20.Xu M, Chen X, Lin K, Zeng K, Liu X, Pan B, Xu X, Xu T, Hu X, Sun L, et al. The long noncoding RNA SNHG1 regulates colorectal cancer cell growth through interactions with EZH2 and miR-154-5p. Mol Cancer. 2018;17:141. doi: 10.1186/s12943-018-0894-x. [DOI] [PMC free article] [PubMed] [Google Scholar]
- 21.Edge SB, Byrd DR, Compton CC, Fritz AG Greene, F, Trotti A, editors. 7th. Springer-Verlag; New York, NY: 2010. AJCC Cancer Staging Manual. [Google Scholar]
- 22.Gene Ontology Consortium. The gene ontology (GO) project in 2006. Nucleic Acids Res. 2006;34:D322–D326. doi: 10.1093/nar/gkj021. [DOI] [PMC free article] [PubMed] [Google Scholar]
- 23.Altermann E, Klaenhammer TR. Pathwayvoyager: Pathway mapping using the Kyoto encyclopedia of genes and genomes (KEGG) database. BMC Genomics. 2005;6:60. doi: 10.1186/1471-2164-6-60. [DOI] [PMC free article] [PubMed] [Google Scholar]
- 24.Kim JH, Sio CA, Park H, Kim H, Shin HD, Jung K. Undifferentiated embryonal sarcoma of the liver in a child: A whole exome sequencing analysis. Dig Liver Dis. 2017;49:944–946. doi: 10.1016/j.dld.2017.04.020. [DOI] [PubMed] [Google Scholar]
- 25.Zhan H, Jiang J, Sun Q, Ke A, Hu J, Hu Z, Zhu K, Luo C, Ren N, Fan J, et al. Whole-exome sequencing-based mutational profiling of hepatitis B virus-related early-stage hepatocellular carcinoma. Gastroenterol Res Pract 2017. 2017:2029315. doi: 10.1155/2017/2029315. [DOI] [PMC free article] [PubMed] [Google Scholar]
- 26.Fan X, Guo H, Dai B, He L, Zhou D, Lin H. The association between methylation patterns of DNAH17 and clinicopathological factors in hepatocellular carcinoma. Cancer Med. 2019;8:337–350. doi: 10.1002/cam4.1930. [DOI] [PMC free article] [PubMed] [Google Scholar]
- 27.Sun L, Jiang C, Xu C, Xue H, Zhou H, Gu L, Liu Y, Xu Q. Down-regulation of long non-coding RNA RP11-708H21.4 is associated with poor prognosis of colorectal cancer and promotes tumorigenesis through regulating AKT/mTOR pathway. Oncotarget. 2017;8:27929–27942. doi: 10.18632/oncotarget.15846. [DOI] [PMC free article] [PubMed] [Google Scholar]
- 28.Shi D, Zheng H, Zhuo C, Peng J, Li D, Xu Y, Li X, Cai G, Cai S. Low expression of novel lncRNA RP11-462C24.1 suggests a biomarker of poor prognosis in colorectal cancer. Med Oncol. 2014;31:31. doi: 10.1007/s12032-014-0031-7. [DOI] [PMC free article] [PubMed] [Google Scholar]
- 29.Tong W, Yang L, Yu Q, Yao J, He A. A new tumor suppressor lncRNA RP11-190D6.2 inhibits the proliferation, migration and invasion of epithelial ovarian cancer cells. Onco Targets Ther. 2017;10:1227–1235. doi: 10.2147/OTT.S125185. [DOI] [PMC free article] [PubMed] [Google Scholar]
- 30.Wang KF, Jin W, Song Y, Fei X. lncRNA RP11-436H11.5, functioning as a competitive endogenous RNA, upregulates BCL-W expression by sponging miR-335-5p and promotes proliferation and invasion in renal cell carcinoma. Mol Cancer. 2017;16:166. doi: 10.1186/s12943-017-0735-3. [DOI] [PMC free article] [PubMed] [Google Scholar]
- 31.Hasenoehrl C, Feuersinger D, Sturm EM, Bärnthaler T, Heitzer E, Graf R, Grill M, Pichler M, Beck S, Butcher L, et al. G protein-coupled receptor GPR55 promotes colorectal cancer and has opposing effects to cannabinoid receptor 1. Int J Cancer. 2018;142:121–132. doi: 10.1002/ijc.31030. [DOI] [PMC free article] [PubMed] [Google Scholar]
- 32.Kargl J, Andersen L, Hasenöhrl C, Feuersinger D, Stančić A, Fauland A, Magnes C, El-Heliebi A, Lax S, Uranitsch S, et al. GPR55 promotes migration and adhesion of colon cancer cells indicating a role in metastasis. Br J Pharmacol. 2016;173:142–154. doi: 10.1111/bph.13345. [DOI] [PMC free article] [PubMed] [Google Scholar]
- 33.Bai B, Chen X, Zhang R, Wang X, Jiang Y, Li D, Wang Z, Chen J. Dual-agonist occupancy of orexin receptor 1 and cholecystokinin A receptor heterodimers decreases G-protein-dependent signaling and migration in the human colon cancer cell line HT-29. Biochim Biophys Acta Mol Cell Res 1864. 2017:1153–1164. doi: 10.1016/j.bbamcr.2017.03.003. [DOI] [PubMed] [Google Scholar]
- 34.Bardhan K, Paschall AV, Yang D, Chen MR, Simon PS, Bhutia YD, Martin PM, Thangaraju M, Browning DD, Ganapathy V, et al. IFNγ Induces DNA methylation-silenced GPR109A expression via pSTAT1/p300 and H3K18 acetylation in colon cancer. Cancer Immunol Res. 2015;3:795–805. doi: 10.1158/2326-6066.CIR-14-0164. [DOI] [PMC free article] [PubMed] [Google Scholar]
Associated Data
This section collects any data citations, data availability statements, or supplementary materials included in this article.
Supplementary Materials
Data Availability Statement
The datasets used and/or analyzed during the current study are available from the corresponding author on reasonable request.


