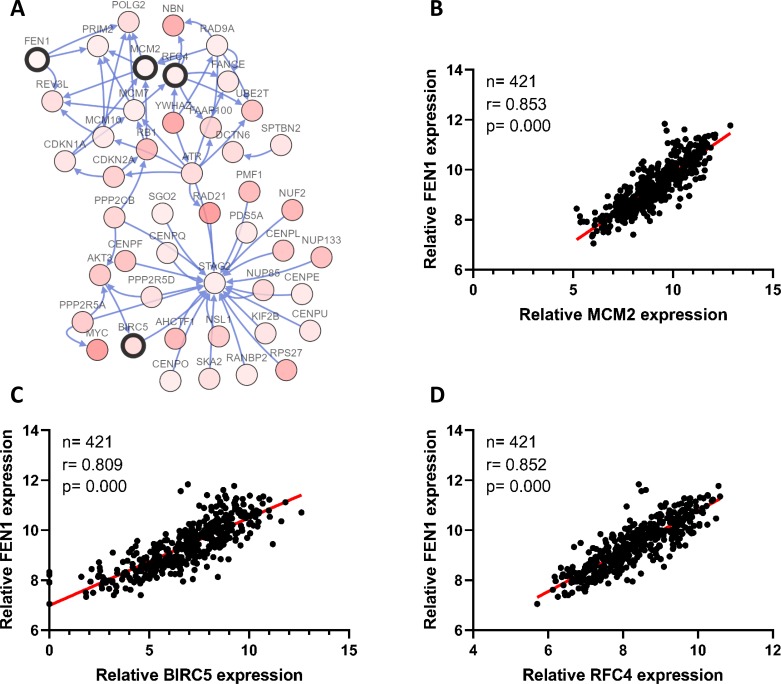
Figure 6. Correlations between the expression of FEN1 and MCM2, BIRC5, and RFC4.
(A) A PPI network for the nine core genes generated with the Cbioportal database. (B) The correlation between FEN1 and MCM2 in 421 TCGA liver cancer tissues including 50 solid normal tissues and 371 primary tumors. (C) The correlation between FEN1 and BIRC5 in 421 TCGA liver cancer tissues including 50 solid normal tissues and 371 primary tumors. (D) The correlation between FEN1 and RFC4 in 421 TCGA liver cancer tissues including 50 solid normal tissues and 371 primary tumors. P < 0.05 was the significance threshold.

