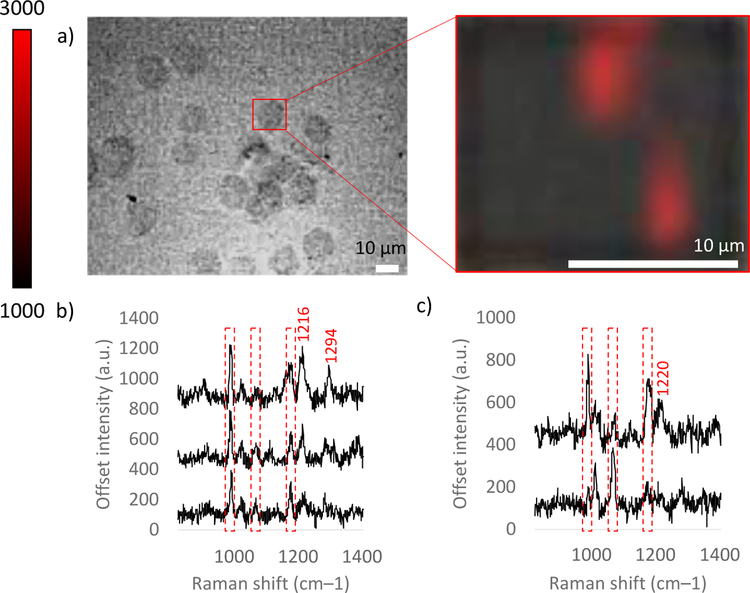
Figure 5.
a) White light and zoomed in SERS false color images of live cell incubated with SERS tags in the FCS3 system. Red pixels indicate SERS detection of MBN on the cell surface. b) Representative SERS spectra from the upper middle and c) the bottom right cluster of red pixels. Repeat live cell experiments are shown in Figures S12.

