Abstract
Background
Hyperoside (Hy) is a plant-derived quercetin 3-d-galactoside that exhibits inhibitory activities on various tumor types. The objective of the current study was to explore Hy effects on cervical cancer cell proliferation, and to perform a transcriptome analysis of differentially expressed genes.
Methods
Cervical cancer HeLa and C-33A cells were cultured and the effect of Hy treatment was determined using the Cell Counting Kit-8 (CCK-8) assay. After calculating the IC50 of Hy in HeLa and C-33A cells, the more sensitive to Hy treatment cell type was selected for RNA-Seq. Differentially expressed genes (DEGs) were identified by comparing gene expression between the Hy and control groups. Candidate genes were determined through DEG analysis, protein interaction network (PPI) construction, PPI module analysis, transcription factor (TF) prediction, TF-target network construction, and survival analysis. Finally, the key candidate genes were verified by RT-qPCR and western blot.
Results
Hy inhibited HeLa and C33A cell proliferation in a dose- and time-dependent manner, as determined by the CCK-8 assay. Treatment of C-33A cells with 2 mM Hy was selected for the subsequent experiments. Compared with the control group, 754 upregulated and 509 downregulated genes were identified after RNA-Seq. After functional enrichment, 74 gene ontology biological processes and 43 Kyoto Encyclopedia of Genes and Genomes pathways were obtained. According to the protein interaction network (PPI), PPI module analysis, TF-target network construction, and survival analysis, the key genes MYC, CNKN1A, PAX2, TFRC, ACOX2, UNC5B, APBA1, PRKACA, PEAR1, COL12A1, CACNA1G, PEAR1, and CCNA2 were detected. RT-qPCR was performed on the key genes, and Western blot was used to verify C-MYC and TFRC. C-MYC and TFRC expressions were lower and higher than the corresponding values in the control group, respectively, in accordance with the results from the RNA-Seq analysis.
Conclusion
Hy inhibited HeLa and C-33A cell proliferation through C-MYC gene expression reduction in C-33A cells and TFRC regulation. The results of the current study provide a theoretical basis for Hy treatment of cervical cancer.
Keywords: Hyperoside, Cervical cancer, RNA-Seq, Differentially expressed genes, Gene ontology, Kyoto Encyclopedia of Genes and Genomes, Protein–protein interactions network, Survival analysis
Background
Cervical cancer is a malignant epithelial tumor that occurs in the cervix. Most cervical cancers can be screened early by cervical cytology and virology. Moreover, human papillomavirus (Hpv) vaccination has emerged as an effective method for cervical cancer prevention [1]. However, due to inadequate screening programs in many parts of the world, cervical cancer remains one of the most common cancer types in females [2, 3]. Surgery is the main method for early treatment. Radiotherapy and chemotherapy are further therapy options. Women with cervical, especially advanced or recurrent, cancer are commonly treated using chemotherapy [4]. Recently, several reports have implicated traditional Chinese medicines in the treatment of cervical cancer. For example, ferulic acid inhibits the proliferation, invasion, and autophagy of cervical cancer cells, and induces cell cycle arrest [5]. Moreover, casticin induces G0/G1 cell cycle arrest and apoptosis in gallbladder cancer [6]. Hyperoside (Hy) is a flavonoid found mainly in Chinese herbal medicines. It exhibits anti-inflammatory, anti-oxidative, and vascular protective effects. Several recent studies demonstrated an anticancer effect of Hy in a variety of tumor types. Thus, Hy increased apoptosis and autophagy in pancreatic cancer cells [7]. Another study described Hy-mediated inhibition of human osteosarcoma cell proliferation and promotion of osteogenic differentiation [8]. Yet another study implicated Hy in the caspase-3, p53, and nuclear factor-kappa B (NF-κB) signaling pathways, which induce apoptosis and inhibit lung cancer cell proliferation [9, 10]. In gynecological oncology, Hy induces endometrial cancer cell apoptosis through the mitochondrial pathway [11]. However, Hy effect on cervical cancer development and the molecular mechanism implicated are unclear.
In the current study, the effect of Hy on two cervical cancer cell lines was determined using cytological methods, to detect changes in the cell proliferation index. Differentially expressed genes (DEGs) were identified by RNA sequencing (RNA-seq), comparing untreated and Hy-treated cells. Further analyses of the DEGs were conducted to explore the specific mechanism of Hy action on cervical cancer cells.
Methods
Cell culture
HeLa and C-33A cells (both acquired from the Chinese Academy of Sciences Shanghai Cell Bank) were cultured in Dulbecco’s modified Eagle’s medium (Gibco,Waltham, MA, USA) supplemented with 10% fetal bovine serum. They were inoculated in 96-well plates, cultured at 37 °C for 24 h, and then divided into seven groups. One group was untreated, whereas the remaining groups were treated with 0.25, 0.5, 1, 2, 4, or 8 mM Hy (Solarbio, Beijing, China) for 24, 48, or 72 h.
Cell viability and IC50 determination
Cell viability was determined using the Cell Counting Kit-8 (CCK-8) assay at 24, 48, and 72 h. At each time point, 100 µL CCK-8 (Beyotime Bio, Shanghai, China) was added to each well of a 96-well plate, which was then placed in a 37 °C, 5% CO2 incubator. HeLa and C-33A cells were incubated for 0.5 and 2 h, respectively, in the dark. The absorbance of each well was measured at 450 nm using an EPOCH microplate reader (Gene Company Limited). The half-inhibitory concentration (IC50) was calculated with GraphPad (version 5.0), and the cell line exhibiting higher sensitivity to Hy treatment was selected for follow-up experiments.
RNA-Seq and data preprocessing
Cells were divided into two groups for this experiment: a Hy-treated and a blank control group; the experiment was repeated three times with independent biological samples. Total RNA was extracted using TRIzol (TaKaRa Bio, Dalian, China), and the extracted RNA was sent to Shanghai New Bioinformatics Co., Ltd. to construct a cDNA library using an Illumina HiSeqTM 2000 platform for double-end PE150 sequencing with 6G data per sample. Unreliable bases and reads were filtered out to obtain clean data for the six samples. The TopHat software (version 2.1.0) was used to locate clean reads on the human reference genome (GENCODE download, GRCh38) [12]. The read count information on each gene alignment was obtained using the htseq-count tool (version 0.9.1) based on the human gene annotation information provided by GENCODE (Release 25).
Inter-sample expression level and principal component analysis
The cor function of the R software (version: 3.4.1) was used to calculate the similarity between the two samples in each experiment. The prcomp function of the R software was utilized to reduce the dimensionality of the data. The ggfortify package (version: 0.4.6) created PCA plots for principal component analysis.
DEG screening
First, the raw count was normalized using the TMM algorithm in the edgeR package [13, 14] (version: 3.4). Second, the mean–variance relationship was modeled with the exact weighting method (voom) provided by the limma package [15] (version: 3.36.2). Then, using linear regression and empirical Bayesian methods provided by the limma package, differential expression analysis was performed on the Hy and control groups. The differential expression threshold for DEGs was set to P < 0.05, |logFC| > 0.585.
Kyoto Encyclopedia of Genes and Genomes (KEGG) and Gene Ontology (GO)
GO [16] functional annotation and KEGG [17] enrichment analysis of the DEGs were performed using the DAVID (version 6.8, https://david-d.ncifcrf.gov/) [18]. P < 0.05 and enrichment count of at least 3 were considered thresholds for significant enrichment results.
Protein–protein interaction network (PPI) and PPI module analysis
The STRING (version 10.0, http://www.string-db.org/) database [19] was used to predict whether gene-encoded proteins interact with each other. A PPI network was constructed for the DEGs with the STRING database (parameter setting: species = homo; PPI score = 0.9). After obtaining the PPI relationship, a network diagram was constructed with Cytoscape (version 3.4.0, http://chianti.ucsd.edu/cytoscape-3.4.0/) [20]. CytoNCA plugin [21] (version 2.1.6, parameter setting: default) for Cytoscape was used to analyze the topological properties of the node network. The hub protein in the PPI network was obtained by ranking the network topology properties for each node.
The MCODE plugin [22] (version 1.5.1, parameter setting: default) for Cytoscape was used to screen protein complexes or functional modules. The modules with a score > 5 in the screening result were analyzed for KEGG path enrichment using the R package clusterProfiler [23] (version: 3.8.1).
Transcription factor prediction
The genes corresponding to the proteins identified in the PPI network were used as candidate genes, and transcription factors (TFs) were predicted with the TRRUST (version 2, http://www.grnpedia.org/trrust/, threshold setting: q-value < 0.05, number of target genes ≥ 2) [24]. The predicted TFs were compared with the DEGs to obtain differential TFs, and the transcription regulatory network (TF-target network) was constructed utilizing the Cytoscape software.
Survival analysis of key genes
The dataset for survival analysis was obtained from the UCSC database (http://xena.ucsc.edu/) [25], which contains TCGA-related data. Cancer samples with available patient survival information (n = 291) were selected, and the TCGA cervical cancer clinical data were used to extract the clinical information related to prognosis. The genes corresponding to the hub proteins obtained from the PPI network and the TFs in the TF-target regulatory network were utilized as candidate genes, and candidate gene expression values were screened from the TCGA. The median values were divided into two groups (high expression and low expression). A log-rank statistical test was performed, and the threshold P value was set to < 0.05. The relationship between candidate genes and patient prognosis was analyzed, and a Kaplan–Meier survival curve was plotted.
RT-qPCR analysis
Key genes for RT-qPCR verification were selected based on the PPI networks, topological properties, TF analyses, logFC, and degree ranking data. RNA extraction was performed using Trizol (TaKaRa Bio, Dalian, China), and cDNA was synthesized with PrimeScript RT Master Mix (TaKaRa Bio, Tokyo, Japan). Subsequently, amplification was carried out based on the Power SYBR Green PCR Master Mix (Thermo Fisher Scientific, Waltham, MA, USA). After an initial denaturation step of 10 min at 95 °C, the product was routinely examined using a dissociation curve, and the amount of transcript was compared with the relative Ct method with glyceraldehyde 3-phosphate dehydrogenase (GAPDH) as an internal reference control. The 2−ΔΔ Cq method was utilized for analysis of the experimental data. Primers and primer sequences for each gene are provided in Table 1.
Table 1.
Primers and primer sequences for each gene analyzed with RT-qPCR
| Genes | Primer sequences (5′-3′) |
|---|---|
| APBA1-hF | TTATTCCCAGGCTTGGCACC |
| APBA1-hR | TCGGAACGGCTAGGAGAGAA |
| CCNA2-hF | CGCTGGCGGTACTGAAGTC |
| CCNA2-hR | GAGGAACGGTGACATGCTCAT |
| CDKN1A-hF | CGATGGAACTTCGACTTTGTCA |
| CDKN1A-hR | GCACAAGGGTACAAGACAGTG |
| COL12A1-hF | CAAAGGAGGCAATACTCTCACAG |
| COL12A1-hR | GAAGGTG`CTTCAACATCGTCT |
| MYC-h F | CCTGGTGCTCCATGAGGAGAC |
| MYC-h R | CAGACTCTGACCTTTTGCCAGG |
| PAX2-hF | TCAAGTCGAGTCTATCTGCATCC |
| PAX2-hR | CATGTCACGACCAGTCACAAC |
| PEAR1-hF | TACCGGACCGTGTACCGTC |
| PEAR1-hR | CACACTCACTGGAACAGTCGT |
| RB1-hF | CTCTCGTCAGGCTTGAGTTTG |
| RB1-hR | GACATCTCATCTAGGTCAACTGC |
| TFRC-hF | ACCATTGTCATATACCCGGTTCA |
| TFRC-hR | CAATAGCCCAAGTAGCCAATCAT |
| PRKACA-hF | ACCCTGAATGAAAAGCGCATC |
| PRKACA-hR | CGTAGGTGTGAGAACATCTCCC |
| ACOX2-hF | CGCCTGGGTTGGTTAGAAGAT |
| ACOX2-hR | CTGAGGGCTCTCACGAAGAC |
| CACNA1G-hF | ACACTTGGAACCGGCTTGAC |
| CACNA1G-hR | AGCACACGGACTGTCCTGA |
| UNC5B-hF | GTCGGACACTGCCAACTATAC |
| UNC5B-hR | CCGCCATTCACGTAGACGAT |
| GAPDH-hF | TGACAACTTTGGTATCGTGGAAGG |
| GAPDH-hR | AGGCAGGGATGATGTTCTGGAGAG |
Western blot analysis4
The MYC and TFRC genes, which were identified by RT-qPCR, were selected for western blot analysis. Hy-treated cells were lysed with RIPA9 (Beyotime Bio, Shanghai, China), and the bicinchoninic acid (BCA; Thermo Fisher Scientific) reaction was performed to quantify protein concentrations. Equal protein amounts were resolved using 10% SDS-PAGE and transferred to polyvinylidene fluoride membranes (Millipore, Billerica, MA, USA). The membranes were blocked with 5% skim milk for 1 h, and then one of the following primary antibodies was added: anti-c-Myc rabbit monoclonal antibody (mAb; 57 kDa, 1:1000 dilution, Abcam, Cambridge, MA, USA,), anti-transferrin receptor (TFRC) rabbit monoclonal antibody (45 kDa, 1:5000 dilution, Abcam, Cambridge, MA, USA), or anti-GAPDH murine monoclonal antibody (36 kDa, 1:1000 dilution, Santa Cruz Biotechnology, CA, USA). After an overnight incubation at 4 °C, a secondary antibody (rabbit mAb, 1:10,000 or murine mAb, 1:5000) was added and incubated for 2 h at 37 °C. After development with the Millipore ECL system, the optical density of the target strips was analyzed using a chemiluminescent system (Tanon, Shanghai, China).
Statistical analysis
All experiments were replicated at least 3 times, and the data are presented as mean ± standard deviation. The results from CCK-8, IC50 values, qPCR, and western blot were analyzed using GraphPad Prism 5.0 software (GraphPad Prism, San Diego, CA). Student’s t-test was utilized to compare differences between two groups. One-way ANOVA was applied for comparisons among three or more groups. Statistical signifcance was accepted for p < 0.05.
Results
Hy effect on HeLa and C-33A cell proliferation
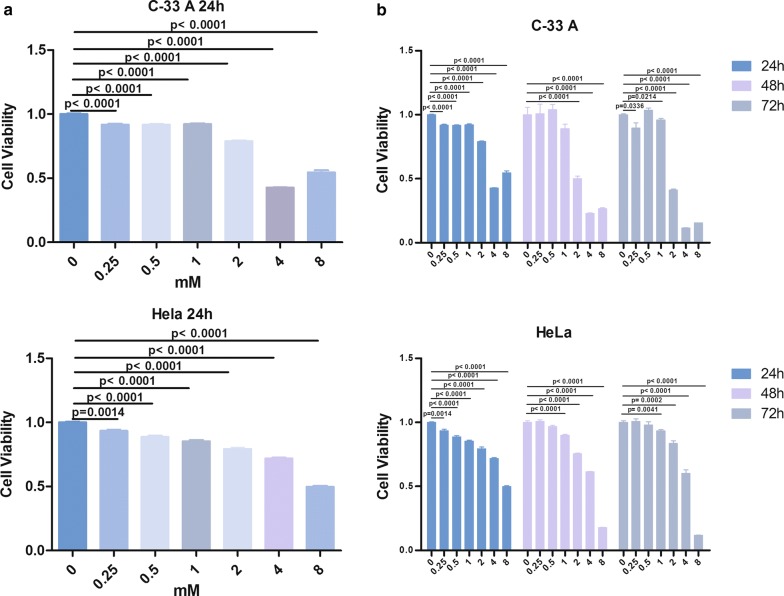
After 24 h in culture, the proliferation rate of HeLa cells decreased by 6.60%, 11.37%, 14.68%, 20.65%, 28.24%, and 50.16% (P < 0.01) in the presence of 0.25, 0.5, 1, 2, 4, and 8 mM Hy, respectively, compared to that of the control group (Fig. 1a). The respective rates for C-33A cells were 8.19%, 8.33%, 7.87%, 21.09%, 57.26%, and 45.4% (P < 0.01). Furthermore, HeLa and C-33A cell viability decreased significantly with time (24, 48, and 72 h; Fig. 1b). Thus, Hy inhibited the proliferation of HeLa and C-33A cells in a dose- and time-dependent manner in vitro. The IC50 of Hy was 2 mM for C-33A cells and 4 mM for HeLa cells (Fig. 1b). Subsequent experiments included C-33A cells and 2 mM Hy.
Fig. 1.
a Proliferation of HeLa and C-33A cells treated with a range of Hy concentrations or untreated controls at 24 h. b Proliferation of HeLa and C-33A cells at different time points and concentrations
Sequencing data analyses
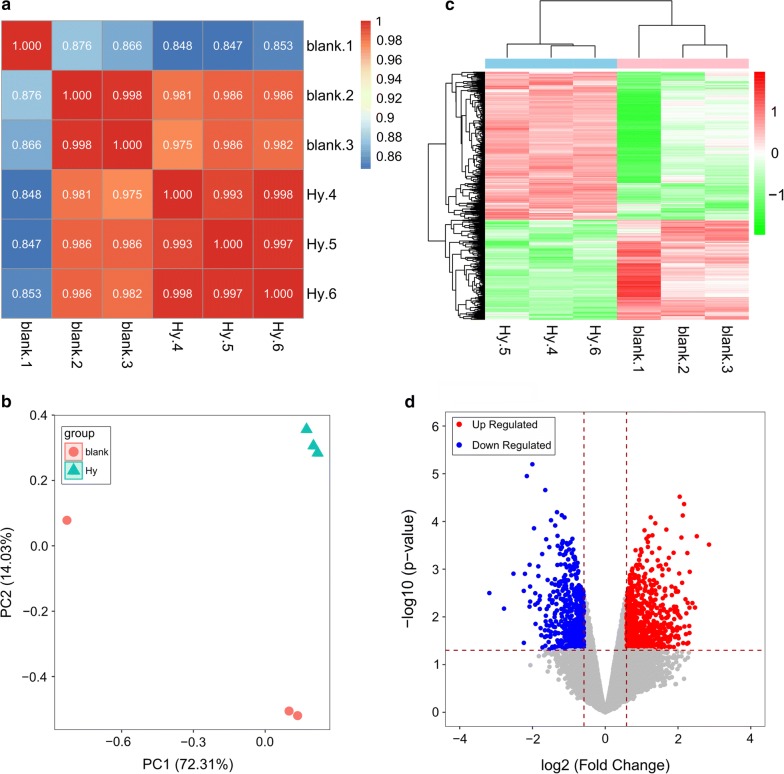
After data processing, 14,000 genes were finally obtained. Based on the expression levels in each provided sample, the Pearson correlation coefficient between two samples is represented by an (r) value (Fig. 2a). The closer an (r) value is to 1, the higher the expression pattern similarity between samples. The average intragroup sample similarity was 0.977, whereas the average between-group sample similarity was 0.93. These data indicated that the samples were reasonable and the experimental results were reliable.
Fig. 2.
a Correlation heat map between pairs based on expression abundance. The darker the color, the higher the correlation; the lighter the color, the lower the correlation. b Principal component analysis data. c Cluster heat map. The top pink bar indicates the control group and the light blue bar indicates the Hy treatment group. A change in color from green to red notes that the expression level of the gene is relatively high. d Differential gene volcano map. Blue indicates downregulated genes and red indicates upregulated genes
The results from a principal component analysis are shown in Fig. 2b. The Hy group was clearly distinct from the control group, with obvious DEGs in the Hy group and control group.
DEG analysis
Using the defined threshold, we obtained 1263 DEGs, including 754 upregulated and 509 downregulated genes. Based on a two-dimensional hierarchical clustering heat map of the 1263 DEG values (Fig. 2c), these genes clearly separated the samples in the pre-grouping (Fig. 2d).
Functional and pathway enrichment analysis
The 1263 DEGs were used for GO biological processes (BP) functional and KEGG pathway analyses (Table 2). The GO_BP functional analysis determined that the downregulated DEGs were mainly enriched in mitochondrial translational elongation, mitochondrial translational termination, ribosomal large subunit biogenesis, and rRNA processing, and so on. Upregulated DEGs were mainly enriched in cell adhesion, cell division, mitotic cytokinesis, and homeostasis of cell types within a tissue, etc. The KEGG pathway analysis revealed that the downregulated DEGs were mainly enriched in RNA transport, p53 signaling pathway, and transcriptional misregulation in cancer. Upregulated DEGs were enriched in endocytosis and in the PPAR, p53, GnRH, and neurotrophin signaling pathways.
Table 2.
Key GO biological processes and KEGG pathways
| DOWN or up | KEGG&GO_BP | Description | Gene |
|---|---|---|---|
| Down | KEGG_PATHWAY | hsa03013:RNA transport | RPP38, NXT1, RPP25, PHAX, ELAC1, EIF1, PYM1, GEMIN6, POP7 |
| hsa04115:p53 signaling pathway | BID, SIAH1, PMAIP1, IGFBP3, TP53AIP1 | ||
| hsa05202:Transcriptional misregulation in cancer | CEBPA, CEBPB, HIST1H3E, IGFBP3, MYC, ATF1, DDIT3, ETV4 | ||
| GO_BP | GO:0070125 ~ mitochondrial translational elongation | MRPS26, MRPS34, MRPL12, MRPS33, TSFM, MRPS12, MRPL36, MRPS6, MRPL58, MRPL44 | |
| GO:0070126 ~ mitochondrial translational termination | MRPS26, MRPS34, MRPL12, MRPS33, MRPS12, MRPL36, MRPS6, MRPL58, MRPL44 | ||
| GO:0042273 ~ ribosomal large subunit biogenesis | WDR74, NOP16, NIP7, RRS1, YAE1D1 | ||
| GO:0006364 ~ rRNA processing | RPP38, RPP25, RRP1, EXOSC4, BYSL, EXOSC5, PNO1, NOB1, RPS15A, DIEXF, LTV1, MRTO4, MRM3 | ||
| GO:0042102 ~ positive regulation of T cell proliferation | HAVCR2, HES1, TNFSF13B, ZP3, CD274, IL12A | ||
| GO:0070059 ~ intrinsic apoptotic signaling pathway in response to endoplasmic reticulum stress | CEBPB, CHAC1, TRIB3, PMAIP1, DDIT3 | ||
| Up | KEGG_PATHWAY | hsa03320:PPAR signaling pathway | ACOX2, ACSL1, EHHADH, RXRA, SCD, FADS2, GK, SCD5, ACSL3, ACAA1 |
| hsa04115:p53 signaling pathway | CDKN1A, CCNB2, CCND2, RRM2, APAF1, CCNG2, SESN1, GTSE1, SESN3 | ||
| hsa04144:Endocytosis | FGFR2, PRKCZ, LDLR, RAB5B, CYTH2, EEA1, PSD2, CLTC, GBF1, TFRC, CXCR4, VPS35, WIPF1, BIN1, CLTCL1, HSPA8, SH3GL2, IQSEC2, F2R | ||
| hsa04912:GnRH signaling pathway | MAPK14, ADCY5, MAP3K1, CALM3, PRKACA, PRKACB, CACNA1F, CACNA1D, PRKCB | ||
| hsa04722:Neurotrophin signaling pathway | MAGED1, RPS6KA2, MAPK14, BCL2, MAP3K1, CALM3, SORT1, NGFR, KIDINS220, PIK3R3 | ||
| GO_BP | GO:0007155 ~ cell adhesion | NRP2, MTSS1, ACHE, PCDHA2, L1CAM, PCDHGC3, PCDHAC1, COMP, COL12A1, CD24, LOXL2, BOC, APBA1, TYRO3, FLOT2, PODXL, MFGE8, TINAGL1, CTNNA1, COL16A1, MCAM, COL5A1, NCAM1, JUP, DSG2, CNTN1, SUSD5, ADAM12, NCAN, CD226, NTM | |
| GO:0051301 ~ cell division | SEPT4, SEPT1, GNAI2, NEK2, CLTC, CCNG2, CD2AP, SPC25, CDCA8, NCAPH, NCAPG, NCAPG2, CENPC, BUB1, CABLES2, TUBA1A, TUBA1B, CCNA2, CDK14, KIF11, TPX2, CDC20, RB1, KNSTRN, CDC25C, CDC25B, CCNB2, CCND2, CDCA7L, MAPRE2 | ||
| GO:0000281 ~ mitotic cytokinesis | KIF4A, NUSAP1, ANLN, CEP55, RACGAP1, KIF20A | ||
| GO:0048873 ~ homeostasis of number of cells within a tissue | CORO1A, BCL2, ILDR2, F2R, ADD1, FLT3LG | ||
| GO:0007265 ~ Ras protein signal transduction | ZNF304, CDKN1A, DOK3, MAPK14, IQGAP3, RB1, CCNA2, DHCR24 | ||
| GO:0032012 ~ regulation of ARF protein signal transduction | GBF1, CYTH2, PSD2, IQSEC2 | ||
| GO:0045746 ~ negative regulation of Notch signaling pathway | PEAR1, BEND6, GDPD5, DLK2, BMP7 |
A PPI network and module mining of DEGs
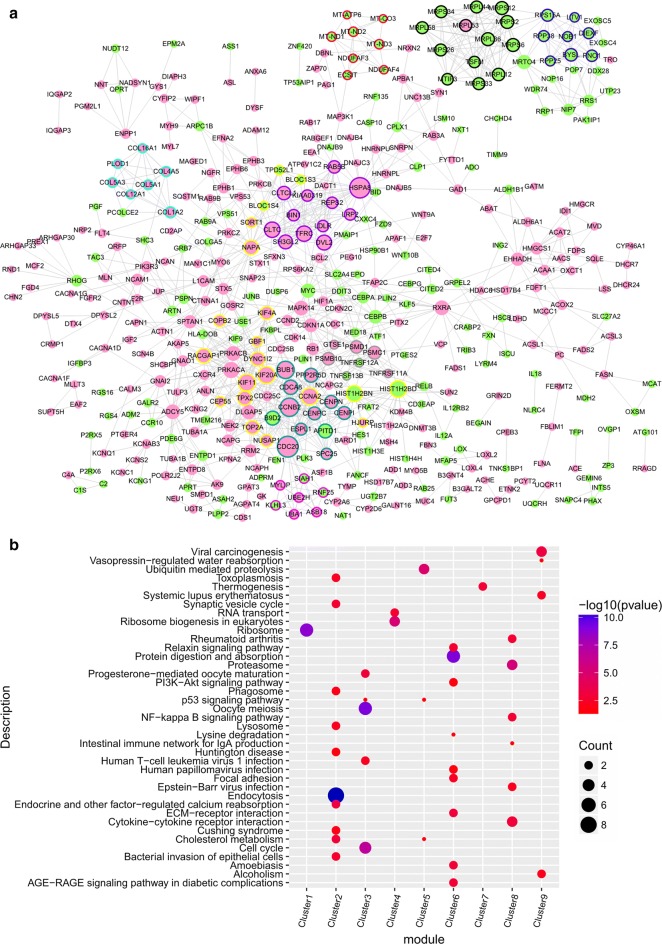
A PPI network was obtained for a total of 435 nodes and 1130 relationship pairs (Fig. 3a). A Cytoscape software CytoNCA plug-in was used to analyze the topological properties of the DEGs in the network. The top 20 degree centrality (DC), betweenness centrality (BC), and closeness centrality (CC) scores included CCNA2, CLTC, DVL2, HIST1H2BD, HIST1H2BN, HSPA8, PRKACA, and TFRC (Table 3), which were key node proteins in the PPI network.
Fig. 3.
a A protein interaction diagram of the up- and downregulated genes. The red node indicates up-regulation and the green node indicates down-regulation. The node size illustrates the size of the interaction. The different colors of the outer edge of the node represent the score > 5 network module obtained by MCODE. b Sub-network module pathway analysis results. Color change from red to blue indicates a significant decrease in the P-value. The bubble size illustrates the proportion of the number of enriched genes in the corresponding module
Table 3.
Top 20 PPI network topology property scores
| Gene | Degree | Gene | Betweenness | Gene | Closeness |
|---|---|---|---|---|---|
| CDC20 | 30 | HSPA8 | 18026.846 | CLTC | 0.009112669 |
| HSPA8 | 29 | RXRA | 15975.44 | MYC | 0.009111905 |
| CCNB2 | 25 | MAPK14 | 13874.259 | TFRC | 0.009106359 |
| BUB1 | 23 | MYC | 12210.541 | MAPK14 | 0.009104831 |
| KIF11 | 22 | CLTC | 10207.014 | CCNA2 | 0.009104831 |
| KIF20A | 22 | TFRC | 9083.066 | RB1 | 0.00910025 |
| CCNA2 | 22 | DVL2 | 8572.19 | SH3GL2 | 0.009099677 |
| HIST1H2BD | 21 | CCNA2 | 8557.233 | CEBPB | 0.009098914 |
| HIST1H2BN | 20 | MAP3K1 | 7784.2114 | HIST1H2BD | 0.009098342 |
| CLTC | 19 | COL1A2 | 7332.0977 | PRKACA | 0.009098151 |
| TFRC | 19 | PRKACA | 7097.15 | HIST1H2BN | 0.009098151 |
| DVL2 | 18 | NAPA | 6623.3286 | HSPA8 | 0.009097007 |
| PRKACA | 18 | HIST1H2BD | 6509.3853 | DVL2 | 0.009096816 |
| CDCA8 | 17 | CDC20 | 6327.5425 | PRKACB | 0.009096434 |
| NAPA | 17 | NCAM1 | 6277.285 | CEBPA | 0.009096053 |
| RACGAP1 | 17 | PRKACB | 6150.9224 | SLC2A4 | 0.009095863 |
| PPP2R5D | 16 | COL4A5 | 6065.6426 | RXRA | 0.009095673 |
| DYNC1I2 | 16 | L1CAM | 5992.727 | PSMC1 | 0.00909491 |
| B9D2 | 16 | HMGCS1 | 5969.1714 | KIF4A | 0.009094719 |
| SH3GL2 | 16 | HIST1H2BN | 5857.3853 | PSMB10 | 0.009094338 |
In this network, a total of 32 functional sub-modules were identified, including nine with a score > 5 (Fig. 3a). KEGG_pathway enrichment was performed on the nine modules (Fig. 3b), which were enriched mainly in: module 1—ribosomes; module 2—endocytosis; module 3—oocyte meiosis; module 4—ribosome biogenesis in eukaryotes; module 5—ubiquitin-mediated proteolysis; module 6—protein digestion and absorption; module 7—thermogenesis; module 8—proteasome; and module 9—viral carcinogenesis.
TF prediction
For TF prediction, a total of 67 TFs were obtained. With reference to the DEGs, six differentially regulated TFs were identified, which included four upregulated and two downregulated TFs. They were combined with 24 upregulated genes. In the TF-target network, CDKN1A, ASS1, CXCR4, and TFRC were coincidentally regulated by two or three TFs, which may be important for the transcriptional regulation (Fig. 4). Therefore, CDKN1A, ASS1, CXCR4, and TFRC were identified as key genes.
Fig. 4.
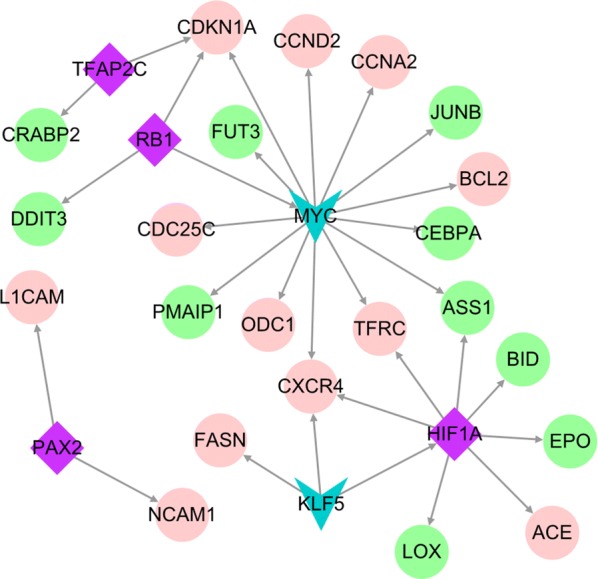
TF-target regulation network analysis map. The pink circle and green circle indicate an upregulated gene and a downregulated gene, respectively; the purple diamond and blue inverted triangle indicate an upregulated transcription factor and a down-regulated transcription factor (number of target genes ≥ 2), respectively; and the gray arrow denotes a transcription factor regulatory target gene
Survival analysis of key genes
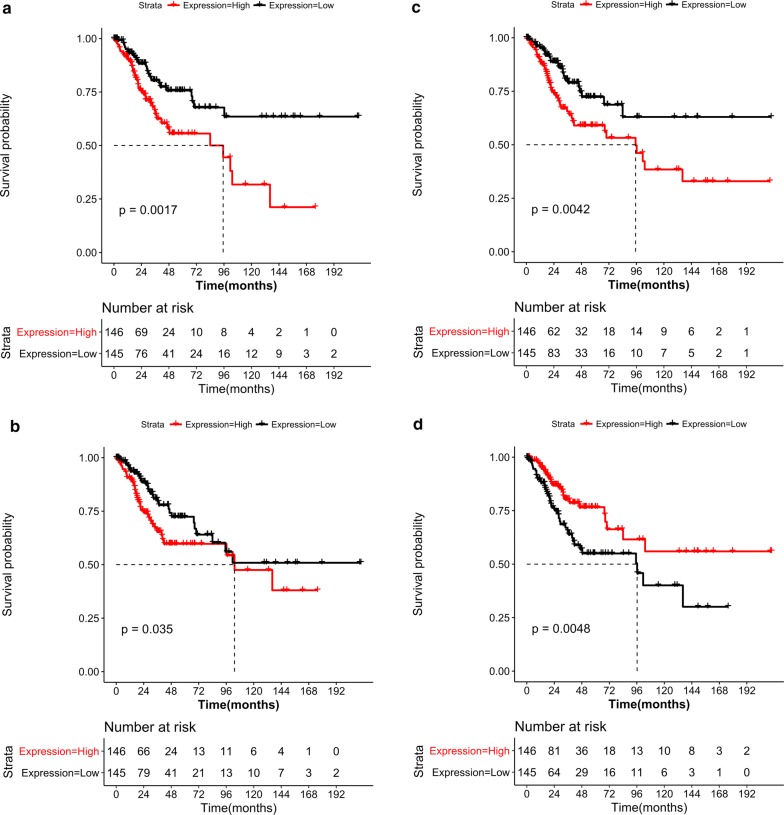
Based on the gene expression values and the TCGA cervical cancer clinical information, four genes were significantly associated with disease prognosis (P < 0.05). Among these, MYC was downregulated, whereas HSPA8, CLTC, and PRKACA were upregulated (Fig. 5). A survival curve analysis revealed that increased HSPA8, CLTC, and MYC expression and decreased PRKACA expression were associated with a worse prognosis.
Fig. 5.
Survival curves for the key genes CLTC (a), HSPA8 (b), MYC (c), and PRKACA (d); red for the high-risk group and black for the low-risk group
RT-qPCR and western blot analysis of key genes
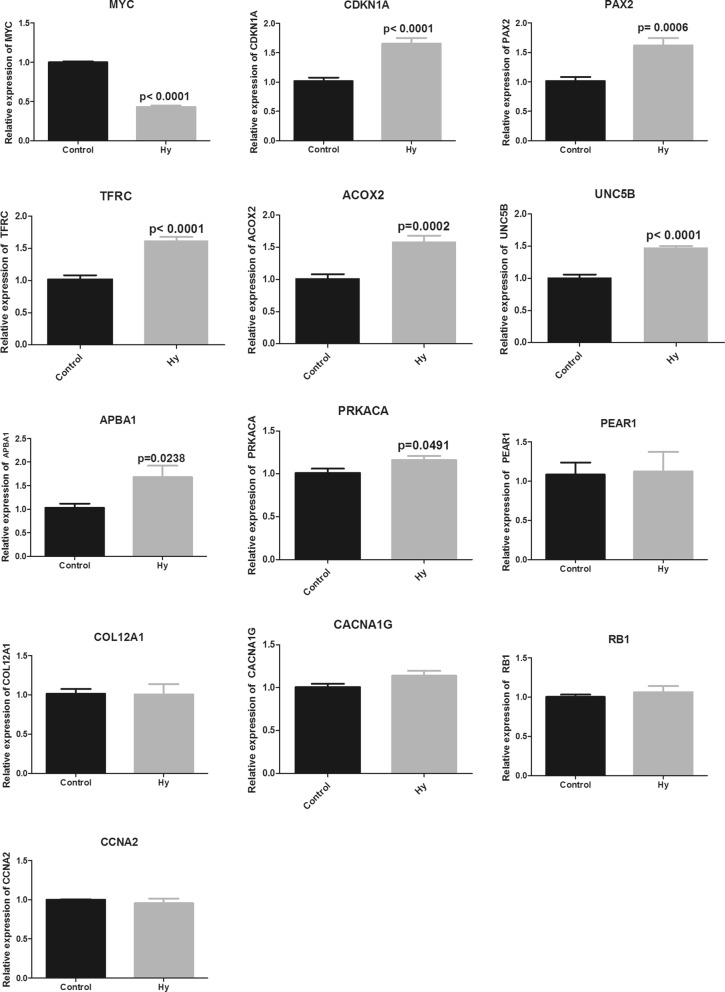
MYC gene expression in Hy-treated cells was significantly downregulated (P < 0.01), whereas CDKN1A, PAX2, TFRC, ACOX2, and UNC5B gene expression was significantly upregulated (P < 0.01) in comparison with the blank control group measured by RT-qPCR. Moreover, APBA1 and PRKACA gene levels were increased (P < 0.05). However, PEAR1, CCNA2, COL12A1, PEAR1, and CACNA1G did not exhibit significant changes (Fig. 6).
Fig. 6.
MYC, CNKN1A, PAX2, TFRC, ACOX2, UNC5B, APBA1, PRKACA, PEAR1, COL12A1, CACNA1G, RB1, and CCNA2 mRNA expression in C-33A cells
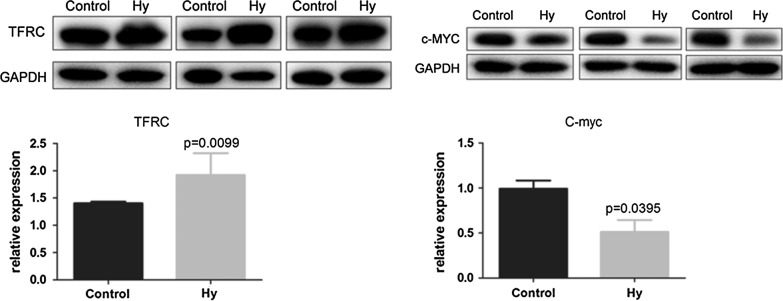
Western blot analysis revealed that Hy treatment significantly downregulated C-MYC protein levels (P < 0.01) and significantly increased TFRC protein levels in C-33A cells compared to those in the control group (P < 0.01) (Fig. 7).
Fig. 7.
Expression of C-MYC and TFRC proteins in C-33A cells. GAPDH is the reference protein
Discussion
Hy significantly inhibited C-33A and HeLa human cervical cancer cell proliferation in a dose- and time-dependent manner. This finding is consistent with the previously described Hy-induced inhibition of human non-small cell carcinoma [26]. The mechanism of cell proliferation inhibition was further investigated in C-33 A cells. A total of 1263 DEGs were obtained by RNA-Seq and screening, indicating a significant effect of Hy on C-33A cell transcription. The identified DEGs were examined by GO_BP functional and KEGG pathway analyses. The upregulated genes were mainly enriched in cell adhesion [27], cell division and proliferation [28], peroxisome proliferator-activated receptor [29], p53 [30], and gonadotropin-releasing hormone signaling pathways [31, 32]. These signaling pathways are closely related to tumor cell migration or invasion. The downregulated genes were mainly involved in apoptosis [33], mitochondrial translation [34], ribosome-related biological processes [35], the p53 signaling pathway [36], and transcriptional dysregulation pathway [37]. It should be noted that these genes are closely related to the occurrence and development of tumors. PPI network analysis identified CCNA2, CLTC, DVL2, HIST1H2BD, HIST1H2BN, HSPA8, PRKACA, and TFRC as candidate genes. Module analysis, transcription factor prediction, and TF-target regulatory network construction selected CDKN1A, ASS1, CXCR4, HIF1A, KLF5, MYC, PAX2, RB1, and TFAP2C. Finally, key genes were identified by logFC, degree ranking, and survival analysis results. We selected MYC proto-oncogene (MYC), cyclin dependent kinase inhibitor 1A (CDKN1A), paired box 2 (PAX2), transferrin receptor (TFRC), acyl-CoA oxidase 2 (ACOX2), unc-5 netrin receptor B (UNC5B), amyloid beta precursor protein binding family A member 1 (APBA1), protein kinase cAMP-activated catalytic subunit alpha (PRKACA), platelet endothelial aggregation receptor 1 (PEAR1), collagen type XII alpha 1 chain (COL12A1), CACNA1G antisense RNA 1 (CACNA1G), RB transcriptional corepressor 1 (RB1), and cyclin A2 (CCNA2) for RT-qPCR verification in the Hy and control groups. MYC, CNKN1A, PAX2, TFRC, ACOX2, UNC5B, APBA1, and PRKACA exhibited significant differences and were consistent with previous gene screening analysis results. Then, we conducted in-depth research on MYC and TFRC. Western blot confirmed that the MYC gene was significantly downregulated and the TFRC gene was significantly upregulated.
The MYC gene encompasses a group of oncogenes including C-MYC, N-MYC, and L-MYC [38]. The MYC gene family and its products promote cervical cancer cell proliferation, immortalization, dedifferentiation, and transformation [39, 40]; furthermore, they can be used as a potential diagnostic indicator for cervical cancer. Increased C-MYC positive rate and corresponding histology findings have been correlated with cancer diagnosis [41]. Presently, RNA-Seq and DEG screening identified MYC as a downregulated gene. Furthermore, MYC has been critically positioned in the constructed TF-target network; it has been implicated in the regulation of multiple genes, and is significantly associated with prognosis in survival analysis [42]. RT-qPCR and western blot results further confirmed the decreased MYC expression in Hy-treated C-33A cells. Thus, Hy has a significant inhibitory effect on the MYC gene in cervical cancer C-33A cells.
TFRC is the most important pathway for cellular iron absorption [43]. There is increasing evidence that TFRC is involved in tumorigenesis and tumor progression, and its expression is significantly dysregulated in many cancer types [44]. Furthermore, TFRC has been closely related to human cervical cancer and is positively associated with the clinical stage and with the presence of pelvic lymph node metastases [45]. In the current study, we constructed a PPI network for DEGs and confirmed the importance of TFRC in the PPI. RT-qPCR and western blot analyses revealed increased TFRC expression after Hy treatment. The TF-target network analysis identified TFRC regulation by the hypoxia-inducible factor-1A (HIF-1A) signaling pathway, and elevated HIF-1A expression. Furthermore, prior studies have reported TFRC regulation by the HIF-1A signaling pathway. Under specific conditions, such as oxidative stress, inflammation, and hypoxia, HIF-1A expression induces binding of iron regulatory protein 1 and 2, and HIF-1A promotes TFRC transcription. Furthermore, HIF-1A regulates TFRC transcription by DNA binding, and the subsequent TFRC protein production promotes iron metabolism and increases oxygen exchange [44]. However, the mechanism by which Hy increases TFRC expression remains elusive. It may be due to high HIF-1A levels caused by hypoxia. Perhaps Hy is unlikely to inhibit the TFRC-related HIF-1A signaling pathway in C-33A cell. The mechanism, by which Hy inhibits tumor proliferation, requires further experimentation and discussion.
Conclusions
In summary, Hy inhibits HeLa and C-33A cervical cancer cell proliferation, and regulates the transcription process in C-33A cells. These findings provide a new avenue for the clinical treatment of cervical cancer and a theoretical basis for the clinical application of Hy.
Acknowledgements
Not applicable.
Abbreviations
- Hy
hyperoside
- DEGs
differentially expressed genes
- TF
transcription factor
- GO
gene ontology
- BP
biological processes
- KEGG
Kyoto Encyclopedia of Gene and Genome
- HPV
human papillomavirus
- NF-κB
nuclear factor-kappa B
- RNA-seq
RNA sequencing
- IC50
half-inhibitory concentration
- MYC
MYC proto-oncogene
- CDKN1A
cyclin dependent kinase inhibitor 1A
- PAX2
paired box 2
- TFRC
transferrin receptor
- ACOX2
acyl-CoA oxidase 2
- UNC5B
unc-5 netrin receptor B
- APBA1
amyloid beta precursor protein binding family A member 1
- PRKACA
protein kinase cAMP-activated catalytic subunit alpha
- PEAR1
platelet endothelial aggregation receptor 1
- COL12A1
collagen type XII alpha 1 chain
- CACNA1G
CACNA1G antisense RNA 1
- RB1
RB transcriptional corepressor 1
- CCNA2
cyclin A2
- HIF-1A
hypoxia-inducible factor-1A
Authors’ contributions
WG, HY: data analysis, manuscript writing. YW, YZ: data analysis, project development. LZ: manuscript editing. XC, YL: data collection. All authors read and approved the final manuscript.
Funding
This work was supported by the National Natural Science Foundation of China (Program No. 81772274 and Program No. 81672584) and The General Program of Provincial Natural Science Foundation (Program No. H2017045 and Program No. ZD2016016).
Availability of data and materials
Not applicable.
Ethics approval and consent to participate
Not applicable.
Consent for publication
Not applicable.
Competing interests
The authors declare that they have no competing interests.
Footnotes
Publisher's Note
Springer Nature remains neutral with regard to jurisdictional claims in published maps and institutional affiliations.
Weikang Guo and Hui Yu contributed equally to this article
Contributor Information
Yaoxian Wang, Phone: +86-18945000012, Email: wyxxs012@126.com.
Yunyan Zhang, Phone: +86-13604843878, Email: zhangyunyan_1972@163.com.
References
- 1.D’Addario M, Redmond S, Scott P, Egli-Gany D, Riveros-Balta AX, Henao Restrepo AM, Low N. Two-dose schedules for human papillomavirus vaccine: systematic review and meta-analysis. Vaccine. 2017;35(22):2892–2901. doi: 10.1016/j.vaccine.2017.03.096. [DOI] [PubMed] [Google Scholar]
- 2.Marth C, Landoni F, Mahner S, McCormack M, Gonzalez-Martin A, Colombo N. Cervical cancer: ESMO clinical practice guidelines for diagnosis, treatment and follow-up. Ann Oncol. 2018;29:262. doi: 10.1093/annonc/mdy160. [DOI] [PubMed] [Google Scholar]
- 3.Peirson L, Fitzpatrick-Lewis D, Ciliska D, Warren R. Screening for cervical cancer: a systematic review and meta-analysis. Syst Rev. 2013;2:35. doi: 10.1186/2046-4053-2-35. [DOI] [PMC free article] [PubMed] [Google Scholar]
- 4.Koh WJ, Abu-Rustum NR, Bean S, Bradley K, Campos SM, Cho KR, Chon HS, Chu C, Clark R, Cohn D, Crispens MA, Damast S. Cervical cancer, version 3.2019, NCCN clinical practice guidelines in oncology. J Natl Compr Canc Netw. 2019;17:64–84. doi: 10.6004/jnccn.2019.0001. [DOI] [PubMed] [Google Scholar]
- 5.Gao J, Yu H, Guo W, Kong Y, Gu L, Li Q, Yang S, Zhang Y, Wang Y. The anticancer effects of ferulic acid is associated with induction of cell cycle arrest and autophagy in cervical cancer cells. Cancer Cell Int. 2018;18:102. doi: 10.1186/s12935-018-0595-y. [DOI] [PMC free article] [PubMed] [Google Scholar]
- 6.Song XL, Zhang YJ, Wang XF, Zhang WJ, Wang Z, Zhang F, Zhang YJ, Lu JH, Mei JW, Hu YP, Chen L, Li HF, Ye YY, Liu YB. Casticin induces apoptosis and G0/G1 cell cycle arrest in gallbladder cancer cells. Cancer Cell Int. 2017;17:9. doi: 10.1186/s12935-016-0377-3. [DOI] [PMC free article] [PubMed] [Google Scholar]
- 7.Boukes GJ, van de Venter M, Boukes GJ. The apoptotic and autophagic properties of two natural occurring prodrugs, hyperoside and hypoxoside, against pancreatic cancer cell lines. Biomed Pharmacother. 2016;83:617–626. doi: 10.1016/j.biopha.2016.07.029. [DOI] [PubMed] [Google Scholar]
- 8.Zhang N, Ying MD, Wu YP, Zhou ZH, Ye ZM, Li H, Lin DS. Hyperoside, a flavonoidcompound, inhibits proliferation and stimulates osteogenic dif-ferentiation of human osteosarcoma cells. PLoS ONE. 2014;9:98973. doi: 10.1371/journal.pone.0098973. [DOI] [PMC free article] [PubMed] [Google Scholar]
- 9.Liu YH, Liu GH, Mei JJ, Wang J. The preventive effects of hyperoside on lung cancer in vitro by inducing apoptosis and inhibiting proliferation through Caspase-3 and P53 signaling pathway. Biomed Pharmacother. 2016;83:381–391. doi: 10.1016/j.biopha.2016.06.035. [DOI] [PubMed] [Google Scholar]
- 10.Lü P. Inhibitory effects of hyperoside on lung cancer by inducing apoptosis and suppressing inflammatory response via caspase-3 and NF-κB signaling pathway. Biomed Pharmacother. 2016;82:216–225. doi: 10.1016/j.biopha.2016.05.006. [DOI] [PubMed] [Google Scholar]
- 11.Li FR, Yu FX, Yao ST. Hyperin extracted from Man-churian rhododendron leaf induces apoptosis in human endome-trial cancer cells through a mitochondrial pathway. Asian Pac J Cancer Prev. 2012;13:3653–3656. doi: 10.7314/APJCP.2012.13.8.3653. [DOI] [PubMed] [Google Scholar]
- 12.Harrow J, Frankish A, Gonzalez JM, Tapanari E, Diekhans M, Kokocinski F, Aken BL, Barrell D, Zadissa A, Searle S, et al. GENCODE: the reference human genome annotation for The ENCODE Project. Genome Res. 2012;22(9):1760–1774. doi: 10.1101/gr.135350.111. [DOI] [PMC free article] [PubMed] [Google Scholar]
- 13.Nikolayeva O, Robinson MD. edgeR for differential RNA-seq and ChIP-seq analysis: an application to stem cell biology. Methods Mol Biol. 2014;1150:45–79. doi: 10.1007/978-1-4939-0512-6_3. [DOI] [PubMed] [Google Scholar]
- 14.Robinson MD, McCarthy DJ, Smyth GK. edgeR: a Bioconductor package for differential expression analysis of digital gene expression data. Bioinformatics. 2010;26:139–140. doi: 10.1093/bioinformatics/btp616. [DOI] [PMC free article] [PubMed] [Google Scholar]
- 15.Ritchie ME, Phipson B, Wu D, Hu Y, Law CW, Shi W, Smyth GK. limma powers differential expression analyses for RNA-sequencing and microarray studies. Nucleic Acids Res. 2015;43:e47. doi: 10.1093/nar/gkv007. [DOI] [PMC free article] [PubMed] [Google Scholar]
- 16.Kanehisa M. KEGG: kyoto encyclopedia of genes and genomes. Nucleic Acids Res. 2000;28:27–30. doi: 10.1093/nar/28.1.27. [DOI] [PMC free article] [PubMed] [Google Scholar]
- 17.Ashburner M, Ball CA, Blake JA, Botstein D, Butler H, Cherry JM, Davis AP, Dolinski K, Dwight SS, Eppig JT, Harris MA, Ashburner M, Ball CA, Blake JA, et al. Gene ontology: tool for the unification of biology. The Gene Ontology Consortium. Nat Genet. 2000;25:25–29. doi: 10.1038/75556. [DOI] [PMC free article] [PubMed] [Google Scholar]
- 18.Huang DW, Sherman BT, Lempicki RA. Systematic and integrative analysis of large gene lists using DAVID bioinformatics resources. Nat Protoc. 2008;4:44–57. doi: 10.1038/nprot.2008.211. [DOI] [PubMed] [Google Scholar]
- 19.Szklarczyk D, Franceschini A, Wyder S, Forslund K, Heller D, Huerta-Cepas J, Simonovic M, Roth A, Santos A, Tsafou KP. STRING v10: protein-protein interaction networks, integrated over the tree of life. Nucleic Acids Res. 2015;43:447–452. doi: 10.1093/nar/gku1003. [DOI] [PMC free article] [PubMed] [Google Scholar]
- 20.Shannon P, Markiel A, Ozier O, Baliga NS, Wang JT, Ramage D, Amin N, Schwikowski B, Ideker T. Cytoscape: a software environment for integrated models of biomolecular interaction networks. Genome Res. 2003;13:2498–2504. doi: 10.1101/gr.1239303. [DOI] [PMC free article] [PubMed] [Google Scholar]
- 21.Tang Y, Li M, Wang J, Pan Y, Wu FX. CytoNCA: a cytoscape plugin for centrality analysis and evaluation of protein interaction networks. Biosystems. 2015;127:67–72. doi: 10.1016/j.biosystems.2014.11.005. [DOI] [PubMed] [Google Scholar]
- 22.Saito R, Smoot ME, Ono K, Ruscheinski J, Wang PL, Lotia S, Pico AR, Bader GD, Ideker T. A travel guide to cytoscape plugins. Nat Methods. 2012;9(11):1069–1076. doi: 10.1038/nmeth.2212. [DOI] [PMC free article] [PubMed] [Google Scholar]
- 23.Yu G, Wang LG, Han Y, He QY. clusterProfiler: an R package for comparing biological themes among gene clusters. OMICS. 2012;16:284–287. doi: 10.1089/omi.2011.0118. [DOI] [PMC free article] [PubMed] [Google Scholar]
- 24.Han H, Cho JW, Lee S, Yun A, Kim H, Bae D, Yang S, Kim CY, Lee M, Kim E, Lee S, Kang B, Jeong D, Kim Y, Jeon HN, Jung H. TRRUST: TRRUST v2: an expanded reference database of human and mouse transcriptional regulatory interactions. Nucleic Acids Res. 2018;46(D1):D380–D386. doi: 10.1093/nar/gkx1013. [DOI] [PMC free article] [PubMed] [Google Scholar]
- 25.Tyner C, Barber GP, Casper J, Clawson H, Diekhans M, Eisenhart C, Fischer CM, Gibson D, Gonzalez JN, Guruvadoo L. The UCSC genome browser database: 2017 update. Nucleic Acids Res. 2017;45:D626–D634. doi: 10.1093/nar/gkw1134. [DOI] [PMC free article] [PubMed] [Google Scholar]
- 26.Yang Y, Tantai J, Sun Y, Zhong C, Li Z. Effect of hyperoside on the apoptosis of A549 human nonsmall cell lung cancer cells and the underlying mechanism. Mol Med Rep. 2017;16:6483–6488. doi: 10.3892/mmr.2017.7453. [DOI] [PMC free article] [PubMed] [Google Scholar]
- 27.Kim DH, Wirtz D. Predicting how cells spread and migrate: focal adhesion size does matter. Cell Adh Migr. 2013;7:293–296. doi: 10.4161/cam.24804. [DOI] [PMC free article] [PubMed] [Google Scholar]
- 28.Martin GS. Cell signaling and cancer. Cancer Cell. 2003;4:167–174. doi: 10.1016/S1535-6108(03)00216-2. [DOI] [PubMed] [Google Scholar]
- 29.Misra P, Viswakarma N, Reddy JK. Peroxisome proliferator-activated receptor-α signaling in hepatocarcinogenesis. Subcell Biochem. 2013;69:77–99. doi: 10.1007/978-94-007-6889-5_5. [DOI] [PubMed] [Google Scholar]
- 30.Xiao S, Zhou Y, Yi W, Luo G, Jiang B, Tian Q, Li Y, Xue M. Fra-1 is downregulated in cervical cancer tissues and promotes cervical cancer cell apoptosis by p53 signaling pathway in vitro. Int J Oncol. 2015;46:1677–1684. doi: 10.3892/ijo.2015.2873. [DOI] [PubMed] [Google Scholar]
- 31.Gründker C, Emons G. The role of gonadotropin-releasing hormone in cancer cell proliferation and metastasis. Front Endocrinol. 2017;8:187. doi: 10.3389/fendo.2017.00187. [DOI] [PMC free article] [PubMed] [Google Scholar]
- 32.Imai A, Horibe S, Takagi A, Ohno T, Tamaya T. Frequent expression of Fas in gonadotropin-releasing hormone receptor-bearing tumors. Eur J Obstet Gynecol Reprod Biol. 1997;74:73–78. doi: 10.1016/S0301-2115(97)02750-4. [DOI] [PubMed] [Google Scholar]
- 33.Green DR. Cancer and apoptosis: who is built to last? Cancer Cell. 2017;31:2–4. doi: 10.1016/j.ccell.2016.12.007. [DOI] [PubMed] [Google Scholar]
- 34.Caudron-Herger M. Mitochondrial mutations in human cancer: curation of translation. RNA Biol. 2018;15:62–69. doi: 10.1080/15476286.2017.1373239. [DOI] [PMC free article] [PubMed] [Google Scholar]
- 35.Pelletier J, Thomas G, Volarević S. Ribosome biogenesis in cancer: new players and therapeutic avenues. Nat Rev Cancer. 2018;18:51–63. doi: 10.1038/nrc.2017.104. [DOI] [PubMed] [Google Scholar]
- 36.Rhee JK, Lee S, Park WY, Kim YH, Kim TM. Allelic imbalance of somatic mutations in cancer genomes and transcriptomes. Sci Rep. 2017;7:1653. doi: 10.1038/s41598-017-01966-z. [DOI] [PMC free article] [PubMed] [Google Scholar]
- 37.Rosario SR, Long MD, Affronti HC, Rowsam AM, Eng KH, Smiraglia DJ. Pan-cancer analysis of transcriptional metabolic dysregulation using The Cancer Genome Atlas. Nat Commun. 2018;9:5330. doi: 10.1038/s41467-018-07232-8. [DOI] [PMC free article] [PubMed] [Google Scholar]
- 38.Dang CV. MYC on the path to cancer. Cell. 2012;149:22–35. doi: 10.1016/j.cell.2012.03.003. [DOI] [PMC free article] [PubMed] [Google Scholar]
- 39.Cui F, Hou J, Huang C, Sun X, Zeng Y, Cheng H, Wang H, Li C. C-Myc regulates radiation-induced G2/M cell cycle arrest and cell death in human cervical cancer cells. J Obstet Gynaecol Res. 2017;43:729–735. doi: 10.1111/jog.13261. [DOI] [PubMed] [Google Scholar]
- 40.Liao LM, Sun XY, Liu AW, Wu JB, Cheng XL, Lin JX, Zheng M, Huang L. Low expression of long noncoding XLOC_010588 indicates a poor prognosis and promotes proliferation through upregulation of c-Myc in cervical cancer. Gynecol Oncol. 2014;133:616–623. doi: 10.1016/j.ygyno.2014.03.555. [DOI] [PubMed] [Google Scholar]
- 41.Ji W, Lou W, Hong Z, Qiu L, Di W. Genomic amplification of HPV, h-TERC and c-MYC in liquid-based cytological specimens for screening of cervical intraepithelial neoplasia and cancer. Oncol Lett. 2019;17:2099–2106. doi: 10.3892/ol.2018.9825. [DOI] [PMC free article] [PubMed] [Google Scholar]
- 42.Alves Rde C, Meurer RT. MYC amplification is associated with poor survival in small cell lung cancer: a chromogenic in situ hybridization study. J Cancer Res Clin Oncol. 2014;140:2021–2025. doi: 10.1007/s00432-014-1769-1. [DOI] [PMC free article] [PubMed] [Google Scholar]
- 43.Theil EC. Regulation of ferritin and transferrin receptor mRNAs. J Biol Chem. 1990;265:4771–4774. [PubMed] [Google Scholar]
- 44.Shen Y, Li X, Dong D, Zhang B, Xue Y, Shang P. Transferrin receptor 1 in cancer: a new sight for cancer therapy. Am J Cancer Res. 2018;8:916–931. [PMC free article] [PubMed] [Google Scholar]
- 45.Xu X, Liu T, Wu J, Wang Y, Hong Y, Zhou H. Transferrin receptor-involved HIF-1 signaling pathway in cervical cancer. Cancer Gene Ther. 2019 doi: 10.1038/s41417-019-0078-x. [DOI] [PubMed] [Google Scholar]
Associated Data
This section collects any data citations, data availability statements, or supplementary materials included in this article.
Data Availability Statement
Not applicable.


