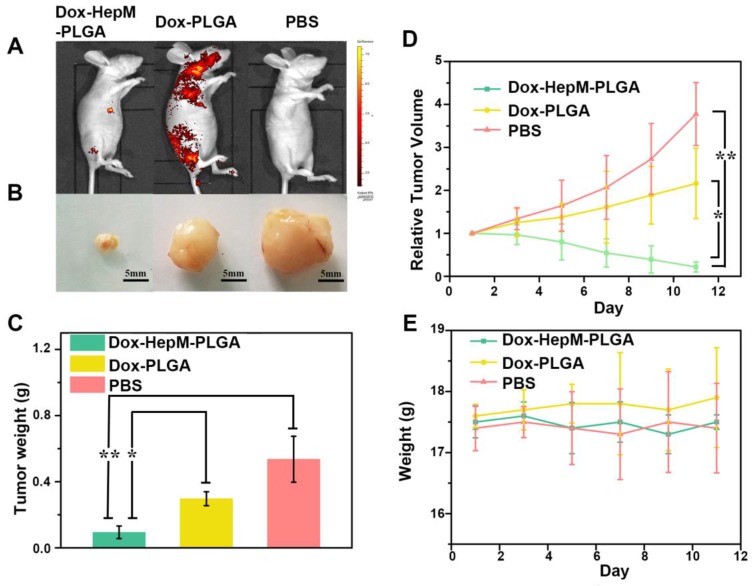
Figure 7.
In vivo tumor imaging and antitumor effect. (A) Fluorescence image of HepG2 tumor-bearing nude mice 11 days after the intravenous injection of Dox-HepM-PLGA and its counterparts. (B) Photos of the tumors extracted from the nude mice bearing the HepG2 tumor 11 days after the intravenous injection of Dox-HepM-PLGA and its counterparts. (C) Weights of the tumors extracted from the nude mice in (B). (D) Quantitative results of the HepG2 tumor relative volumes during chemotherapy. (E) Body weights of the nude mice during chemotherapy. All bars represent means±s.d. *P≤0.05, **P≤0.01.

