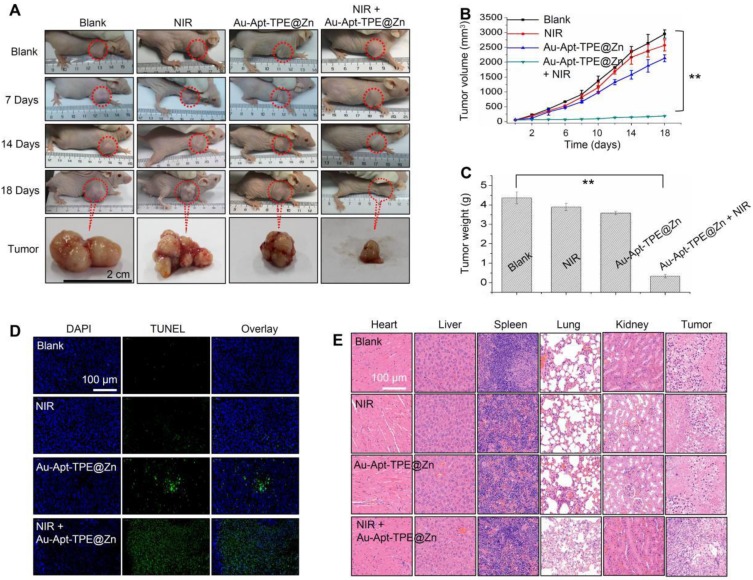
Figure 4.
In vivo therapeutic effects. (A) Representative images of tumors. Tumors photographs were imaged at 0, 7, 14 and 18 days. Changes of tumor volume (B) and tumor weight (C) measured at 18 days. (D) TUNEL assay for apoptosis in vivo. (E) Observation of cells death. Main organs and tumor tissue from mice were collected and analyzed by HE staining for observation of cells death. Data are expressed as means ± SD, **P<0.01 vs. blank group.

