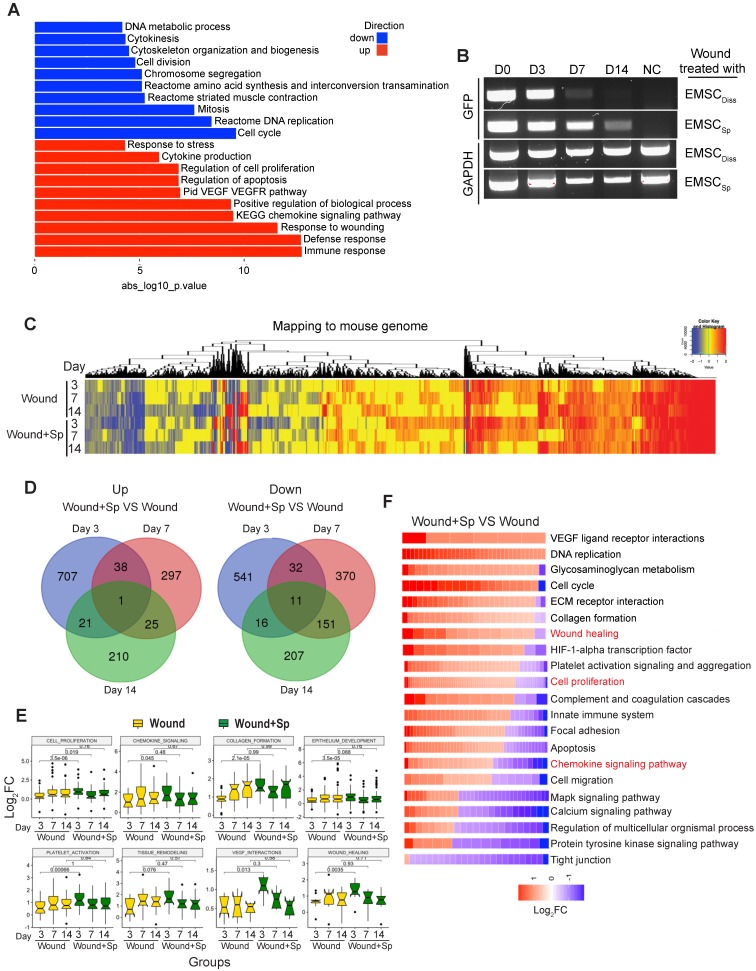
Figure 4.
Transcriptomic analysis of host cells in EMSCSp-treated wounds. (A) RNA sequencing of EMSCSp and EMSCDiss before transplantation. Enrichment analysis of human DEGs in EMSCSp versus EMSCDiss. The bar length represents the -log10 P value. The red and blue bars represent terms enriched for up- and downregulated genes, respectively. (B) Detection of GFP mRNA in the wounds of NOD/SCID mice treated with GFP+ Envy EMSCSp or EMSCDiss. GFP transcript levels were detected via RT-PCR. GFP expression in H9 hESC-derived EMSC was used as a negative control. A GAPDH transcript with a conserved sequence between mice and humans was used as a loading control. (C) Heatmap displaying the transcriptomic changes following the treatment of wounds with EMSCSp (Wound+Sp) and vehicle (Wound) after various time points (3, 7, and 14 days). Expression levels of up- and downregulated genes that differed by more than 1.5-fold are highlighted in red and blue, respectively, as indicated in the color key above. (D) Venn diagram showing the intersections among up- and downregulated genes between the Wound+Sp with Wound samples at the three time points, as described above. (E) Boxplots showing changes in the expression of genes associated with eight wound healing-related pathways in the Wound (yellow) and Wound+Sp (green) samples at the three time points. Each plot stands for a pathway. (F) Heatmaps displaying significantly enriched DEGs categorized based on gene ontology. The expression level of up- and downregulated genes that differed by more than 1.5-fold changes are shown in red and blue, respectively, as indicated in the color key below.

