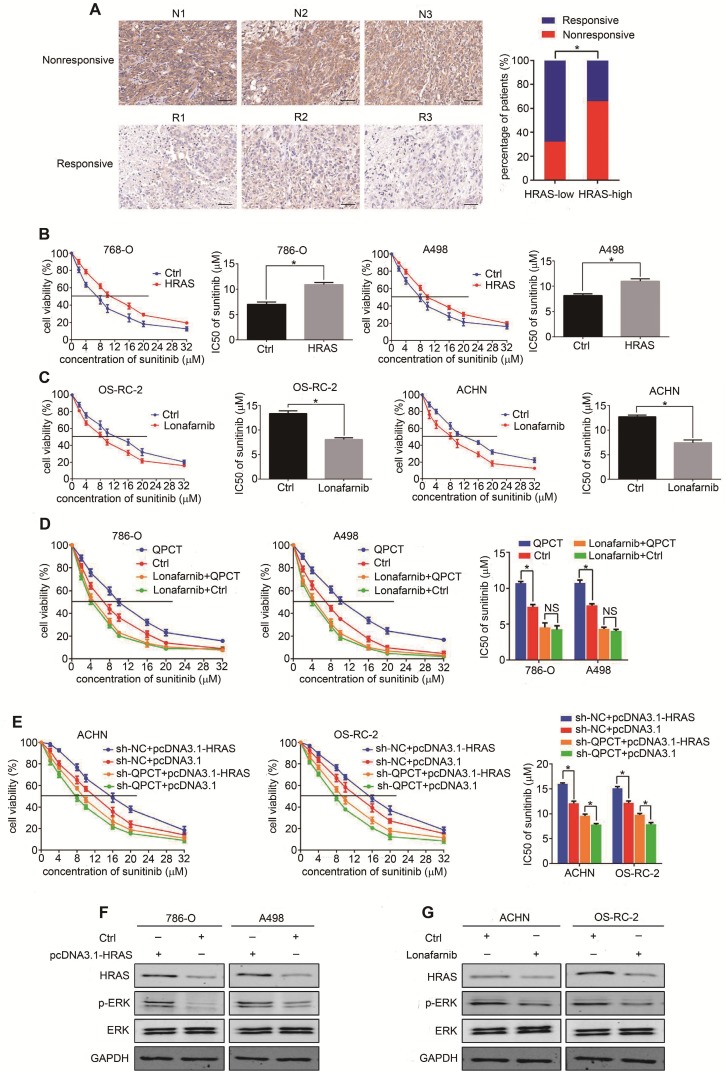
Figure 6.
HRAS plays a role in QPCT-mediated sunitinib resistance by promoting ERK phosphorylation in RCC cells. (A) Representative immunohistochemical results of HRAS expression in the sunitinib-nonresponsive and sunitinib-responsive tissues of RCC. Scale bar, 100 μm (left) and percentages of samples that were nonresponsive and responsive to sunitinib in different HRAS levels (right). (B) CCK-8 assay of 786-O and A498 cells transfected with plasmid pcDNA3.1-HRAS or control plasmid after sunitinib treatment at the indicated concentrations for 48 h (n=3). The IC50 values are shown in the right histogram. (C) CCK-8 assay of OS-RC-2 and ACHN cells with lonafarnib (1.9 nM) treatment or control OS-RC-2 and ACHN cells after sunitinib treatment at the indicated concentrations for 48 h (n=3). The IC50 values are shown in the right histogram. (D) CCK-8 assay of QPCT-overexpressing and control 786-O and A498 cells treated with lonafarnib (1.9 nM) after sunitinib treatment at the indicated concentrations for 48 hours (n=3). The IC50 values are shown in the rightmost histogram. (E) CCK-8 assay of sh-QPCT or sh-NC ACHN and OS-RC-2 cells transfected with plasmid pcDNA3.1-HRAS or control plasmid after sunitinib treatment at the indicated concentrations for 48 hours (n=3). The IC50 values are shown in the rightmost histogram. (F) Western blot analysis of p-ERK in HRAS-overexpressing and control 786-O and A498 cells. (G) Western blot analysis of p-ERK in ACHN and OS-RC-2 cells treated with lonafarnib (1.9 nM) and control ACHN and OS-RC-2 cells. Results are presented as the means ± SD. *p<0.05.

