Figure 3.

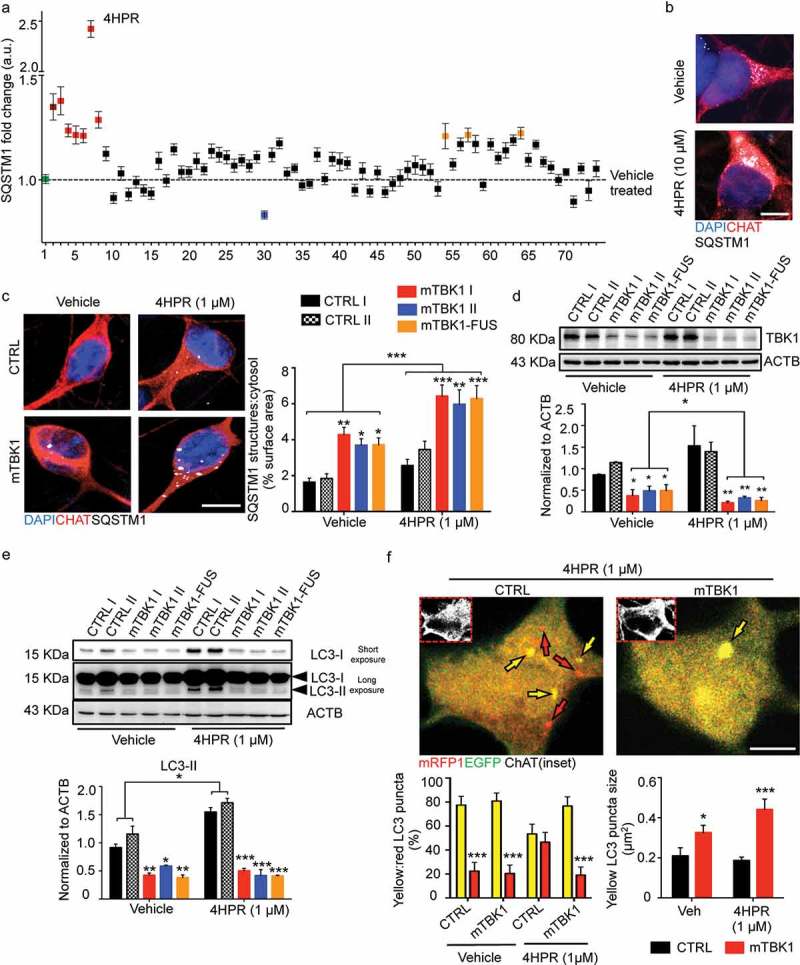
Small molecules screening identifies 4HPR as a potent modifier of mTBK1 phenotype. (a) Manhattan plot showing the intensity of SQSTM1 in mTBK1 MNs treated with the nuclear receptor ligands. In green: vehicle (DMSO, as negative control); in dark red: Rapamycin (positive control); in red: RARA agonists that increased significantly SQSTM1 intensity (4HPR is highlighted); in blue: Paxilline; in orange (in sequence): Geranylgeraniol, 6a-fluorotestosterone and 1a,25-dihydroxyvitamin D3 (One-Way ANOVA followed by Sidak´s multiple comparisons test; a complete list of the compounds is available in Table S1). (b) Representative immunolabeling of mTBK1 MNs treated with DMSO (vehicle) and 4HPR (10 μM). (c) Representative confocal images of CTRL and mTBK1 MNs at DIV14 treated with vehicle or 4HPR (1 μM) for 24 h and immunolabeled against CHAT and SQSTM1. 4HPR increases SQSTM1 accumulation in mTBK1 to a higher extent compared to CTRL (two-way ANOVA followed by Holm-Sidak´s multiple comparisons test: *p < 0.05; **p < 0.01; ***p < 0.001). (d and e) Immunoblot analysis of endogenous TBK1 (d) and LC3-II (e) protein levels in CTRL and mTBK1 MNs at DIV14 treated with vehicle or 4HPR (1 μM) for 24 h. (two-way ANOVA followed by Holm-Sidak´s multiple comparisons test: *p < 0.05; **p < 0.01; ***p < 0.001). (f) Representative confocal images of CTRL and mTBK1 MNs transfected with mRFP-EGFP-LC3 construct and treated with 4HPR (1 μM). The autophagy sensor reveals that the retinoid increases the autophagic flux in CTRL cells, while mutant MNs are characterized by an early-phase block in the pathway. Data information: the complete molecule screening was performed twice in N = 2 independent differentiations, and compounds were tested twice each time (n = 120 MNs analyzed). The other experiments were performed in N = 3 independent replicates, and in (f) the lines CTRL I and mTBK1 I were used as representative of the respective genotypes. In immunocytochemistry a minimum of n = 90 CHAT+ cells were analyzed, while the autophagy flux was evaluated in a minimum of n = 16 transfected MNs for each condition. Scale bars: (b) and (f) 5 μm, (c) 10 μm. Data are presented as mean ± SEM.
