Abstract
Purpose
In patients diagnosed with Best vitelliform macular dystrophy (BVMD), quantitative fundus autofluorescence (qAF), near-infrared fundus autofluorescence (NIR-AF), and spectral-domain optical coherence tomography (SD-OCT) were used to elucidate pathogenic mechanisms.
Methods
Fourteen patients heterozygous for BEST1 mutations were recruited. qAF was analyzed using short-wavelength fundus autofluorescence (SW-AF) images. Mean gray levels (GL) were determined in nonlesion areas (7 to 9° eccentricity) and adjusted by GL measured in an internal fluorescent reference. NIR-AF images (787 nm; sensitivity of 96) were captured and saved in non-normalized mode. Horizontal SD-OCT images also were acquired and BVMD was staged according to the OCT findings.
Results
In the pre-vitelliform stage, NIR-AF imaging revealed an area of reduced fluorescence, whereas in the vitelliruptive stage, puncta of elevated NIR-AF signal were present. In both SW-AF and NIR-AF images, the vitelliform lesion in the atrophic stage was marked by reduced signal. At all stages of BVMD, nonlesion qAF was within the 95% confidence intervals for healthy eyes. Similarly, the NIR-AF intensity measurements outside the vitelliform lesion were comparable to the healthy control eye. SD-OCT scans revealed a fluid-filled detachment between the ellipsoid zone and the hyperreflectivity band attributable to RPE/Bruch's membrane.
Conclusions
NIR-AF imaging can identify the pre-vitelliform stage of BVMD. Mutations in BEST1 are not associated with increased levels of SW-AF outside the vitelliform lesion. Elevated SW-AF within the fluid-filled lesion likely reflects the inability of RPE to phagocytose outer segments due to separation of RPE from photoreceptor cells, together with progressive photoreceptor cell impairment.
Keywords: best vitelliform macular dystrophy, bestrophin, bisretinoid lipofuscin, near-infrared fundus autofluorescence, optical coherence tomography, quantitative fundus autofluorescence, retina, retinal pigment epithelium
The integral membrane protein bestrophin-1 (BEST1) is encoded by the gene BEST1 (11q13) and is expressed on the basolateral membrane of RPE cells.1,2 Mutations in BEST1 are associated with early and adult-onset disease3–5; the most common of these is juvenile-onset Best vitelliform macular dystrophy (BVMD) (OMIM 607854; BEST).3,4 More than 200 disease-causing mutations2 have been described, most of which are missense mutations2 and located in the intracellular N-terminal portion of the protein. BEST1 also has been associated with defects in ocular development, specifically nanophthalmos.6
The BEST1 protein functions as an anion channel that is permeable to chloride and that is activated by changes in cytosolic calcium concentration.2,7–17 Under physiological conditions there may be additional activators.18 The crystal structures of bacterial and chicken homologs of BEST1 have confirmed that bestrophin-1 oligomerizes to form a pentamer with each protomer containing four transmembrane helices with cytosolic N- and C-termini.7,15 Mutations in BEST1 may be associated with disease due to the production of defective channels composed of mutant and wild-type subunits or because of disruption of the putative calcium-binding domain around the carboxylate loop.7,19
BVMD is typically inherited in an autosomal dominant manner, although autosomal recessive bestrophinopathy also is recognized20 and is modeled in a naturally occurring canine BEST1 knockout model.21 Although overt disease in BVMD manifests as bilateral disease that is often restricted to the macula,3 atypical BVMD can present as multifocal and extramacular involvement22,23 and unilateral disease can occur.24 The central oval lesion appears egg yolk–like (vitelliform lesion) in color fundus photographs, and exhibits intense autofluorescence in short-wavelength fundus autofluorescence (SW-AF) images.25,26 In spectral-domain optical coherence tomography (SD-OCT), the lesion is visible as a dome-shaped fluid-filled separation between photoreceptor cells and RPE.26–28
Electrophysiological testing of BVMD patients usually reveals a normal full-field electroretinogram, although there can be exceptions.29 On the other hand, an electrooculogram (EOG), a test that measures changes in the transepithelial potential across the RPE,30 can be diagnostic for BVMD31 if the recorded light peak/dark trough ratio (Arden ratio) is less than 1.5. The light peak is considered to reflect a depolarization of the basolateral membrane of RPE due to activation of a chloride conductance in response to changes in intracellular calcium concentration.30,32,33
This association led to the suggestion that BEST1 mediates the conductance involved in the light peak of the EOG.34 A recent study of microperimetry in BVMD reported that although sensitivity is particularly decreased in the affected central maculopathy, a reduction in retinal sensitivity also can occur in nonlesion areas.35
Emission spectra recorded spectrofluorometrically within the vitelliform lesions of BVMD patients exhibit maxima (580–620 nm) that are consistent with emission spectra of RPE lipofuscin recorded in healthy eyes.26 Because the vitelliform lesion is also notably hyperautofluorescent in SW-AF images, it has been assumed that this intensity represents a generalized increase in lipofuscin autofluorescence throughout the retina of BVMD patients.36 Nevertheless, we have previously observed that SW-AF (488 nm) autofluorescence, measured as quantitative fundus autofluorescence (qAF) is not elevated outside the vitelliform lesion in BVMD.26 Here we report qAF analysis of SW-AF images acquired from a second cohort of 14 patients. By way of extending our previous work, we present not only qAF values reflecting SW-AF intensities 7° to 9° outside the fovea, but also qAF color-coded images that illustrate the topographic distribution of SW-AF intensities. In addition, the signal derived primarily from RPE melanin was studied qualitatively and semiquantitatively in NIR-AF images acquired from the BVMD patients.
Methods
Subjects
Fourteen patients heterozygous for BEST1 disease-causing variants were recruited for the present study. All patients presented to the Edward S. Harkness Eye Institute, Columbia University. Demographic, clinical, and genetic data are presented in the Table. The clinical diagnosis of BVMD was based on fundus appearance, family history, and low Arden ratio on EOG. The International Society for Clinical Electrophysiology of Vision (ISCEV) standards were accorded when performing the EOG. The anterior segment evaluation was unremarkable; all the patients were phakic and had clear media. BVMD patients were staged according to SD-OCT findings as published previously.28
Table.
Clinical, Demographic, and Genetic Data
|
Patient |
Family |
Sex |
Age |
Ethnicity |
Disease Stage OD |
Disease Stage OS |
BCVA* OD |
BCVA* OS |
Refraction OD |
Refraction OS |
Mutation |
| 1 | I | M | 44 | Caucasian | Vitelliform | Preclinic | 0.10 | 0.00 | +0.25 | plan | c.884T>C:p.Ile295Thr |
| 2 | II | F | 34 | Caucasian | Vitelliruptive | Vitelliruptive | 0.00 | 0.00 | plan | plan | c.727G>A:p.Ala243Thr |
| 3 | III | F | 12 | African American | Vitelliruptive | Vitelliruptive | 0.62 | 0.10 | +6.0 | +4.0 | c.28G>A:p.Ala10Thr |
| 4 | IV | M | 59 | Hispanic | Vitelliruptive | Vitelliruptive | 0.88 | 0.50 | +2.5 | +2.75 | c.653G>A:p.Arg218His |
| 5 | V | M | 49 | Caucasian | Vitelliruptive | Atrophic | 0.40 | 0.50 | −1.5 | −1.25 | c.900G>C:p.Glu300Asp |
| 6 | VI | M | 55 | Caucasian | Vitelliruptive | Vitelliruptive† | 0.70 | 0.68 | +2.0 | +2.0 | c.89A>G:p.Lys30Arg |
| 7 | VII | M | 23 | Caucasian | Vitelliruptive | Vitelliruptive | 0.02 | 0.00 | +1.25 | +4.0 | c.887A>G:p.Asn296Ser |
| 8 | VII | M | 61 | Caucasian | Vitelliruptive | Vitelliruptive | 0.68 | 0.62 | +4.0 | +4.0 | c.887A>G:p.Asn296Ser |
| 9 | VIII | F | 32 | Caucasian | Pseudohypopyon | Pseudohypopyon | 0.10 | 1.2 | +0.25 | plan | c.727G>A:p.Ala243Thr |
| 10 | IX | M | 60 | Caucasian | Vitelliruptive | Vitelliruptive | NA | NA | NA | NA | c.274C>T:p.Arg92Cys |
| 11 | X | M | 43 | Caucasian | Vitelliruptive† | Vitelliruptive† | 1.30 | 0.30 | +0.75 | +1.00 | c.218T>A:p.Ile73Asn |
| 12 | XI | F | 43 | Asian | Vitelliruptive | Vitelliruptive | 0.20 | 0.00 | plan | plan | c.652C>T:p.Arg218Cys |
| 13 | XII | M | 57 | Caucasian | Atrophic | Vitelliruptive | 1.30 | 0.60 | −2.75 | −2.50 | c.652C>T:p.Arg218Cys |
| 14 | XIII | M | 45 | Caucasian | Pseudohypopyon | Vitelliform | 0.22 | 0.10 | +0.50 | +0.50 | c.653G>A:p.Arg218His |
BCVA: Best-corrected visual acuity logMAR equivalent.
Eyes excluded from the qAF analysis.
All procedures adhered to the tenets of the Declaration of Helsinki, and written informed consent was obtained from all patients after a full explanation of the procedures was provided. The protocol was approved by the Institutional Review Board of Columbia University.
Image Acquisition and Analysis: Short-Wavelength Autofluorescence (SW-AF)
qAF imaging was performed as described previously.26 SW-AF images (488-nm excitation, barrier filter transmitted light from 500 to 680 nm, 30° × 30° field) were acquired using a confocal scanning laser ophthalmoscope (cSLO; Spectralis HRA+OCT, Heidelberg Engineering, Heidelberg, Germany) equipped with an internal fluorescent reference for correction of variable laser power and differences in detector sensitivity. Pupils were dilated to at least 7 mm in diameter using 1% tropicamide and 2.5% phenylephrine before image acquisition. Room lights were turned off. A near-infrared reflectance image (NIR-R) was taken first and after switching to qAF mode, photoreceptor cells were bleached (20 to 30 seconds) during focusing and alignment to produce a uniform and maximum signal. The images were acquired in high-speed mode (8.9 frames/s), as a minimum of 12 frames (video format). The image quality was evaluated after recording and at least 7 of 12 frame images were required per video for further analysis. Misaligned frames (due to eye movements) or frames having diminished AF signal (due to eyelid interference or iris obstruction) were excluded. An averaged non-normalized image was generated from each video and two images from each session were analyzed (four averaged images per eye).
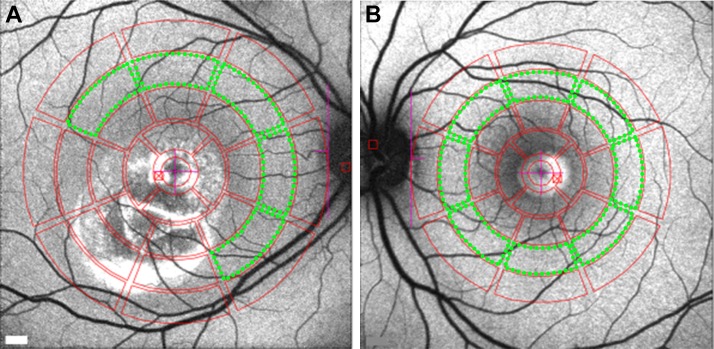
For analysis, images were exported to IGOR (WaveMetrics, Lake Oswego, OR, USA). Mean gray levels (GLs) were determined in eight circular segments at an eccentricity of approximately 7° to 9° from the fovea (middle ring, Figs. 1A, 1B). Only segments that did not overlap the lesion were included in the measurement. The outer contour of the high SW-AF signal defined the outer limits of the lesion. The presence of vessels in the sampling area, which would decrease the qAF level, was accounted for by the software algorithm. qAF values were calculated after GLs were calibrated to GLs in the reference; and after accounting for the zero-GL of the laser, refractive error, image magnification, and age-adjusted lens transmission.37 For each eye, a qAF value was computed as the mean of the qAF values of the segments (qAF8).
Figure 1.
Quantitative fundus autofluorescence image analysis. Mean GLs recorded from eight circularly arranged segments (outlined in green) centered on the fovea were used to calculate qAF. (A) Vitelliruptive stage (P7). In this patient, three segments were excluded because they overlapped the lesion area. (B) Vitelliform stage (P14). All eight segments were analyzed in this patient.
Comparison was made to 374 eyes of 277 controls of similar age range (5 to 60 years old), without eye disease and having the following ethnic composition: 87 white, 79 Hispanic, 47 African American, 43 Asian, 6 Indian, and 15 mixed ethnicity (i.e., descending from more than one distinct race). Color-coded qAF maps were computed based on pixel-wise transformation of qAF values (WaveMetrics).
Near-Infrared Autofluorescence (NIR-AF)
The HRA2-SLO (Heidelberg Engineering) was used with the indocyanine-green angiography mode (787 nm excitation, 830 nm emission) to capture NIR-AF images (30 × 30° field). With a sensitivity of 96 (within a range of 51%–100% to adjust brightness) and the eye-tracking function, 100 single frames were averaged to obtain high-quality images saved in non-normalized mode. ImageJ (http://imagej.nih.gov/ij/; provided in the public domain by the National Institutes of Health, Bethesda, MD, USA) (Microsoft Java 1.1.4) was used to analyze and plot the NIR-AF signal. All images were aligned using i2kRetina software (DualAlign LLC, Clifton Park, NY, USA). Nineteen subjects (mean age 35.96 years) without a history of eye disease served as the healthy-eye group. These individuals self-identified as Caucasian (11), African American (3), Asian (3), and Hispanic (2).
Spectral-Domain Optic Coherence Tomography (SD-OCT)
SD-OCT images were acquired with the Spectralis HRA+OCT (Heidelberg Engineering) as horizontal 9 × 9-mm scans (870 nm; 7 microM axial resolution) through the macula acquired in high-resolution mode with averaging of 100 single scans. The scans were registered automatically to a simultaneously acquired IR-R (820 nm) fundus image, which was later used for point-to-point correlation with other fundus images. Nomenclature used to identify reflectivity bands in SD-OCT images was as published.38
Results
We analyzed 28 eyes from 14 patients having a clinical diagnosis of BVMD that was confirmed by genetic testing. For all patients, heterozygous mutations were found in the BEST1 gene (Table). The age of the patients ranged from 12 to 60 years (mean 43.3 years; median 45 years). Patients were grouped as to stage of disease based on SD-OCT findings.28 Of the 14 patients, 10 were male. Of the 26 eyes (13 patients) for which refraction was recorded, 16 were hyperopic, 4 were mildly myopic, and 6 were emmetropic. The visual acuity measured in logMAR varied from 0.00 to 1.30 (mean 0.43, median 0.35) in 26 eyes (for one patient visual acuity was not recorded). Most of the eyes included in this study were in the vitelliruptive stage (20), whereas one was classified in the pre-vitelliform stage, two were in the vitelliform, three in the pseudohypopyon stage, and two were atrophic.
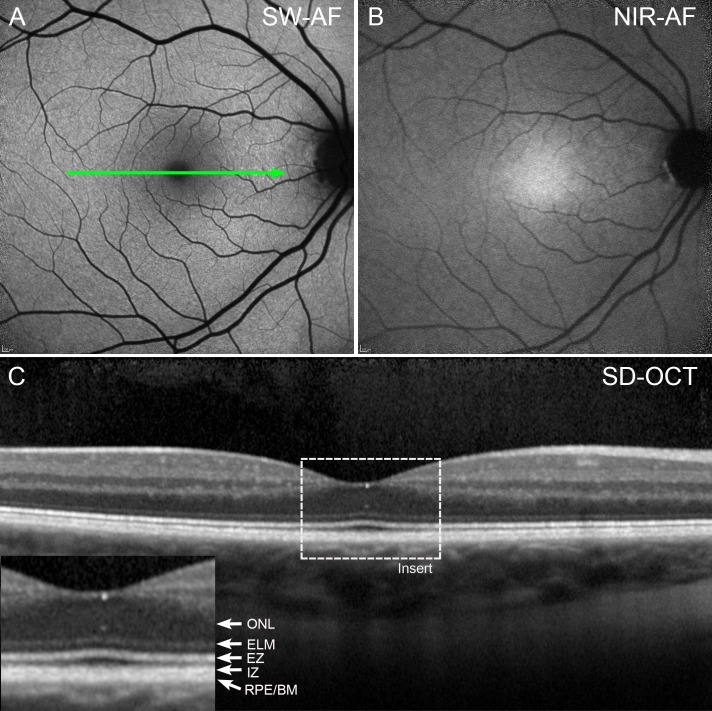
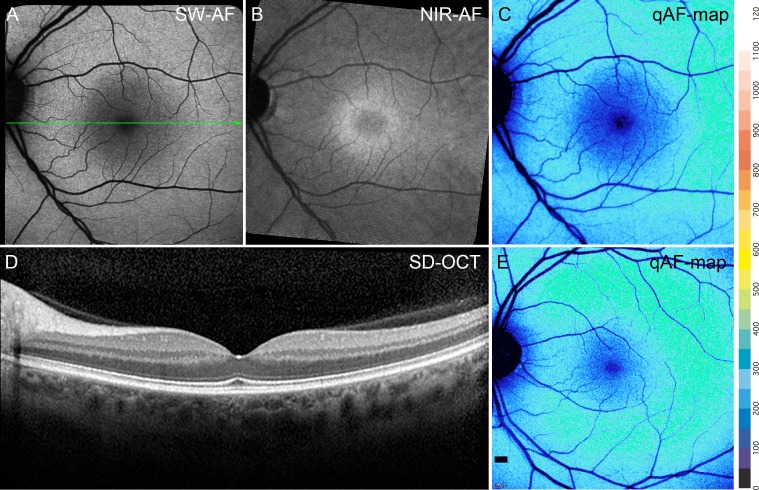
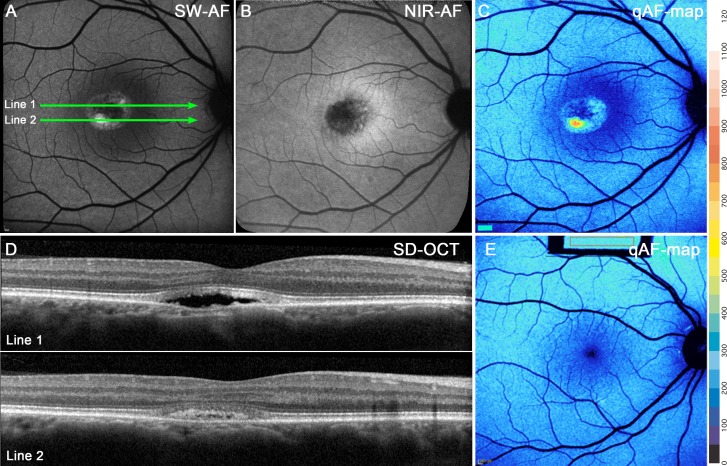
The appearance of the fundus in SW-AF and NIR-AF images in BVMD patients varied with the stage of the disease. In an eye staged as pre-vitelliform, the central elliptical-shaped NIR-AF signal characteristic of a healthy eye (Fig. 2B) was altered by a central zone of reduced NIR-AF (Fig. 3B). Conversely, no abnormalities were noted in the SW-AF and SD-OCT images in the subclinical stage (Figs. 3A, 3D) when compared with a healthy eye (Figs. 2A, 2C).
Figure 2.
Features of SW-AF (A) and NIR-AF (B) and SD-OCT (C) in a healthy eye. The central macula appears dark in SW-AF images due to absorption of the blue excitation wavelength by macular pigment, whereas in the NIR-AF image, the central macula is hyperautofluorescent due to increased optical density of melanin. The foveal depression is visible in the SD-OCT scan (C). Reflectivity layers are defined according to Staurenghi et al.38 ELM, external limiting membrane; EZ, ellipsoid zone; IZ, interdigitation zone; ONL, outer nuclear layer; RPE/BM, retinal pigment epithelium/Bruch's membrane.
Figure 3.
Pre-vitelliform stage. P1. (A) SW-AF. The fundus appearance is normal. (B) NIR-AF imaging reveals foveal hypofluorescence. (C) qAF color-coded image of P1 presents intensities comparable to that in an age-similar healthy eye (E). (D) SD-OCT scan. The green line in A indicates the position of the SD-OCT scan; no abnormalities are noted.
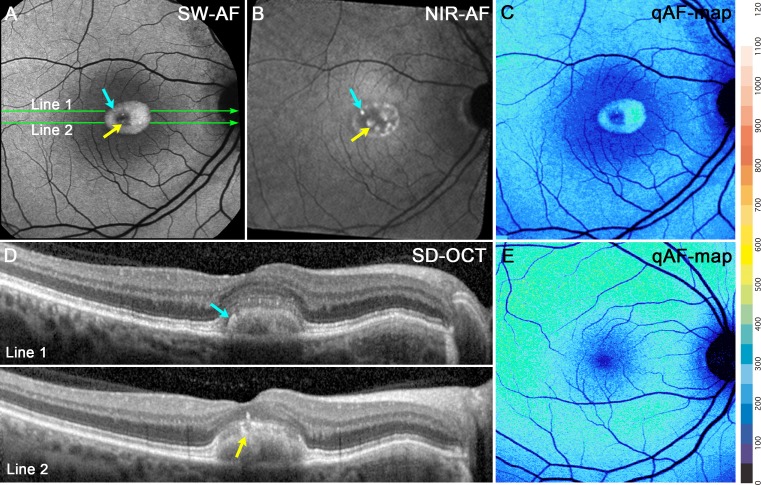
In SW-AF images, vitelliform lesions were hyperautofluorescent and exhibited a small central decreased SW-AF (Fig. 4A). On the other hand, in NIR-AF images, the vitelliform lesions exhibited reduced signal (Fig. 4B). In SD-OCT scans, these lesions were located in central macula and presented as dome-shaped separations between the ellipsoid zone and RPE/Bruch's membrane reflectivity layers (Fig. 4D). Hyperreflective material extended posteriorly into the fluid-filled space; based on continuity with the interdigitation zone, this material is assumed to be outer segments. Some hyperreflective foci associated with the lesion and visible in the SD-OCT (Fig. 4D) corresponded to points of hyperautofluorescence in the NIR-AF image (Fig. 4B).
Figure 4.
Vitelliform stage. P1. (A) SW-AF. Hyperautofluorescent signal within the lesion is considerably brighter than in surrounding fundus. (B) NIR-AF. Lesion has a dark central area and hyperfluorescent puncta. (C) qAF color-coded image. Hyperautofluorescence is confined to the lesion. qAF is not elevated outside the lesion. (D) Horizontal SD-OCT scans reveal a dome-shaped lesion. At the edge of the lesion the hyperreflective bands attributable to the ELM, EZ, and IZ are displaced anteriorly, separating these bands from the RPE/BM. Within the lesion, the IZ is disorganized. The positions of the scans are indicated by green lines in (A). The AF puncta in (A) and (B) (blue and yellow arrows) correspond to hyperreflective foci in the SD-OCT scans. (E) qAF color map of a healthy eye.
For the three eyes in the pseudohypopyon stage, the SW-AF signal in the lesion was more intense in the gravitationally dependent inferior zone of the lesion (Fig. 5A). Thus, in the corresponding SD-OCT images (Fig. 5D), the scan through the superior aspect of the lesion (Fig. 5A, line 1) revealed hyporreflectivity, whereas in the more inferior scan (Fig. 5A, line 2) the lesion was hyperreflective (Fig. 5D, lines 1 and 2). In the NIR-AF image, the lesions presented a generalized hypofluorescent signal with foci of normal or slightly increased fluorescence (Fig. 5B).
Figure 5.
Pseudohypopyon stage. P9. (A) SW-AF discloses a lesion with hyperautofluorescence that is more pronounced inferiorly. (B) NIR-AF presents a dark central lesion with AF foci. The lesion is surrounded by hyperautofluorescence that is typical of the macula. (C) qAF color-coded image reveals an intensely AF punctum within the lesion. (D) The SD-OCT scan. The ELM and EZ bands follow the anterior contours of the lesion. The hyperreflective IZ is disorganized within the lesion. The optical clarity of the lesion is consistent with fluid in the line 1, while photoreceptors outer segment debris are likely the source of the dense deposits in the inferior region (line 2). The positions of the scans are indicated by green lines in (A). (E) qAF color-coded image acquired from an age-similar healthy eye demonstrates that qAF outside the lesion in (C) is within the normal range.
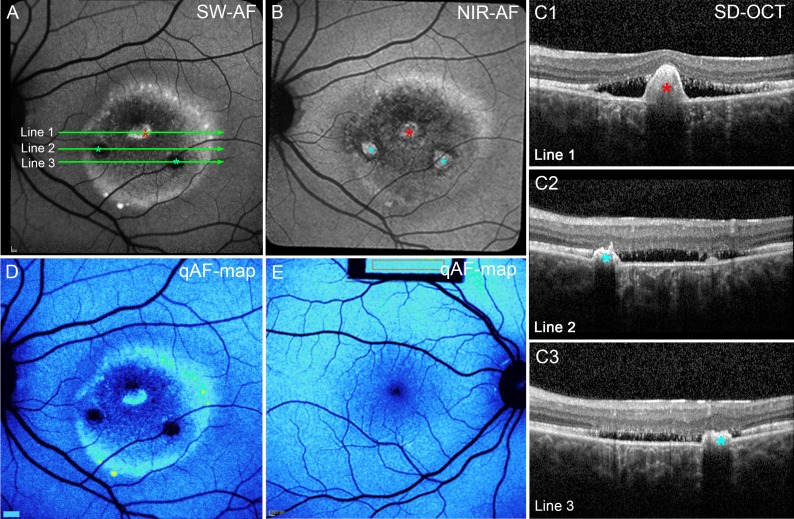
In the eyes in the vitelliruptive stage, zones of both hypo- and hyperautofluorescence were visible in SW-AF and NIR-AF images (Figs. 6A, 6B). Regions of increased fluorescent signal in SW-AF images (Fig. 6A, red asterisk) colocalized in SD-OCT scans with hyperreflective material that projected anteriorly; the RPE/Bruch's membrane band was displaced and followed the contours of this material (Fig. 6C1, red asterisk). Other anterior projections were visible in the SD-OCT scans and NIR-AF images (Figs. 6B, 6C2, 6C3; blue asterisks) but were hypoautofluorescent in the SW-AF image. The apparent continuity of RPE over the projection is consistent with their detection in NIR-AF. The detection in NIR-AF images versus SW-AF images could also constitute an optical effect; absorption of NIR wavelengths by tissue (through which the light beam passes) is less than the blue SW light. Eleven of 20 vitelliruptive eyes presented with this hyperreflective anterior projection; this was not observed at other stages. This hyperreflective material has been previously described as choroidal neovascularization3 and fibrosis.39 Transmission of SD-OCT signal into the choroid was reduced posterior to the projection in SD-OCT scans (Fig. 6C1–3), whereas at other lesion-positions, transmission of SD-OCT signal was increased, indicating that the RPE was not intact.
Figure 6.
Vitelliruptive stage. P2. (A) SW-AF image. The lesion edge and an interior spot are hyperautofluorescent. Two other round areas are hypoautofluorescent (blue asterisks). (B) The NIR-AF image. Hyperautofluorescence at the superior margin of the lesion, with three round areas of increased fluorescence in the center (asterisks). (C) SD-OCT. The ELM, EZ, and IZ are obliterated. Increased transmission into the choroid is pronounced except at positions of hyperreflective projections (A, B, C1, red asterisks) suggestive of a fibrotic scar within the central lesion (A, B, C1–3, red and blue asterisks). The horizontal axes of the scans are indicated by green lines in (A). (D) qAF color map. Areas of high fluorescence at the lesion edge and normal levels outside the lesion. (E) qAF color-coded image. Healthy eye; age similar to the patient in (D).
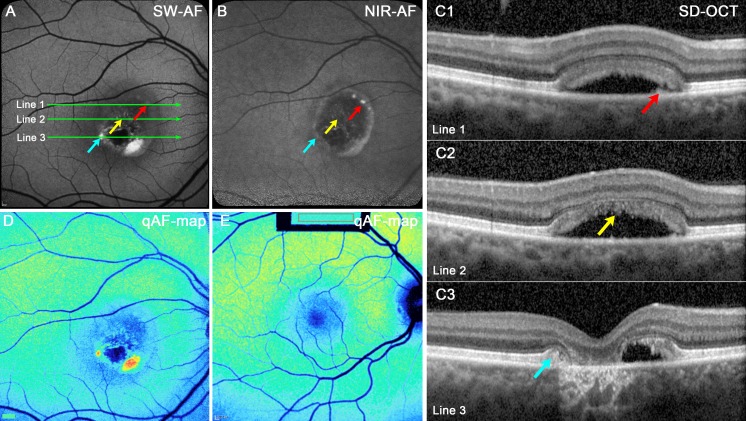
For eyes in the atrophic stage, the lesions in SW-AF and NIR-AF images were largely absent of signal with only limited spots of brightness (Figs. 7A, 7B; red, yellow, and blue arrows), whereas in the SD-OCT there was a loss of outer retinal reflectivity layers (Fig. 7C1–3). Transmission into the choroid was increased in some areas (Fig. 7C3).
Figure 7.
Atrophic stage. P5. (A) SW-AF. The lesion is hypoautofluorescent except for punta of hyperautofluorescence inferiorly. (B) NIR-AF. The interior of the lesion is primarily hypoautofluorescent; hyperautofluorescence is present at the lesion edge. (C1–3) SD-OCT scans. A thickening of the RPE/BM reflectivity band in C1 (red arrow) is not autofluorescent in the SW-AF image (A, red arrow) but presents as a bright punctum in the NIR-AF image (B, red arrow). Hyperreflective material corresponding to disorganized IZ in C2 (yellow arrow) is not autofluorescent in the SW-AF (A) and NIR-AF (B) images. The edge of the original lesion, identifiable in (C3) as anterior displacement of EZ, and ELM (blue arrow) presents as autofluorescence in the SW-AF image in (A) but is not visible in the NIR-AF image (B). Increased transmission of OCT signal into the choroid is pronounced in (C3) and inner retina has collapsed into the lesion. The positions of the scans are indicated by green lines in (A). (D, E) qAF color-coded images. Outside the vitelliform lesion in the BVMD patient (D), the qAF levels are similar to that in age-similar healthy eye (E).
An additional disease feature that was observed was a halo of decreased NIR-AF and SW-AF signal just outside the border of the vitelliform lesion (Figs. 6A, 6B; 7A, 7B; 8A, 8B). The halo was more visible superiorly and laterally than inferiorly and was more prominent in the SW-AF images (Figs. 8B, 8C). Twenty-three of 26 eyes exhibited this halo; these eyes represented all stages of disease except the pre-vitelliform stage. Two eyes had a large lesion that extended beyond the vascular arcades, thus precluding analysis of the presence or absence of halo at the border of the lesion. The NIR-AF signal was also reduced in this region, except in two eyes. In the SD-OCT scans the halo corresponded to thinning of the outer nuclear layer (Fig. 8D).
Figure 8.
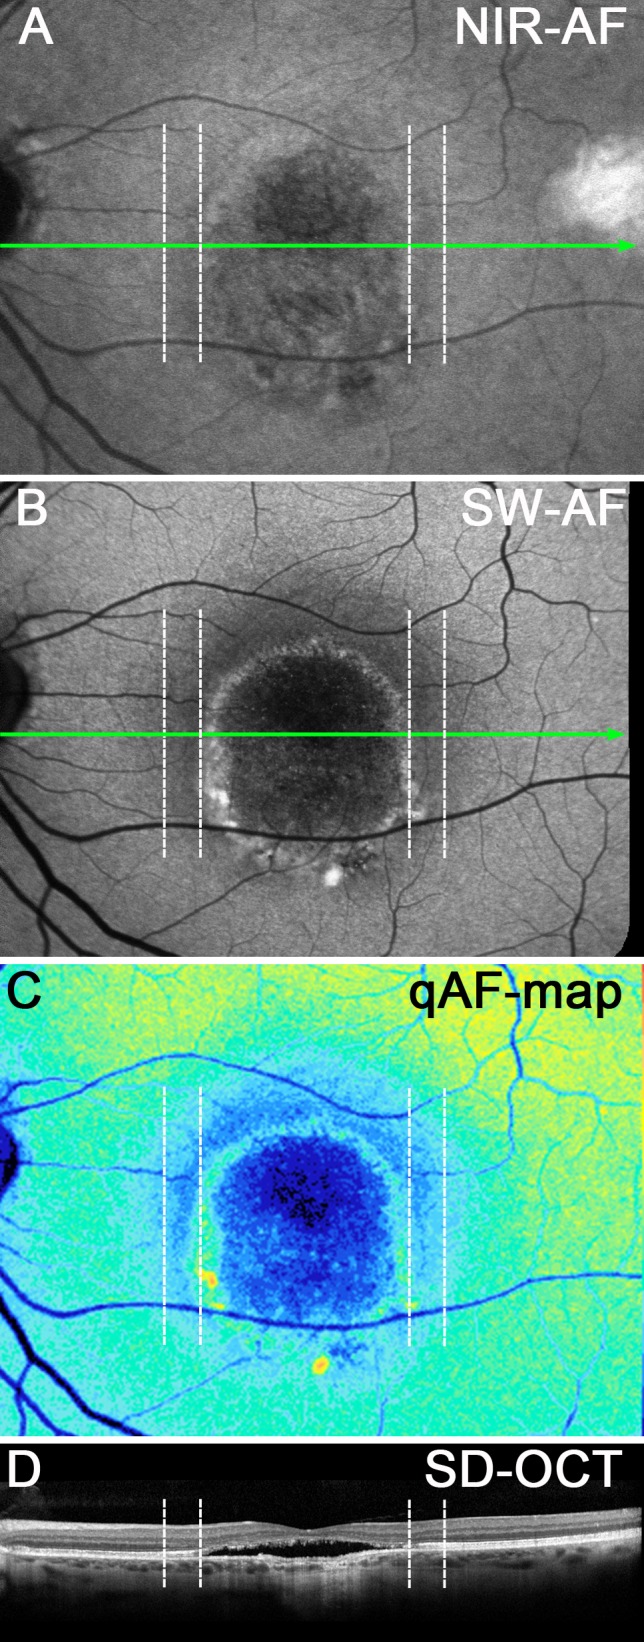
Vitelliruptive stage. P13. Corresponding positions are shown as dashed vertical lines in each image. (A) NIR-AF presents a region of faint hypofluorescence surrounding the lesion (dashed lines). (B) SW-AF image. A hypoautofluorescent zone, indicated by the vertical dashed lines, presents as a halo outside the lesion border. (C) qAF color-coded image. The zone between the vertical dashed lines exhibits reduced qAF. (D) SD-OCT. ONL is thinned within the zone indicated by the vertical dashed lines. Green lines in (A) and (B) indicate horizontal axis of SD-OCT scan.
qAF and semiquantitative NIR-AF measurements were acquired from 28 eyes of 14 BVMD patients. After image analysis, one patient (P11, two eyes) was excluded from the qAF analysis because the lesions extended beyond the arcades, precluding measurements outside the lesion. Another eye was excluded (P6, left eye) due to eye movement artifacts. In Figure 9, qAF values measured outside the vitelliform lesion are plotted as a function of age for all remaining 25 eyes. Plotting the qAF8 values acquired from the single Hispanic, African American, and Asian patients versus ethnicity-matched healthy eyes revealed that in all three cases the qAF value of the BVMD patient was well within the 95% confidence intervals of the ethnicity-matched healthy eyes plotted as a function of age (data not shown). Therefore, for presentation (Fig. 9A) we compared all BVMD eyes with our database of 374 healthy eyes (277 control subjects) with the ethnic composition as described in the Methods section. Stage of disease is also indicated (Fig. 9B). In all cases, nonlesion qAF in the BVMD eyes was within the 95% confidence intervals for healthy eyes, independent of the stage of the disease (Figs. 9A, 9B).
Figure 9.
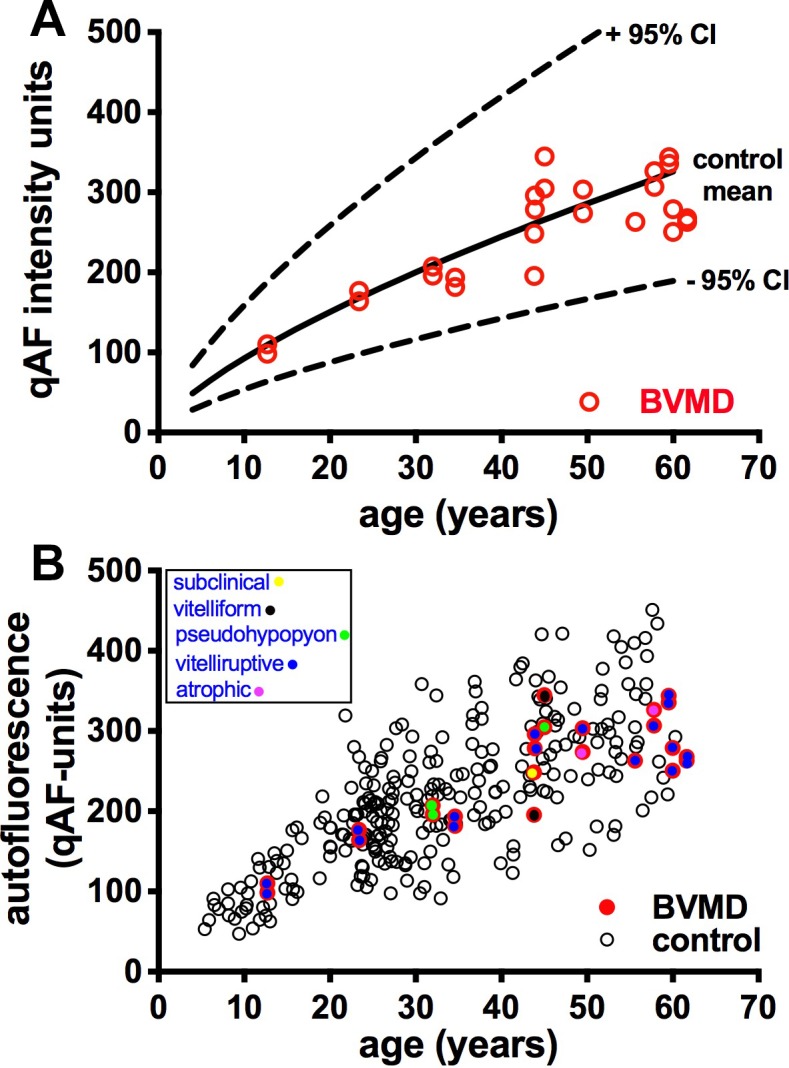
Quantitative fundus autofluorescence; 25 eyes of BVMD patients. (A) Mean nonlesion qAF in BVMD eyes (red circles) are plotted together with mean (solid black line) and 95% confidence levels (dashed lines) acquired from eyes of healthy subjects. (B) qAF values in BVMD (colored circles) and healthy eyes (black circles). Stage of BVMD is indicated.
Color-coded qAF images scaled to qAF units (1–1200) demonstrated foci of hyperautofluorescence inside the lesion. For instance, in the pseudohypopyon stage, the SW-AF signal of the vitelliform lesion was more intense inferiorly than superiorly and this difference was more noticeable in the qAF color-coded map (Fig. 5C). In the pre-vitelliform stage, SW-AF levels were comparable to a healthy eye (Figs. 3C, 3E). At other stages, the vitelliform lesions presented with variable but high SW-AF levels (Figs. 4C, 6D, 7D, 8C). Areas of atrophy and/or fibrosis showed low or absent SW-AF signal (Figs. 6D, 7D, 8C). In all stages of BVMD, qAF levels outside the lesion were normal (Figs. 3–7).
We also generated NIR-AF intensity profiles along a horizontal axis through the fovea and compared the profiles acquired from BVMD patients with profiles from healthy subjects (19 subjects). As shown in Figure 10, the NIR-AF signal in the healthy eyes increased to a peak in the fovea, whereas in the BVMD eyes the NIR-AF signal was depressed. The NIR-AF intensity was also reduced within the halo (Fig. 10, area between black and yellow lines) (P = 0.03).
Figure 10.
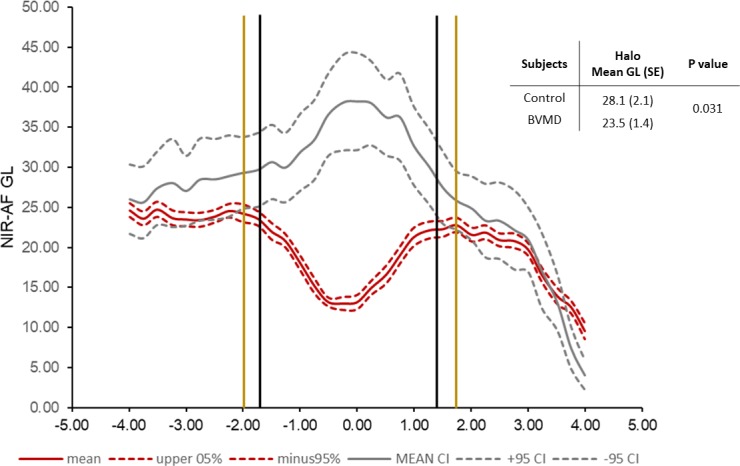
Semiquantitative NIR-AF intensity profiles. Mean (solid lines) and 95% confidence intervals (dashed lines); 28 eyes. Gray lines represent healthy control eyes and red lines indicate BVMD patients. Black vertical lines are the limits of the lesion, and the yellow vertical lines are the approximate limits of the halo. Upper right, within the halo mean GLs in the control versus BVMD eyes are significantly different (P = 0.031).
Discussion
We used the qAF approach to noninvasively measure SW-AF in BVMD patients and conclude that in fundus areas outside the central lesion, RPE lipofuscin levels are not increased. Thus, a generalized retina-wide increase in RPE lipofuscin is unlikely to be one of the primary features underlying the pathogenesis of BVMD. That said, the fluorescence within the vitelliform lesions exceeded the levels typically measured in the macula26 (Figs. 4C, 5C, 6D, 7D). Given that bisretinoid lipofuscin forms in photoreceptor outer segments before transfer to RPE, one need not assume that the autofluorescence within the vitelliform lesion is emitted from RPE. The most parsimonious explanation for the intense autofluorescence within the dome-shaped vitelliform lesion is that the emission originates from accumulating outer segment debris within the lesion, not because of an intrinsic inability of the RPE to phagocytose but because of separation of photoreceptor cells from the RPE monolayer.
The intense autofluorescence within the lesion probably also indicates that the rate of bisretinoid production in the photoreceptor cell outer segments is accelerated within the lesion. This could be due to the impairment of photoreceptor cells located in association with the fluid-filled lesion. As observed in a model of Mertk deficiency, defective phagocytosis of outer segments by RPE leads not only to deposition of outer segment debris at the RPE-photoreceptor cell interface but also to elevated production of bisretinoid fluorophores within the accumulating outer segments and eventually photoreceptor cell degeneration.40 Thus, the hyperautofluorescence of the vitelliform lesion is unlikely to be a primary disease feature but rather a secondary consequence of the fluid-filled lesion.
The focal reduction in the NIR-AF signal we observed in the pre-vitelliform stage (Fig. 3), has been noted previously.41 This variance in the NIR-AF signal was present without evidence of a lesion in SW-AF images or by SD-OCT. The anomaly may be indicative of an aberration in melanin. Alternatively, it could be due to an absorbance change. Water does not absorb light in the visible range (e.g., at the 488-nm wavelength used for SW-AF detection) but it does absorb in the near-infrared range (650–1350 nm). Thus, in the early stage of the disease, changes in the ionic and fluid composition of the cellular environment in the subretinal space may be the cause of the attenuated NIR-AF signal in the pre-vitelliform (subclinical) stage. We note, however, that fluid is not visible in the SD-OCT image at this stage (Fig. 3D). Mean retinal sensitivity measured by microperimetry was reported to be suppressed within 2 to 4 degrees eccentricity. This zone may correspond to the hypoautofluorescent area detected by NIR-AF.41 The hyper- and hypoautofluorescence associated with the lesion at other stages of BVMD in NIR-AF images could reflect various processes. For instance, the depressed signal associated with the vitelliform lesion (Figs. 4–7, 10), particularly when viewed in conjunction with RPE/Bruch's membrane thinning, likely reflects a loss of RPE cells. Alternatively, hyperautofluorescent foci within the lesion (Figs. 4–7) could be a sign of displacement and overlapping of RPE cells42 and/or elevated bisretinoid lipofuscin that contributes to the NIR-AF signal (Fig. 4).43
The presence of the fluid-filled lesion as observed in SD-OCT scans is likely the key to understanding disease processes in BEST1 disease. Because water follows the movement of anions, the outwardly directed movement of chloride is accompanied by fluid transport across the RPE cell from the subretinal space to the choroid.44 Accordingly, the formation of the fluid-filled detachment between photoreceptor cells and RPE in BVMD is attributable to impaired fluid transport secondary to the loss of anion channel activity. Reduction of anion currents in the presence of mutations in BEST1 has been demonstrated by whole-cell patch clamp recording.45–47
Acknowledgments
Supported by grants from the National Eye Institute/NIH EY024091 (JRS); the Global Ophthalmology Awards Program, a Bayer-sponsored initiative committed to supporting ophthalmic research across the world (JRLC); Edward N. & Della L. Thome Memorial Foundation (SHT); Jonas Children's Vision Care (SHT, JRS); and a grant from Research to Prevent Blindness to the Department of Ophthalmology, Columbia University.
Disclosure: J.R. Lima de Carvalho Jr, None; M. Paavo, None; L. Chen, None; J. Chiang, None; S.H. Tsang, None; J.R. Sparrow, None
References
- 1.Marmorstein AD, Marmorstein LY, Rayborn M, Wang XD, Hollyfield JG, Petrukhin K. Bestrophin, the product of the Best vitelliform macular dystrophy gene (VMD2), localizes to the basolateral plasma membrane of the retinal pigment epithelium. Proc Natl Acad Sci U S A. 2000;97:12758–12763. doi: 10.1073/pnas.220402097. [DOI] [PMC free article] [PubMed] [Google Scholar]
- 2.Johnson AA, Guziewicz KE, Lee CJ, et al. Bestrophin 1 and retinal disease. Prog Retin Eye Res. 2017;58:45–69. doi: 10.1016/j.preteyeres.2017.01.006. [DOI] [PMC free article] [PubMed] [Google Scholar]
- 3.Boon CJ, Klevering BJ, Leroy BP, Hoyng CB, Keunen JE, den Hollander AI. The spectrum of ocular phenotypes caused by mutations in the BEST1 gene. Prog Retin Eye Res. 2009;28:187–205. doi: 10.1016/j.preteyeres.2009.04.002. [DOI] [PubMed] [Google Scholar]
- 4.Marquardt A, Stohr H, Passmore LA, Kramer F, Rivera A, Weber BH. Mutations in a novel gene, VMD2, encoding a protein of unknown properties cause juvenile-onset vitelliform macular dystrophy (Best's disease) Hum Mol Genet. 1998;7:1517–1525. doi: 10.1093/hmg/7.9.1517. [DOI] [PubMed] [Google Scholar]
- 5.Jun I, Lee JS, Lee JH, et al. Adult-onset vitelliform macular dystrophy caused by BEST1 p.Ile38Ser mutation is a mild form of best vitelliform macular dystrophy. Sci Rep. 2017;7:9146. doi: 10.1038/s41598-017-09629-9. [DOI] [PMC free article] [PubMed] [Google Scholar]
- 6.Yardley J, Leroy BP, Hart-Holden N, et al. Mutations of VMD2 splicing regulators cause nanophthalmos and autosomal dominant vitreoretinochoroidopathy (ADVIRC) Invest Ophthalmol Vis Sci. 2004;45:3683–3689. doi: 10.1167/iovs.04-0550. [DOI] [PubMed] [Google Scholar]
- 7.Sun H, Tsunenari T, Yau KW, Nathans J. The vitelliform macular dystrophy protein defines a new family of chloride channels. Proc Natl Acad Sci U S A. 2002;99:4008–4013. doi: 10.1073/pnas.052692999. [DOI] [PMC free article] [PubMed] [Google Scholar]
- 8.Qu Z, Hartzell HC. Bestrophin Cl− channels are highly permeable to HCO3−. Am J Physiol Cell Physiol. 2008;294:C1371–1377. doi: 10.1152/ajpcell.00398.2007. [DOI] [PMC free article] [PubMed] [Google Scholar]
- 9.Xiao Q, Hartzell HC, Yu K. Bestrophins and retinopathies. Pflugers Arch. 2010;460:559–569. doi: 10.1007/s00424-010-0821-5. [DOI] [PMC free article] [PubMed] [Google Scholar]
- 10.Tsunenari T, Sun H, Williams J, et al. Structure-function analysis of the bestrophin family of anion channels. J Biol Chem. 2003;278:41114–41125. doi: 10.1074/jbc.M306150200. [DOI] [PMC free article] [PubMed] [Google Scholar]
- 11.Gomez NM, Tamm ER, Straubeta O. Role of bestrophin-1 in store-operated calcium entry in retinal pigment epithelium. Pflugers Arch. 2013;465:481–495. doi: 10.1007/s00424-012-1181-0. [DOI] [PubMed] [Google Scholar]
- 12.Neussert R, Muller C, Milenkovic VM, Strauss O. The presence of bestrophin-1 modulates the Ca2+ recruitment from Ca2+ stores in the ER. Pflugers Arch. 2010;460:163–175. doi: 10.1007/s00424-010-0840-2. [DOI] [PubMed] [Google Scholar]
- 13.Milenkovic VM, Rohrl E, Weber BH, Strauss O. Disease-associated missense mutations in bestrophin-1 affect cellular trafficking and anion conductance. J Cell Sci. 2011;124:2988–2996. doi: 10.1242/jcs.085878. [DOI] [PubMed] [Google Scholar]
- 14.Zhang Y, Stanton JB, Wu J, et al. Suppression of Ca2+ signaling in a mouse model of Best disease. Hum Mol Genet. 2010;19:1108–1118. doi: 10.1093/hmg/ddp583. [DOI] [PMC free article] [PubMed] [Google Scholar]
- 15.Yang T, Liu Q, Kloss B, et al. Structure and selectivity in bestrophin ion channels. Science. 2014;346:355–359. doi: 10.1126/science.1259723. [DOI] [PMC free article] [PubMed] [Google Scholar]
- 16.Hartzell HC, Qu Z, Yu K, Xiao Q, Chien LT. Molecular physiology of bestrophins: multifunctional membrane proteins linked to best disease and other retinopathies. Physiol Rev. 2008;88:639–672. doi: 10.1152/physrev.00022.2007. [DOI] [PubMed] [Google Scholar]
- 17.Kane Dickson V, Pedi L, Long SB. Structure and insights into the function of a Ca(2+)-activated Cl(−) channel. Nature. 2014;516:213–218. doi: 10.1038/nature13913. [DOI] [PMC free article] [PubMed] [Google Scholar]
- 18.Zhang Y, Kittredge A, Ward N, Ji C, Chen S, Yang T. ATP activates bestrophin ion channels through direct interaction. Nat Commun. 2018;9:3126. doi: 10.1038/s41467-018-05616-4. [DOI] [PMC free article] [PubMed] [Google Scholar]
- 19.Yang T, Justus S, Li Y, Tsang SH. BEST1: the Best target for gene and cell therapies. Mol Ther. 2015;23:1805–1809. doi: 10.1038/mt.2015.177. [DOI] [PMC free article] [PubMed] [Google Scholar]
- 20.Burgess R, Millar ID, Leroy BP, et al. Biallelic mutation of BEST1 causes a distinct retinopathy in humans. Am J Hum Genet. 2008;82:19–31. doi: 10.1016/j.ajhg.2007.08.004. [DOI] [PMC free article] [PubMed] [Google Scholar]
- 21.Guziewicz KE, Zangerl B, Lindauer SJ, et al. Bestrophin gene mutations cause canine multifocal retinopathy: a novel animal model for best disease. Invest Ophthalmol Vis Sci. 2007;48:1959–1967. doi: 10.1167/iovs.06-1374. [DOI] [PMC free article] [PubMed] [Google Scholar]
- 22.Gattoussi S, Boon CJF, Freund KB. Maintenance of good visual acuity in best disease associated with chronic bilateral serous macular detachment. Retin Cases Brief Rep. doi: 10.1097/ICB.0000000000000618. [published online ahead of print August 10, 2017]. [DOI] [PubMed]
- 23.Boon CJ, van den Born LI, Visser L, et al. Autosomal recessive bestrophinopathy: differential diagnosis and treatment options. Ophthalmology. 2013;120:809–820. doi: 10.1016/j.ophtha.2012.09.057. [DOI] [PubMed] [Google Scholar]
- 24.Arora R, Khan K, Kasilian ML, et al. Unilateral BEST1-associated retinopathy. Am J Ophthalmol. 2016;169:24–32. doi: 10.1016/j.ajo.2016.05.024. [DOI] [PMC free article] [PubMed] [Google Scholar]
- 25.Spaide RF, Noble K, Morgan A, Freund KB. Vitelliform macular dystrophy. Ophthalmology. 2006;113:1392–1400. doi: 10.1016/j.ophtha.2006.03.023. [DOI] [PubMed] [Google Scholar]
- 26.Duncker T, Greenberg JP, Ramachandran R, et al. Quantitative fundus autofluorescence and optical coherence tomography in Best vitelliform macular dystrophy. Invest Ophthalmol Vis Sci. 2014;55:1471–1482. doi: 10.1167/iovs.13-13834. [DOI] [PMC free article] [PubMed] [Google Scholar]
- 27.Querques G, Regenbogen M, Quijano C, Delphin N, Soubrane G, Souied EH. High-definition optical coherence tomography features in vitelliform macular dystrophy. Am J Ophthalmol. 2008;146:501–507. doi: 10.1016/j.ajo.2008.05.029. [DOI] [PubMed] [Google Scholar]
- 28.Ferrara DC, Costa RA, Tsang SH, Calucci D, Jorge R, Freund KB. Multimodal fundus imaging in Best vitelliform macular dystrophy. Graefes Arch Clin Exp Ophthalmol. 2010;248:1377–1386. doi: 10.1007/s00417-010-1381-2. [DOI] [PMC free article] [PubMed] [Google Scholar]
- 29.Renner AB, Tillack H, Kraus H, et al. Late onset is common in best macular dystrophy associated with VMD2 gene mutations. Ophthalmology. 2005;112:586–592. doi: 10.1016/j.ophtha.2004.10.041. [DOI] [PubMed] [Google Scholar]
- 30.Gallemore RP, Hughes BA, Miller SS. Light-induced Responses of the Retinal Pigment Epithelium. New York, NY: Oxford University Press;; 1998. [Google Scholar]
- 31.Deutman AF. Electro-oculography in families with vitelliform dystrophy of the fovea. Detection of the carrier state. Arch Ophthalmol. 1969;81:305–316. doi: 10.1001/archopht.1969.00990010307001. [DOI] [PubMed] [Google Scholar]
- 32.Gallemore RP, Steinberg RH. Effects of DIDS on the chick retinal pigment epithelium. II. Mechanism of the light peak and other responses originating at the basal membrane. J Neurosci. 1989;9:1977–1984. doi: 10.1523/JNEUROSCI.09-06-01977.1989. [DOI] [PMC free article] [PubMed] [Google Scholar]
- 33.Gallemore RP, Steinberg RH. Light-evoked modulation of basolateral membrane Cl- conductance in chick retinal pigment epithelium: the light peak and fast oscillation. J Neurophysiol. 1993;70:1669–1680. doi: 10.1152/jn.1993.70.4.1669. [DOI] [PubMed] [Google Scholar]
- 34.Marmorstein AD, Kinnick TR, Stanton JB, Johnson AA, Lynch RM, Marmorstein LY. Bestrophin-1 influences transepithelial electrical properties and Ca2+ signaling in human retinal pigment epithelium. Mol Vis. 2015;21:347–359. [PMC free article] [PubMed] [Google Scholar]
- 35.Parodi MB, Castellino N, Iacono P, et al. Microperimetry in Best vitelliform macular dystrophy. Retina. 2018;38:841–848. doi: 10.1097/IAE.0000000000001600. [DOI] [PubMed] [Google Scholar]
- 36.Guziewicz KE, Sinha D, Gomez NM, et al. Bestrophinopathy: an RPE-photoreceptor interface disease. Prog Retin Eye Res. 2017;58:70–88. doi: 10.1016/j.preteyeres.2017.01.005. [DOI] [PMC free article] [PubMed] [Google Scholar]
- 37.van de Kraats J, van Norren D. Optical density of the aging human ocular media in the visible and the UV. J Opt Soc Am A Opt Image Sci Vis. 2007;24:1842–1857. doi: 10.1364/josaa.24.001842. [DOI] [PubMed] [Google Scholar]
- 38.Staurenghi G, Sadda S, Chakravarthy U, Spaide RF. Proposed lexicon for atomic landmarks in normal posterior segment spectral-domain optical coherence tomography: the IN*OCT consensus. Ophthalmology. 2014;121:1572–1578. doi: 10.1016/j.ophtha.2014.02.023. [DOI] [PubMed] [Google Scholar]
- 39.Querques G, Zerbib J, Georges A, et al. Multimodal analysis of the progression of Best vitelliform macular dystrophy. Mol Vis. 2014;20:575–592. [PMC free article] [PubMed] [Google Scholar]
- 40.Zhao J, Ueda K, Riera M, Kim HJ, Sparrow JR. Bisretinoids mediate light sensitivity resulting in photoreceptor cell degeneration in mice lacking the receptor tyrosine kinase Mer. J Biol Chem. 2018;293:19400–19410. doi: 10.1074/jbc.RA118.005949. [DOI] [PMC free article] [PubMed] [Google Scholar]
- 41.Parodi MB, Iacono P, Del Turco C, Bandello F. Near-infrared fundus autofluorescence in subclinical best vitelliform macular dystrophy. Am J Ophthalmol. 2014;158:1247–1252.e2. doi: 10.1016/j.ajo.2014.08.028. [DOI] [PubMed] [Google Scholar]
- 42.Sparrow JR, Yoon KD, Wu Y, Yamamoto K. Interpretations of fundus autofluorescence from studies of the bisretinoids of the retina. Invest Ophthalmol Vis Sci. 2010;51:4351–4357. doi: 10.1167/iovs.10-5852. [DOI] [PMC free article] [PubMed] [Google Scholar]
- 43.Paavo M, Zhao J, Kim HJ, et al. Mutations in GPR143/OA1 and ABCA4 inform interpretations of short-wavelength and near-infrared fundus autofluorescence. Invest Ophthalmol Vis Sci. 2018;59:2459–2469. doi: 10.1167/iovs.18-24213. [DOI] [PMC free article] [PubMed] [Google Scholar]
- 44.Edelman JL, Lin H, Miller SS. Acidification stimulates chloride and fluid absorption across frog retinal pigment epithelium. Am J Physiol. 1994;266:C946–C956. doi: 10.1152/ajpcell.1994.266.4.C946. [DOI] [PubMed] [Google Scholar]
- 45.Li Y, Zhang Y, Xu Y, et al. Patient-specific mutations impair BESTROPHIN1's essential role in mediating Ca(2+)-dependent Cl(−) currents in human RPE. Elife. 2017;6:e29914 doi: 10.7554/eLife.29914. [DOI] [PMC free article] [PubMed] [Google Scholar]
- 46.Milenkovic A, Brandl C, Milenkovic VM, et al. Bestrophin 1 is indispensable for volume regulation in human retinal pigment epithelium cells. Proc Natl Acad Sci U S A. 2015;112:E2630–E2639. doi: 10.1073/pnas.1418840112. [DOI] [PMC free article] [PubMed] [Google Scholar]
- 47.Moshfegh Y, Velez G, Li Y, Bassuk AG, Mahajan VB, Tsang SH. BESTROPHIN1 mutations cause defective chloride conductance in patient stem cell-derived RPE. Hum Mol Genet. 2016;25:2672–2680. doi: 10.1093/hmg/ddw126. [DOI] [PMC free article] [PubMed] [Google Scholar]


