OBJECTIVES:
Nonalcoholic steatohepatitis (NASH) and fibrosis play critical roles for the prognosis of patients with nonalcoholic fatty liver disease (NAFLD). Identification of patients at risk of NASH and fibrosis is therefore critical for disease management. NAFLD Fibrosis Score (NFS) and transient elastography (TE) have been suggested to exclude advanced fibrosis. However, there is increasing evidence that also patients with NASH and early fibrosis are at risk of disease progression and complications, emphasizing the need for improved noninvasive risk stratification in NAFLD.
METHODS:
Because hepatocyte apoptosis plays an early role in NASH pathogenesis, we evaluated whether the apoptosis biomarker M30 might identify NAFLD patients who are at risk of NASH and fibrosis despite low NFS or TE values. Serum M30 levels were assessed by enzyme-linked immunosorbent assay in combination with NFS and/or TE in an exploration (n = 103) and validation (n = 100) cohort of patients with biopsy-proven NAFLD.
RESULTS:
Most patients with low NFS (cutoff value < −1.455) revealed increased M30 levels (>200 U/L) in the exploration (62%) and validation (67%) cohort, and more than 70% of them had NASH, mostly with histological fibrosis. Vice versa, most patients with NFS < −1.455 but nonelevated M30 levels showed no NASH. NASH was also detected in most patients with indeterminate NFS (−1.455 to 0.676) but elevated M30 levels, from which ∼90% showed fibrosis. Similar results were obtained when using TE instead of NFS.
DISCUSSION:
The combination of the M30 biomarker with NFS or TE enables a more reliable identification of patients with an increased risk of progressed NAFLD and improves patient stratification.
INTRODUCTION
Nonalcoholic fatty liver disease (NAFLD) represents one of the most common liver diseases, ranging from simple steatosis (NAFL) to nonalcoholic steatohepatitis (NASH) (1). NASH is characterized by the presence of liver steatosis and liver injury, i.e., hepatocellular ballooning and lobular inflammation, and can result in liver fibrosis/cirrhosis (2). Patients with NASH are at risk of developing end-stage liver disease and hepatocellular carcinoma and extrahepatic complications (3–5). Although progressed fibrosis remains the strongest predictor for mortality in NAFLD, an enhanced risk of disease progression and liver-related mortality occurs also at earlier disease stages (4–6). Identification of NAFLD patients with a risk of disease progression and other complications is therefore important.
Liver biopsy is the gold standard for NAFLD detection and fibrosis staging, but it is costly and limited by sampling errors and the risk of complications (7). Much attention has therefore been focused on whether noninvasive methods can identify NAFLD patients with enhanced risk of progressed disease. Measurement of liver stiffness by transient elastography (TE) is widely accepted to categorize patients into advanced vs nonadvanced fibrosis, and its use in NAFLD is recommended in international guidelines (2,8–10). However, TE can be difficult, especially in obese patients (11,12). For obese patients, the XL probe has been developed, which, compared with the M probe, reveals a similar accuracy for detection of significant fibrosis, although the obtained TE values are lower (13–15). For the M probe, a cutoff value of 7.9 kPa allows the detection of progressed fibrosis (≥F3) with a good sensitivity and specificity (16).
Because TE is mostly available only in liver centers, noninvasive scores for fibrosis detection have been established, such as the NAFLD Fibrosis Score (NFS) that includes age, hyperglycemia, body mass index, platelet count, albumin, and aspartate aminotransferase (AST)/alanine aminotransferase (ALT) ratio (17). Using a cutoff value of −1.455, advanced fibrosis can be excluded with a negative predictive value of 93%. Furthermore, a cutoff value of 0.676 predicted the presence of advanced fibrosis with high accuracy (17). A limitation of this score, however, is that a significant proportion of patients (20%–58%) fall between the 2 cutoff values (−1.455 to 0.676) and have an indeterminate score (18). Therefore, the combination of noninvasive methods might reduce the number of patients classified as false negative or with indeterminate risk. Indeed, the combination of TE and NFS increases the diagnostic accuracy for the exclusion of progressed fibrosis in NAFLD patients (19). However, it is unclear whether the combination of noninvasive methods for the exclusion of progressed fibrosis with a biomarker that detects earlier signs of liver injury might further reduce the false-negative rate and improve the identification of patients with NASH and lower fibrosis stages.
Emerging evidence suggests that hepatocyte apoptosis plays an important role for liver injury and NAFLD progression (20,21). During apoptosis, proteases of the caspase family cleave various substrates, including keratin-18 (K18), a major intermediate filament protein of hepatocytes (22,23). Caspase-cleaved K18 fragments are released from apoptotic hepatocytes into the blood where they can be detected by the M30 enzyme-linked immunosorbent assay (ELISA) (24). Using this ELISA, caspase-cleaved K18 fragments, i.e., M30 antigen levels, were found significantly elevated in patients with NASH compared with NAFL patients (25–28). M30 levels have been extensively validated in NAFLD patients and revealed an accurate diagnostic performance for the prediction of NASH (18,25,29). Moreover, M30 levels correlate with histological NAFLD Activity Score (NAS) and single score components, especially ballooning and lobular inflammation (30,31). Studies with paired biopsies further showed that NAS changes significantly correlated with M30 levels (32,33). M30 might therefore represent a sensitive biomarker for the noninvasive assessment of NAFLD activity.
In this biopsy-proven multicenter validation study, we evaluated the diagnostic performance of the M30 biomarker for the detection of NASH in NAFLD patients with low or indeterminate risk for progressed fibrosis assessed by NFS or TE. We further investigated whether NAFLD patients with increased M30 levels reveal histological signs of fibrosis despite the lacking evidence for progressed fibrosis in the NFS or TE measurement.
METHODS
Patients
We initially investigated 103 patients with biopsy-proven NAFLD (exploration group) from Hannover Medical School. Patients with other liver comorbidities were excluded from this study. NASH was histologically detected in 76 patients by the presence of steatosis, hepatocellular ballooning, and inflammation (2,8–10). Twenty-seven patients revealed liver steatosis but did not fulfill the NASH criteria (NAFL). In addition, NAFLD activity was assessed by the NAS, which semiquantitatively evaluates the extent of steatosis, lobular inflammation, and hepatocellular ballooning and represents the sum of the single NAS components (30). Histological fibrosis staging was performed according to Kleiner et al (30). Fibrosis was detected in 50% of the NAFLD patients, and 38% of them revealed fibrosis stages ≥F2.
For the validation cohort, we recruited 100 patients with biopsy-proven NAFLD from the University Hospitals of Würzburg and Mainz. NASH was histologically detected in 65 patients of this cohort, whereas 35 patients revealed NAFL. Sixty-six percent of the NAFLD patients revealed fibrosis with ≥F2 in 50% of cases.
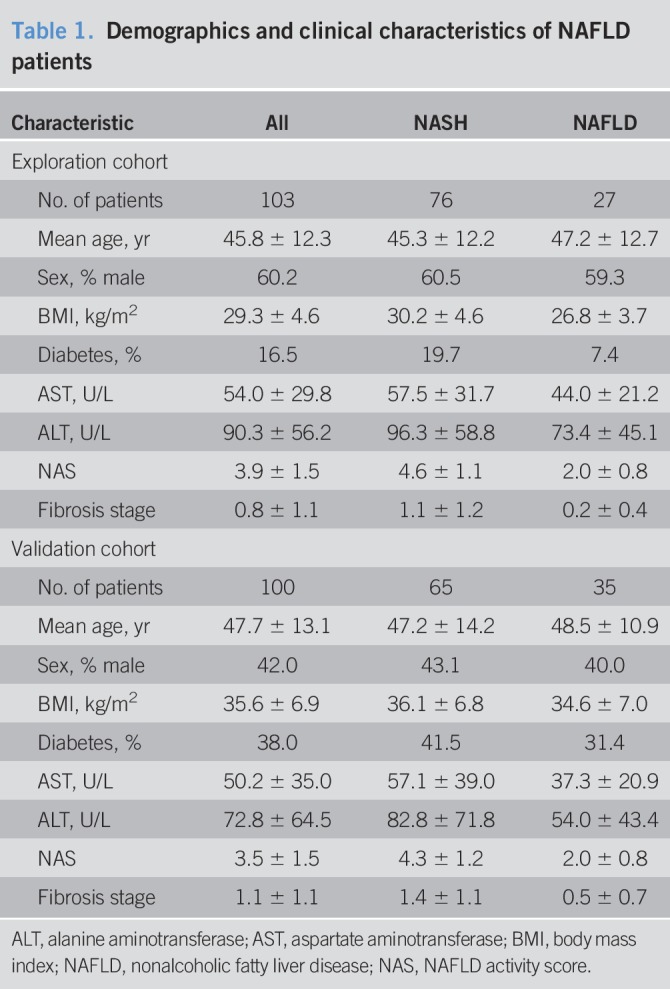
Clinical and histological characteristics of the patients (exploration and validation group) are shown in Table 1. Liver biopsies were analyzed by a local pathologist of the respective university hospital experienced in liver disease assessment. NAS and fibrosis were significantly (P < 0.01) higher in patients with NASH compared with those with NAFL. The study was performed according to the guidelines of the local ethics committees (Approval No. 3205; 837.199.10 (7208); AZ188/17; AZ96/12).
Table 1.
Demographics and clinical characteristics of NAFLD patients
Determination of the NFS
For the NFS, which includes age, hyperglycemia, body mass index, platelet count, albumin, and AST/ALT ratio, 2 cutoff values have been proposed: <−1.455 to predict the absence and >0.676 to predict the presence of advanced fibrosis (17). In our study, we applied this score for risk stratification of NAFLD patients in the exploration (n = 102) and validation (n = 100) cohort. In 1 patient of the exploration cohort, the NFS could not be calculated because of missing albumin value. Patients were divided into 3 groups: low risk (NFS < −1.455), indeterminate risk (NFS −1.455 to 0.676), and high risk (NFS > 0.676) for progressed fibrosis (8,17,34).
Assessment of liver stiffness by transient elastography
Liver stiffness was assessed in 67 (exploration cohort) and 75 (validation cohort) NAFLD patients by TE (FibroScan; EchoSens, Paris, France) as described (11). For TE measurements 2 cutoff values have been suggested: a low cutoff of 7.9 kPa to predict the absence and a high cutoff of 9.6 kPa to predict the presence of advanced fibrosis (16). For risk stratification, we divided NAFLD patients into 3 groups according to liver stiffness: low risk (TE < 7.9/7.2 kPa assessed by M/XL probe), intermediate risk (TE 7.9/7.2–9.6/9.3 kPa; M/XL probe), and high risk (TE > 9.6/9.3 kPa; M/XL probe) for progressed fibrosis (≥F3) (8,14,16,34,35).
Serological detection of M30 levels
For measurement of caspase-cleaved K18 in sera from NAFLD patients, we used the M30-Apoptosense ELISA (Peviva, VLVbio, Nacka, Sweden) as described (24,27). All samples were analyzed in duplicates.
Statistical analyses
Statistical analyses were performed using GraphPad Prism 5.0 (GraphPad Software, La Jolla, CA) and SPSS 25 software (IBM, Armonk, NY). Clinical and histological characteristics were compared in patients with NASH vs NAFL using the Mann-Whitney’s U test (non-equal distribution). Data represent mean ± SD. A P value of less than 0.05 was considered significant.
RESULTS
Risk assessment of progressed NAFLD by the combination of noninvasive methods and liver biopsy
For risk stratification of NAFLD patients, a diagnostic approach considering the combination of noninvasive methods, i.e., TE or NFS, with liver biopsy has been suggested (8,34,35). The aim of such approach is to biopsy only patients with indeterminate or high probability of progressed NAFLD after noninvasive assessment. Following detection of liver steatosis by imaging techniques and exclusion of other causes of liver steatosis, the NFS is recommended as the first step in the diagnostic algorithm (Figure 1) (8,34). In case of an NFS cutoff value of <−1.455 (n = 74/103 in our exploration and n = 54/100 in our validation cohort), a low risk of progressed disease might be assumed, and noninvasive monitoring of NAFLD progression is suggested (8,34). In case of indeterminate risk of progressed NAFLD, indicated by an NFS between −1.455 and 0.676 (n = 27 and n = 35 in our exploration and validation cohort, respectively), TE measurement by FibroScan is recommended. If further risk stratification by TE is impossible (TE 7.9/7.2–9.6/9.3 kPa, detected by M/XL probe), liver biopsy is suggested. In case of NFS > 0.676 and/or TE > 9.6/9.3 kPa (n = 26 and n = 34 in the exploration and validation cohort, respectively), progressed NAFLD can be assumed, which might allow neglecting liver biopsy (Figure 1) (8,34).
Figure 1.
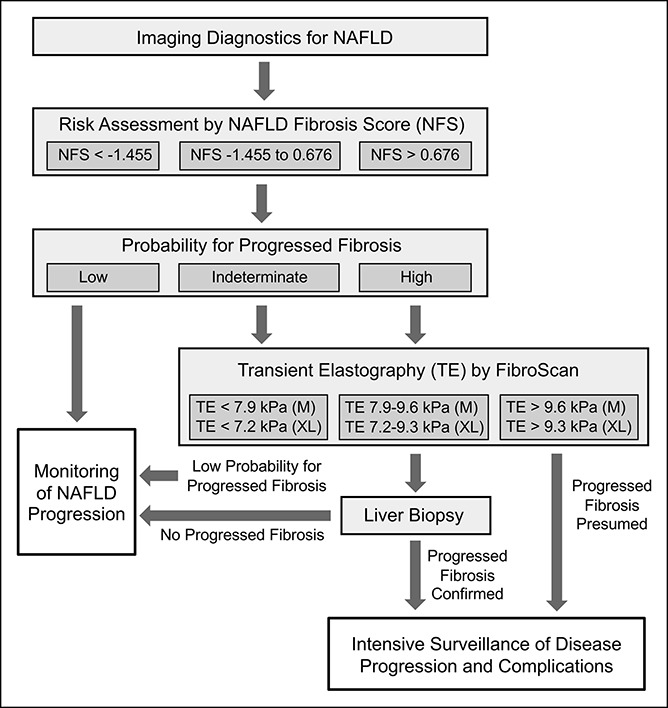
Diagnostic algorithm for NAFLD. Assessment of the indication for liver biopsy by noninvasive procedures including NFS and TE. The scheme was adapted from Refs. 8 and 34. NAFLD, nonalcoholic fatty liver disease; NFS, NAFLD Fibrosis Score; TE, transient elastography.
Detection of caspase-cleaved K18 allows the identification of NAFLD patients with NASH and fibrosis despite low NFS
There is increasing evidence that also patients with NASH and early fibrosis stages are at risk of disease progression and enhanced mortality (4–6). In the present study, we asked whether risk stratification of NAFLD patients might be further improved by considering serum levels of caspase-cleaved K18 after exclusion of advanced fibrosis based on the NFS. Previous studies demonstrated that a cutoff value of K18 fragments (M30) > 200 U/L shows an appropriate diagnostic performance for the detection of progressed liver disease (24,25). Using this cutoff, we analyzed serum M30 levels in NAFLD patients with an NFS below −1.455, which should accurately preclude progressed fibrosis (17). We found that most (62%) of the patients with NFS < −1.455 (46/74) revealed increased M30 levels (>200 U/L; Figure 2a). Moreover, in patients with NFS < −1.455 but elevated M30 levels (>200 U/L), NASH was histologically detected in 83% of the cases (38/46; Figure 2b). Fifty-eight percent of those patients (22/38) had already developed fibrosis (F1 = 15; F2 = 5; F3 = 2; Figure 2c). Vice versa, most patients (54%) with NFS < −1.455 and M30 levels ≤ 200 U/L (15/28) did not reveal NASH (Figure 2d). Importantly, most patients who were false negative (10/13; 77%) showed no fibrosis (Figure 2e).
Figure 2.
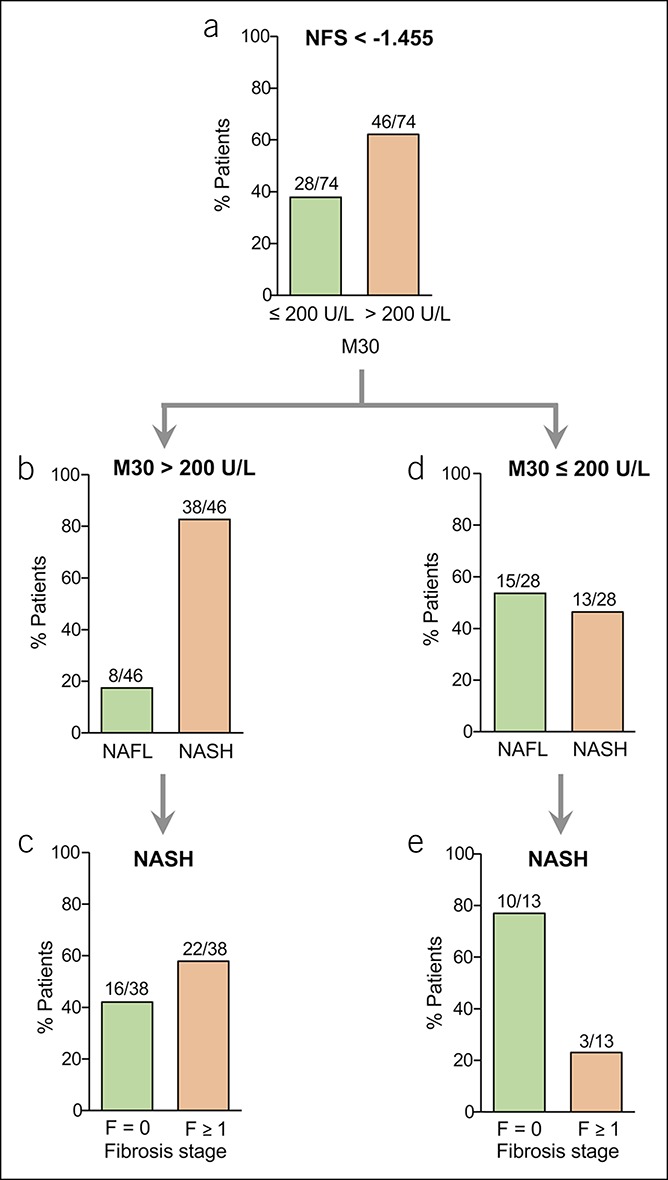
Serological detection of caspase-cleaved K18 by the M30 enzyme-linked immunosorbent assay in NAFLD patients with low NFS. (a) Most NAFLD patients with NFS < −1.455 showed elevated (>200 U/L) M30 levels. (b) Most patients with NFS < −1.455 and elevated M30 levels revealed NASH (defined by the joint presence of steatosis, hepatocellular ballooning, and inflammation). (c) Patients with NASH and elevated M30 levels showed liver fibrosis in most cases, despite low NFS < −1.455. (d) Vice versa, most NAFLD patients with NFS < −1.455 but nonelevated M30 levels (≤200 U/L) showed NAFL. (e) Most patients with NASH despite NFS < −1.455 and nonelevated M30 levels did not show histological fibrosis. NAFLD, nonalcoholic fatty liver disease; NASH, nonalcoholic steatohepatitis; NFS, NAFLD Fibrosis Score.
Diagnostic performance of M30 for the detection of NASH in NAFLD patients with indeterminate or high NFS
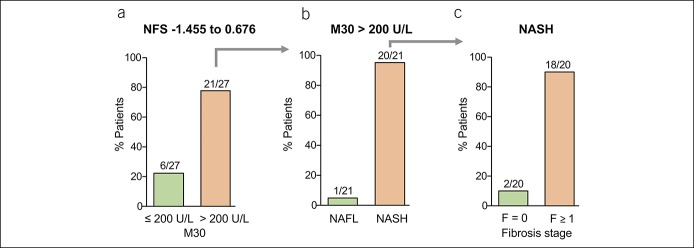
We then evaluated the suitability of the M30 ELISA for the detection of NASH in NAFLD patients with indeterminate NFS (−1.455 to 0.676), which does not allow to determine the probability of advanced fibrosis. We found that 78% of the patients with indeterminate NFS (21/27) revealed increased M30 levels (>200 U/L; Figure 3a). NASH was detected in 95% of NAFLD patients with indeterminate NFS and elevated M30 levels (20/21; Figure 3b), and 90% of them (18/20) showed already fibrosis, i.e., F1 = 7; F2 = 4; F3 = 3; F4 = 4 (Figure 3c). Thus, in the case of indeterminate NFS, the additional consideration of M30 levels strongly improved risk stratification of NAFLD patients. All patients with NFS > 0.676 had elevated M30 levels and NASH with fibrosis (data not shown). Thus, NASH was detected in 87% (58/67) of patients with low or indeterminate NFS and elevated M30 levels. Those patients would not have been considered for liver biopsy. Vice versa, 13% (9/67) of patients with NAFL would be (unnecessarily) biopsied using this diagnostic approach. However, most “false-positive” patients (7/9) showed inflammation of 1 in the NAS.
Figure 3.
Serological detection of M30 levels in NAFLD patients with indeterminate NFS. (a) Patients with NFS between −1.455 and 0.676 (indeterminate NFS) showed elevated M30 levels (>200 U/L) in most cases. (b) Most patients with indeterminate NFS and elevated M30 levels revealed NASH. (c) Most patients with NASH and elevated M30 levels despite indeterminate NFS showed histological fibrosis. NAFLD, nonalcoholic fatty liver disease; NASH, nonalcoholic steatohepatitis; NFS, NAFLD Fibrosis Score.
M30 detection in NAFLD patients with low liver stiffness allows the identification of patients with progressed disease
TE is widely used for the assessment of progressed fibrosis and also considered in diagnostic algorithms for the detection of progressed NAFLD (8,34,35). TE values below 7.9 kPa (M probe) or 7.2 kPa (XL probe) allow an accurate exclusion of progressed fibrosis (16). We therefore asked whether the combination of TE and M30 values enhances the diagnostic performance for detection of progressed NAFLD, i.e., NASH patients with already developed fibrosis. Similar as in NAFLD patients with low NFS, we found elevated M30 levels in a significant proportion (54%) of patients with low TE values (20/37; Figure 4a). In line with the low NFS, most (80%) of the patients with low TE but elevated M30 values (16/20) revealed NASH (Figure 4b), and 50% of them (8/16) showed already fibrosis, i.e., F1 = 5; F2 = 3 (Figure 4c). In case of M30 levels ≤200 U/L, most NAFLD patients with low TE values (10/17) had no NASH (Figure 4d). Eighty-six percent (6/7) of NASH patients with M30 levels ≤200 U/L showed no fibrosis (Figure 4e). According to the diagnostic approach shown in Figure 1, we also analyzed the additional value of M30 in patients with indeterminate NFS and low TE values who would not have been considered for liver biopsy. Fifty-seven percent (4/7) showed elevated M30 levels, and all of them revealed NASH with F1 or F2 fibrosis in 3 patients (data not shown).
Figure 4.
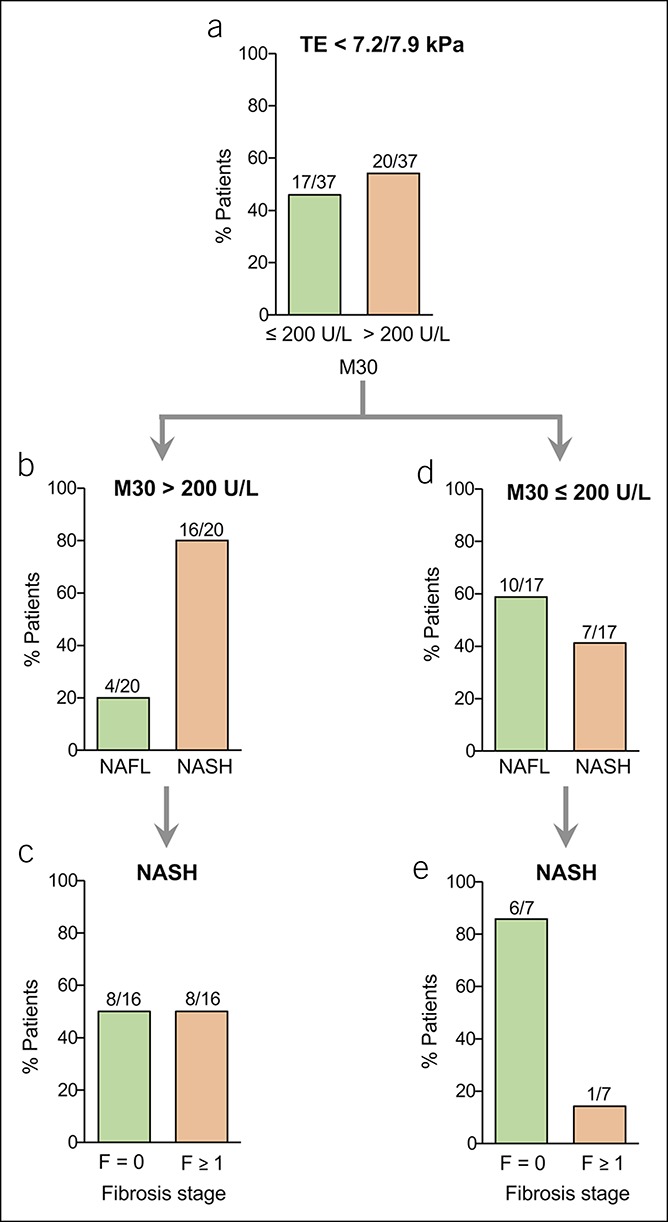
Serological detection of M30 in NAFLD patients with low liver stiffness values measured by TE. (a) A higher percentage of NAFLD patients with low TE values (<7.2 kPa or 7.9 kPa detected by FibroScan with XL or M probe) showed elevated M30 levels (>200 U/L) compared with patients with nonelevated (≤200 U/L) M30 levels. (b) Most patients with elevated M30 levels despite low TE values showed NASH. (c) Half of the NASH patients with low TE values but elevated M30 levels showed histological fibrosis. (d) Contrarily, most patients with low TE values and nonelevated M30 levels (≤200 U/L) did not reveal NASH. (e) In most patients who showed NASH, despite low TE values and nonelevated M30 levels, there was no histological evidence of fibrosis. NAFLD, nonalcoholic fatty liver disease; NASH, nonalcoholic steatohepatitis; TE, transient elastography.
Evaluation of the diagnostic performance of M30 in NAFLD patients with intermediate or high TE values
We next analyzed the performance of M30 levels in patients with intermediate liver stiffness, i.e., 7.9–9.6 kPa by M probe and 7.2–9.3 kPa by XL probe. We could demonstrate that 80% of patients (4/5) with intermediate TE values had elevated M30 levels (>200 U/L; Figure 5a), and all of them had NASH (Figure 5b), with 2 patients who had already developed fibrosis (Figure 5c). Thus, similar as in patients with indeterminate NFS, detection of M30 in patients with intermediate liver stiffness improves risk stratification.
Figure 5.
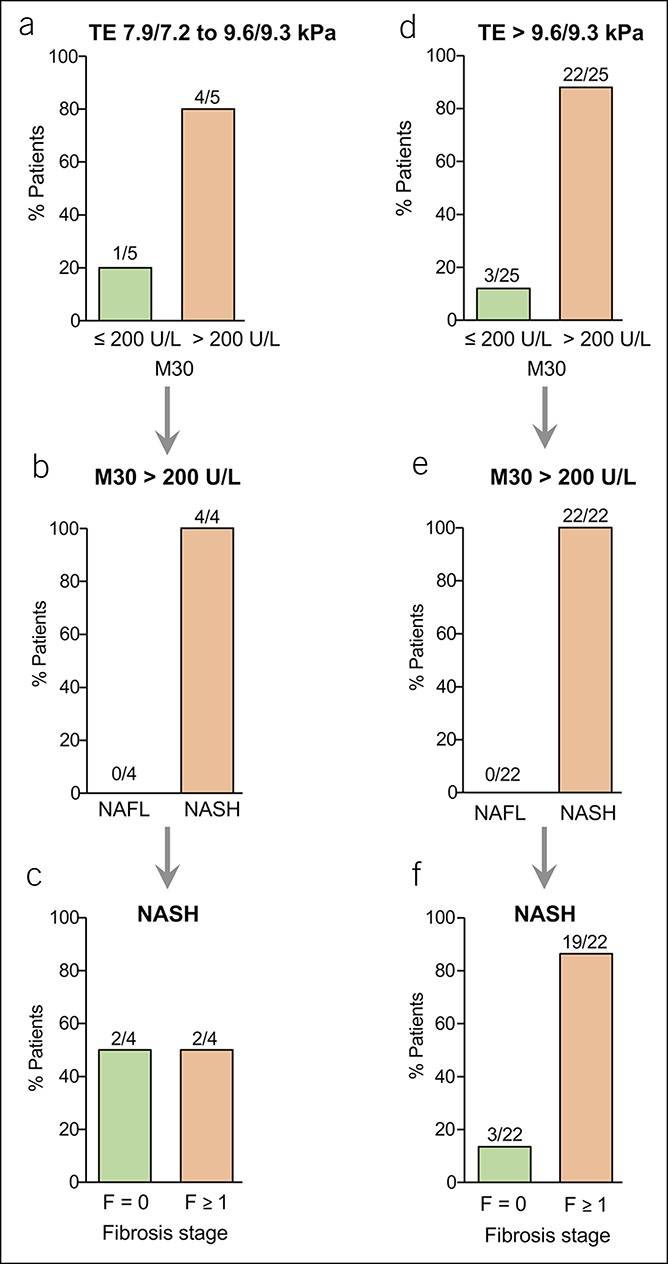
Serological detection of M30 levels in NAFLD patients with intermediate or high TE values. Only a few patients showed intermediate TE values (a–c), i.e., 7.9–9.6 kPa (M probe) or 7.2–9.3 kPa (XL probe). (a) Most patients with intermediate TE values showed elevated M30 levels (>200 U/L). (b and c) All patients with intermediate TE values and elevated M30 levels had NASH (b), and half of them showed fibrosis (c). (d–f) From NAFLD patients with high TE values, i.e., > 9.6 kPa (M probe) or > 9.3 kPa (XL probe), most had elevated M30 levels (d). All patients with high TE values and elevated M30 levels revealed NASH (e), and most NASH patients with high TE values and elevated M30 levels showed histological fibrosis (f). NAFLD, nonalcoholic fatty liver disease; NASH, nonalcoholic steatohepatitis; TE, transient elastography.
Patients with high liver stiffness, i.e., >9.6 kPa (M probe) or >9.3 kPa (XL probe), showed elevated M30 levels in 88% of cases (22/25; Figure 5d), and all of them revealed NASH (Figure 5e). Most (86%) of the patients with high TE and elevated M30 levels (19/22) had already developed liver fibrosis (Figure 5f). Thus, NASH could be detected in 83% (20/24) of NAFLD patients with low or intermediate TE values and elevated M30 levels. In NAFLD patients with low TE values, liver biopsy would normally not be considered. In this situation, M30 detection might be of diagnostic relevance because 80% of NAFLD patients with elevated M30 but low TE values revealed NASH. Vice versa, 20% (4/20) of NAFL patients with low TE but elevated K18 levels would (unnecessarily) be biopsied. However, all of those patients showed inflammation of 1 in the NAS.
Diagnostic performance of M30 for NASH detection in NAFLD patients with low NFS or TE values
To further evaluate the diagnostic performance of M30 levels (cutoff value 200 U/L) to detect NASH in NAFLD patients with low NFS or TE values, we calculated the sensitivity and the positive predictive value (PPV). In patients with an NFS <−1.455, M30 levels correctly detected NASH with a sensitivity of 75% and a PPV of 83%. In NAFLD patients with TE values below 7.9/7.2 kPa, the M30 marker detected NASH with a sensitivity of 70% and provided a PPV of 80%. M30 levels revealed a better diagnostic performance with a higher PPV for NASH detection in patients with NFS < −1.455 or TE values < 7.9/7.2 kPa compared with ALT levels (PPV 83% vs 69% and 80% vs 64%; data not shown).
Validation of the M30 marker for NASH detection in NAFLD patients with different NFS values
To validate our results obtained in the single-center NAFLD cohort (n = 103), we recruited 100 additional NAFLD patients from 2 other German university hospitals. A relevant proportion (54%) of NAFLD patients in this validation cohort revealed an NFS < −1.455 and—similarly to our exploration cohort—most (67%) of them had elevated M30 levels (>200 U/L, Figure 6a). In patients with NFS < −1.455 and elevated M30 levels, NASH was histologically detected in 72% of cases (26/36), most of which (21/26; 81%) had already developed fibrosis (F1 = 11, F2 = 8, F3 = 2). Vice versa, 61% of patients with NFS < −1.455 and M30 levels ≤ 200 U/L did not reveal NASH (data not shown). Importantly, among the small number of false-negative patients (i.e., low M30 levels despite NASH), most (6/7) showed no or minimal (F1) fibrosis.
Figure 6.
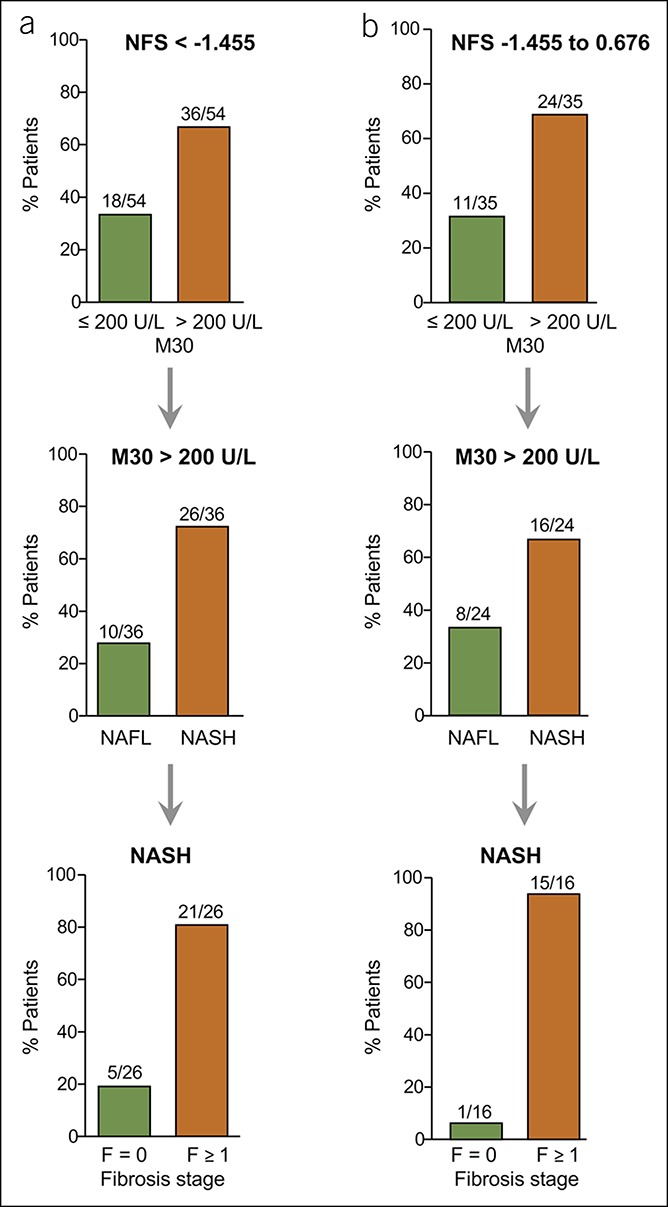
Validation of the M30 marker for NASH detection in NAFLD patients with low or indeterminate NFS. (a) Most NAFLD patients with NFS < −1.455 in the validation cohort showed elevated (>200 U/L) M30 levels, and most of them revealed histological NASH with fibrosis. (b) Patients with NFS between −1.455 and 0.676 (indeterminate NFS) revealed enhanced M30 levels in most cases, and most of them had NASH with fibrosis. NAFLD, nonalcoholic fatty liver disease; NASH, nonalcoholic steatohepatitis; NFS, NAFLD Fibrosis Score.
In NAFLD patients with indeterminate NFS (−1.455 to 0.676), elevated M30 levels were found in 69% (24/35), and most of them revealed NASH (16/24), with already developed fibrosis in 15/16 cases (F1 = 6, F2 = 5, F3 = 3, F4 = 1; Figure 6b). In all patients with NFS > 0.676 and elevated M30 levels (10/10), NASH could be histologically detected, and 90% of them showed fibrosis (data not shown). Thus, the additional detection of M30 allowed the identification of NASH in 70% of NAFLD patients with low or indeterminate NFS (42/60). Eighty-six percent (36/42) of the patients with NASH identified in this way revealed fibrosis, with ≥F2 stages in more than half of the cases. In patients with an NFS < −1.455, M30 levels correctly predicted NASH with a sensitivity of 79% and a PPV of 72%.
Validation of the M30 marker for NASH detection in NAFLD patients with different liver stiffness
We also validated the suitability of M30 for NASH detection in NAFLD patients with low TE values (<7.9/7.2 kPa for M/XL probe; Figure 7a). Most (25/36) of these patients revealed elevated M30 levels, and in 72% of them (18/25) NASH was detected. Eighty-three percent of the NASH patients with elevated M30 but low TE values (15/18) had developed fibrosis (F1 = 5, F2 = 9, F3 = 1). Similarly, 64% of patients with indeterminate NFS and low TE values revealed elevated M30 levels, and most of them had NASH with fibrosis ≥F2 (data not shown).
Figure 7.
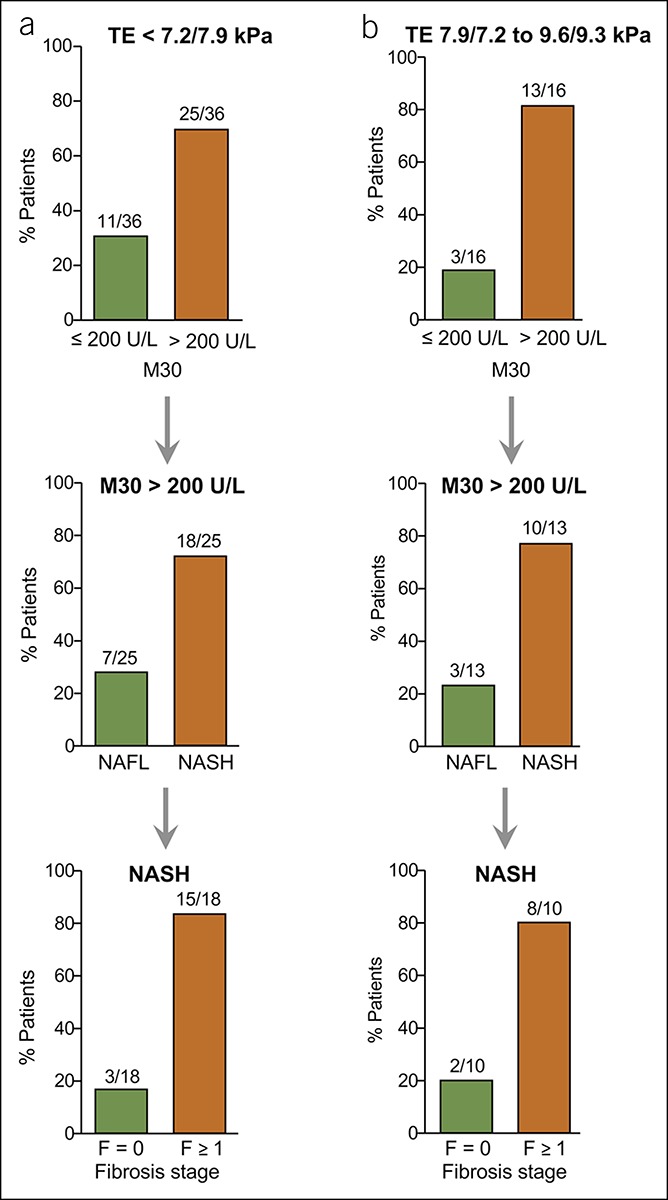
Validation of the M30 marker for its utility to detect NASH in NAFLD patients with low or intermediate TE values. (a) Most NAFLD patients with low TE values (<7.2 kPa or < 7.9 kPa detected by FibroScan with XL or M probe) but elevated M30 levels (>200 U/L) revealed histological NASH with fibrosis in the validation cohort. (b) NASH could also be detected in most NAFLD patients with intermediate (7.9/7.2–9.6/9.3 kPa for M/XL probe) TE values and enhanced M30 levels, and most of them revealed fibrosis. NAFLD, nonalcoholic fatty liver disease; NASH, nonalcoholic steatohepatitis; TE, transient elastography.
In patients with intermediate TE values (7.9/7.2–9.6/9.3 kPa for M/XL probe; Figure 7b), elevated M30 levels were detected in 13/16 cases (81%). Those patients mostly revealed NASH (10/13), and most of them had developed fibrosis (F1 = 5, F2 = 1, F3 = 2). From the NAFLD patients with high TE values (>9.6/9.3 kPa), 83% had elevated M30 levels (19/23), and 79% from those had NASH (data not shown). Almost all (14/15) patients with NASH identified by this approach showed fibrosis (F1 = 4, F2 = 4, F3 = 4, F4 = 2). Thus, NASH was detected by elevated M30 levels in 74% of patients with low or intermediate liver stiffness (28/38), and 82% of them (23/28) had developed fibrosis (≥F2 in 57% of cases). In NAFLD patients with low TE values, the M30 marker detected NASH with a sensitivity of 75% and a PPV of 72%.
Diagnostic performance of M30 for NASH detection in NAFLD patients with low NFS or TE values in the overall cohort
When both the exploration and validation cohorts were considered together, the M30 marker revealed a sensitivity of 74% and a PPV of 77%, whereas the negative predictive value was 53% for NASH detection in patients with low NFS or TE values. Thus, most (77%) of the NAFLD patients with elevated M30 levels revealed already NASH (75/97), despite low NFS or TE values. In contrast, 29/55 patients with M30 levels ≤ 200 U/L revealed simple NAFL but not NASH. From the remaining patients (26/55), who revealed NASH despite M30 levels ≤ 200 U/L (putative “false-negative” patients), most (88%) had not really progressed and showed no or only minimal F1 fibrosis. These results demonstrate that the combination of the M30 marker with NFS or TE enables a more reliable and accurate identification of patients with an increased risk of progressed NAFLD.
DISCUSSION
NAFLD is a common liver disease with a global prevalence of ∼25%, from which 20%–60% develop NASH (1,36). In natural history studies, fibrosis remains the most important factor contributing to liver-related but also to general mortality in NAFLD (4–6). Identification of NAFLD patients who are at risk of NASH and fibrosis is therefore crucial. Liver biopsy is the gold standard, but it is associated with sampling errors and the risk of complications. It is also unrealistic to perform liver biopsy in 25% of the population. Novel surveillance strategies are thus required for noninvasive risk stratification in NAFLD. The NFS was suggested as an initial approach to identify NAFLD patients without enhanced risk of progressed disease (8,34). According to this algorithm, patients can be noninvasively monitored for disease progression in case of a low NFS of <−1.455.
In this study, we included the M30 marker in the diagnostic algorithm and found that most NAFLD patients with low NFS already revealed elevated M30 levels. Moreover, most of those patients (83% in the exploration and 72% in the validation cohort) showed NASH in liver histology. In most patients with NASH identified in this way, fibrosis was detected, with stages ≥F2 in 32% (exploration cohort) and 48% (validation cohort) of cases. Vice versa, more than 50% of patients with low NFS and nonelevated M30 levels had no evidence of NASH, and most false-negative patients lacked histological signs of fibrosis. Those patients with NAFL and low NFS despite elevated M30 levels showed mostly histological inflammation or ballooning. Increasing evidence reveals that steatosis with mild inflammation can progress to more severe disease, albeit to a lower rate than definite NASH (37,38). Moreover, ballooning is closely associated with fibrosis progression (39). Identification of those patients might therefore also be of diagnostic relevance.
We obtained similar results when we used TE instead of NFS as an initial diagnostic step. Most NAFLD patients with low TE values had also elevated M30 levels. Most of them, i.e., 80% in the exploration and 72% in the validation cohort, revealed NASH, from whom ∼50% had already developed fibrosis stages ≥F2. Vice versa, most patients with NASH despite low TE and M30 values lacked histological evidence of fibrosis. Overall, in both cohorts, NASH could be predicted by elevated M30 levels in 79% of patients with low or indeterminate NFS and in 77% of patients with low or intermediate TE values. Importantly, most of those patients would not be considered for liver biopsy. Recent studies confirmed that the NFS is not as robust in predicting advanced fibrosis and remains associated with high false-negative values (10,19). Thus, the additional detection of M30 in cases of low or indeterminate/intermediate NFS or TE values strongly improves the identification of patients with progressive NAFLD.
In line with our study, M30 levels have been found to correlate with NASH features, i.e., lobular inflammation and hepatocellular ballooning (29,31,32), which are both related to NAFLD progression (37–39). Moreover, in clinical trials, M30 levels significantly declined in patients who responded to a therapy with NASH resolution compared with nonresponders (40). Further studies with paired biopsies showed that M30 levels decrease with improvement but increase with worsening of the NAS, underscoring the suitability of the M30 marker for monitoring NAFLD activity (32,33).
NAFLD activity factors such as inflammation and ballooning are associated with fibrosis development and progression (37–39). Inflammation triggers monocyte recruitment and hepatocyte apoptosis, which contribute to stellate cell activation and fibrogenesis (41–44). Vice versa, attenuation of hepatocyte apoptosis was shown to reduce liver injury and fibrosis in experimental NASH (45). There is evidence that M30 levels correlate with liver fibrosis in chronic liver diseases (25,27,31,46). In our cohorts, a significant proportion of NASH patients with low or indeterminate NFS or with low or intermediate TE values but elevated M30 levels had already developed fibrosis. Thus, M30 detection in this situation might be of additional value to identify not only patients with NASH but also patients with fibrosis that escaped detection by NFS or TE.
Although NFS and TE can exclude advanced fibrosis, they are less sensitive for detecting lower fibrosis stages (16,17,47,48). Up to 58% of patients show an indeterminate NFS, and other models revealed a better diagnostic performance for the detection of NASH and advanced fibrosis in diabetic NAFLD patients (18,49). In our cohort including mostly nondiabetic patients, we found a high PPV of M30 for NASH detection in NAFLD patients with low NFS or TE values. M30 levels revealed a higher PPV for NASH detection in those patients compared with ALT levels, which concurs with previous observations that M30 has a higher diagnostic accuracy than ALT for NASH detection (25).
A limitation of our study could be that patients were recruited in tertiary centers where the probability of progressed NAFLD is higher than in the community. However, although a higher proportion of patients with diabetes, a risk factor for NAFLD progression, and significant fibrosis were present in the validation compared with the exploration cohort, the M30 marker revealed a similar diagnostic performance for the identification of high-risk NAFLD patients with low NFS or TE values.
In summary, our algorithm accurately identified >70% of NASH patients in the multicenter NAFLD cohorts with low NFS or TE values. Inclusion of M30 in the diagnostic algorithm of patients with suspected NAFLD might be helpful for decision making which patient should be referred to a hepatologist and considered for liver biopsy. Further large-cohort studies should evaluate the suitability of the M30 marker in combination with noninvasive procedures for risk stratification of NAFLD patients.
CONFLICTS OF INTEREST
Guarantor of the article: Heike Bantel, MD.
Specific author contributions: Stephanie Liebig and Neele Stoeckmann contributed equally to this work. Study concept and design and drafting of the manuscript: H.B., K.S.-O., E.J., J.M.S., M.J.B., and A.G. Data acquisition and analyses and interpretation: N.S., M.R., and S.L. Study supervision: H.B. and M.P.M.
Financial support: This study was supported by the Deutsche Forschungsgemeinschaft (SFB/TR 209 and BA 2092/11-1).
Potential competing interests: None.
Study Highlights.
WHAT IS KNOWN
✓ NAFLD can progress from simple steatosis to NASH with associated complications including fibrosis and cirrhosis.
✓ The NFS and TE are recommended as initial step to exclude progressed fibrosis in NAFLD.
✓ Identification of NAFLD patients at earlier disease stages is, however, also important because those patients have an increased risk of disease progression and mortality.
WHAT IS NEW HERE
✓ To improve the noninvasive risk stratification of NAFLD patients we combined NFS and TE with the apoptosis biomarker M30.
✓ In patients with low NFS or TE values who would normally not be considered for liver biopsy, serum measurements of M30 allowed the detection of fibrotic NASH in more than 70% of cases.
✓ NASH was firmly detected in most patients with indeterminate NFS and elevated M30 levels, and most of them revealed significant fibrosis.
TRANSLATIONAL IMPACT
✓ The combination of NFS or TE with the M30 marker is a reliable approach to identify NASH and fibrosis and can guide clinical decisions and the selection of patients requiring liver biopsy.
REFERENCES
- 1.Younossi ZM, Koenig AB, Abdelatif D, et al. Global epidemiology of nonalcoholic fatty liver disease-Meta-analytic assessment of prevalence, incidence, and outcomes. Hepatology 2016;64:73–84. [DOI] [PubMed] [Google Scholar]
- 2.Chalasani N, Younossi Z, Lavine JE, et al. The diagnosis and management of nonalcoholic fatty liver disease: Practice guidance from the American Association for the Study of Liver Diseases. Hepatology 2018;67:328–57. [DOI] [PubMed] [Google Scholar]
- 3.Ong JP, Pitts A, Younossi ZM. Increased overall mortality and liver-related mortality in non-alcoholic fatty liver disease. J Hepatol 2008;49:608–12. [DOI] [PubMed] [Google Scholar]
- 4.Ekstedt M, Hagström H, Nasr P, et al. Fibrosis stage is the strongest predictor for disease-specific mortality in NAFLD after up to 33 years of follow-up. Hepatology 2015;61:1547–54. [DOI] [PubMed] [Google Scholar]
- 5.Angulo P, Kleiner DE, Dam-Larsen S, et al. Liver fibrosis, but No other histologic features, is associated with long-term outcomes of patients with nonalcoholic fatty liver disease. Gastroenterology 2015;149:389–97. [DOI] [PMC free article] [PubMed] [Google Scholar]
- 6.Dulai PS, Singh S, Patel J, et al. Increased risk of mortality by fibrosis stage in nonalcoholic fatty liver disease: Systematic review and meta-analysis. Hepatology 2017;65:1557–65. [DOI] [PMC free article] [PubMed] [Google Scholar]
- 7.Rockey DC, Caldwell SH, Goodman ZD, et al. American association for the study of liver diseases: Liver biopsy. Hepatology 2009;49:1017–44. [DOI] [PubMed] [Google Scholar]
- 8.Roeb E, Steffen HM, Bantel H, et al. S2K guideline non-alcoholic fatty liver disease. Z Gastroenterol 2015;53:668–723. [DOI] [PubMed] [Google Scholar]
- 9.European Association for the Study of the Liver (EASL); European Association for the Study of Diabetes (EASD); European Association for the Study of Obesity (EASO). EASL-EASD-EASO Clinical Practice Guidelines for the management of non-alcoholic fatty liver disease. J Hepatol 2016;64:1388–402. [DOI] [PubMed] [Google Scholar]
- 10.Younossi ZM, Loomba R, Anstee QM, et al. Diagnostic modalities for non-alcoholic fatty liver disease (NAFLD), non-alcoholic steatohepatitis (NASH) and associated fibrosis. Hepatology 2018;68:349–60. [DOI] [PMC free article] [PubMed] [Google Scholar]
- 11.Sandrin L, Fourquet B, Hasquenoph JM, et al. Transient elastography: A new noninvasive method for assessment of hepatic fibrosis. Ultrasound Med Biol 2003;29:1705–13. [DOI] [PubMed] [Google Scholar]
- 12.Castéra L, Foucher J, Bernard PH, et al. Pitfalls of liver stiffness measurement: A 5-year prospective study of 13,369 examinations. Hepatology 2010;51:828–35. [DOI] [PubMed] [Google Scholar]
- 13.Myers RP, Pomier-Layrargues G, Kirsch R, et al. Feasibility and diagnostic performance of the FibroScan XL probe for liver stiffness measurement in overweight and obese patients. Hepatology 2012;55:199–208. [DOI] [PubMed] [Google Scholar]
- 14.Wong VW, Vergniol J, Wong GL, et al. Liver stiffness measurement using XL probe in patients with nonalcoholic fatty liver disease. Am J Gastroenterol 2012;107:1862–71. [DOI] [PubMed] [Google Scholar]
- 15.Vuppalanchi R, Siddiqui MS, Van Natta ML, et al. Performance characteristics of vibration-controlled transient elastography for evaluation of nonalcoholic fatty liver disease. Hepatology 2018;67:134–44. [DOI] [PMC free article] [PubMed] [Google Scholar]
- 16.Wong VW, Vergniol J, Wong GL, et al. Diagnosis of fibrosis and cirrhosis using liver stiffness measurement in nonalcoholic fatty liver disease. Hepatology 2010;51:454–62. [DOI] [PubMed] [Google Scholar]
- 17.Angulo P, Hui JM, Marchesini G, et al. The NAFLD fibrosis score: A noninvasive system that identifies liver fibrosis in patients with NAFLD. Hepatology 2007;45:846–54. [DOI] [PubMed] [Google Scholar]
- 18.Musso G, Gambino R, Cassader M, et al. Meta-analysis: Natural history of non-alcoholic fatty liver disease (NAFLD) and diagnostic accuracy of non-invasive tests for liver disease severity. Ann Med 2011;43:617–49. [DOI] [PubMed] [Google Scholar]
- 19.Petta S, Vanni E, Bugianesi E, et al. The combination of liver stiffness measurement and NAFLD fibrosis score improves the noninvasive diagnostic accuracy for severe liver fibrosis in patients with nonalcoholic fatty liver disease. Liver Int 2015;35:1566–73. [DOI] [PubMed] [Google Scholar]
- 20.Feldstein AE, Canbay A, Angulo P, et al. Hepatocyte apoptosis and fas expression are prominent features of human nonalcoholic steatohepatitis. Gastroenterology 2003;125:437–43. [DOI] [PubMed] [Google Scholar]
- 21.Ku NO, Strnad P, Bantel H, et al. Keratins: Biomarkers and modulators of apoptotic and necrotic cell death in the liver. Hepatology 2016;64:966–76. [DOI] [PMC free article] [PubMed] [Google Scholar]
- 22.Leers MP, Kölgen W, Björklund V, et al. Immunocytochemical detection and mapping of a cytokeratin 18 neo-epitope exposed during early apoptosis. J Pathol 1999;187:567–72. [DOI] [PubMed] [Google Scholar]
- 23.Bantel H, Ruck P, Schulze-Osthoff K. In situ monitoring of caspase activation in hepatobiliary diseases. Cell Death Differ 2000;7:504–5. [DOI] [PubMed] [Google Scholar]
- 24.Bantel H, Lügering A, Heidemann J, et al. Detection of apoptotic caspase activation in sera from patients with chronic HCV infection is associated with fibrotic liver injury. Hepatology 2004;40:1078–87. [DOI] [PubMed] [Google Scholar]
- 25.Feldstein AE, Wieckowska A, Lopez AR, et al. Cytokeratin-18 fragment levels as noninvasive biomarkers for nonalcoholic steatohepatitis: A multicenter validation study. Hepatology 2009;50:1072–8. [DOI] [PMC free article] [PubMed] [Google Scholar]
- 26.Bantel H, John K, Schulze-Osthoff K. Robust detection of liver steatosis and staging of NAFLD by an improved ELISA for serum cytokeratin-18 fragments. Am J Gastroenterol 2014;109:140–1. [DOI] [PubMed] [Google Scholar]
- 27.Joka D, Wahl K, Moeller S, et al. Prospective biopsy-controlled evaluation of cell death biomarkers for prediction of liver fibrosis and nonalcoholic steatohepatitis. Hepatology 2012;55:455–64. [DOI] [PubMed] [Google Scholar]
- 28.Bechmann LP, Kocabayoglu P, Sowa JP, et al. Free fatty acids repress small heterodimer partner (SHP) activation and adiponectin counteracts bile acid-induced liver injury in superobese patients with nonalcoholic steatohepatitis. Hepatology 2013;57:1394–406. [DOI] [PubMed] [Google Scholar]
- 29.Diab DL, Yerian L, Schauer P, et al. Cytokeratin 18 fragment levels as a noninvasive biomarker for nonalcoholic steatohepatitis in bariatric surgery patients. Clin Gastroenterol Hepatol 2008;6:1249–54. [DOI] [PMC free article] [PubMed] [Google Scholar]
- 30.Kleiner DE, Brunt EM, Van Natta M, et al. Design and validation of a histological scoring system for nonalcoholic fatty liver disease. Hepatology 2005;41:1313–21. [DOI] [PubMed] [Google Scholar]
- 31.Tamimi TI, Elgouhari HM, Alkhouri N, et al. An apoptosis panel for nonalcoholic steatohepatitis diagnosis. J Hepatol 2011;54:1224–9. [DOI] [PMC free article] [PubMed] [Google Scholar]
- 32.Tsutsui M, Tanaka N, Kawakubo M, et al. Serum fragmented cytokeratin 18 levels reflect the histologic activity score of nonalcoholic fatty liver disease more accurately than serum alanine aminotransferase levels. J Clin Gastroenterol 2010;44:440–7. [DOI] [PubMed] [Google Scholar]
- 33.Shen J, Chan HL, Wong GL, et al. Assessment of non-alcoholic fatty liver disease using serum total cell death and apoptosis markers. Aliment Pharmacol Ther 2012;36:1057–66. [DOI] [PubMed] [Google Scholar]
- 34.Castera L, Vilgrain V, Angulo P. Noninvasive evaluation of NAFLD. Nat Rev Gastroenterol Hepatol 2013;10:666–75. [DOI] [PubMed] [Google Scholar]
- 35.Festi D, Schiumerini R, Marzi L, et al. Review article: The diagnosis of non-alcoholic fatty liver disease—Availability and accuracy of non-invasive methods. Aliment Pharmacol Ther 2013;37:392–400. [DOI] [PubMed] [Google Scholar]
- 36.Diehl AM, Day C. Cause, pathogenesis, and treatment of nonalcoholic steatohepatitis. N Engl J Med 2017;377:2063–72. [DOI] [PubMed] [Google Scholar]
- 37.Pais R, Charlotte F, Fedchuk L, et al. A systematic review of follow-up biopsies reveals disease progression in patients with non-alcoholic fatty liver. J Hepatol 2013;59:550–6. [DOI] [PubMed] [Google Scholar]
- 38.McPherson S, Hardy T, Henderson E, et al. Evidence of NAFLD progression from steatosis to fibrosing-steatohepatitis using paired biopsies: Implications for prognosis and clinical management. J Hepatol 2015;62:1148–55. [DOI] [PubMed] [Google Scholar]
- 39.Gramlich T, Kleiner DE, McCullough AJ, et al. Pathologic features associated with fibrosis in nonalcoholic fatty liver disease. Hum Pathol 2004;35:196–9. [DOI] [PubMed] [Google Scholar]
- 40.Vuppalanchi R, Jain AK, Deppe R, et al. Relationship between changes in serum levels of keratin 18 and changes in liver histology in children and adults with nonalcoholic fatty liver disease. Clin Gastroenterol Hepatol 2014;12:2121–2. [DOI] [PMC free article] [PubMed] [Google Scholar]
- 41.Guicciardi ME, Gores GJ. Apoptosis as a mechanism for liver disease progression. Semin Liver Dis 2010;30:402–10. [DOI] [PMC free article] [PubMed] [Google Scholar]
- 42.Krenkel O, Puengel T, Govaere O, et al. Therapeutic inhibition of inflammatory monocyte recruitment reduces steatohepatitis and liver fibrosis. Hepatology 2018;67:1270–83. [DOI] [PubMed] [Google Scholar]
- 43.Marra F, Tacke F. Roles for chemokines in liver disease. Gastroenterology 2014;147:577–94. [DOI] [PubMed] [Google Scholar]
- 44.Canbay A, Taimr P, Torok N, et al. Apoptotic body engulfment by a human stellate cell line is profibrogenic. Lab Invest 2003;83:655–63. [DOI] [PubMed] [Google Scholar]
- 45.Barreyro FJ, Holod S, Finocchietto PV, et al. The pan-caspase inhibitor Emricasan (IDN-6556) decreases liver injury and fibrosis in a murine model of non-alcoholic steatohepatitis. Liver Int 2015;35:953–66. [DOI] [PubMed] [Google Scholar]
- 46.Jazwinski AB, Thompson AJ, Clark PJ, et al. Elevated serum CK18 levels in chronic hepatitis C patients are associated with advanced fibrosis but not steatosis. J Viral Hepat 2012;19:278–82. [DOI] [PMC free article] [PubMed] [Google Scholar]
- 47.Siddiqui MS, Vuppalanchi R, Van Natta ML, et al. Vibration-controlled transient elastography to assess fibrosis and steatosis in patients with nonalcoholic fatty liver disease. Clin Gastroenterol Hepatol 2019;17:156–63. [DOI] [PMC free article] [PubMed] [Google Scholar]
- 48.Labenz C, Huber Y, Kalliga E, et al. Predictors of advanced fibrosis in non-cirrhotic non-alcoholic fatty liver disease in Germany. Aliment Pharmacol Ther 2018;48:1109–16. [DOI] [PubMed] [Google Scholar]
- 49.Bazick J, Donithan M, Neuschwander-Tetri BA, et al. Clinical model for NASH and advanced fibrosis in adult patients with diabetes and NAFLD: Guidelines for referral in NAFLD. Diabetes Care 2015;38:1347–55. [DOI] [PMC free article] [PubMed] [Google Scholar]


