

Supplemental Digital Content is available in the text
Keywords: 16S rRNA gene sequencing, gastric cancer, gut microbiota shifts, surgical patients
Abstract
Gastric cancer (GC) is one of the common malignant tumors in China, with a high morbidity and mortality. With the development and application of high-throughput sequencing technologies and metagenomics, a great quantity of studies have shown that gastrointestinal microbiota is closely related to digestive system diseases. Although some studies have reported the effect of long-term follow-up after subtotal gastrectomy on intestinal flora changes in patients with GC. However, the features of gut microbiota and their shifts in patients with GC in perioperative period remain unclear.
This study was designed to characterize fecal microbiota shifts of the patients with GC before and after the radical distal gastrectomy (RDG) during their hospital staying periods. Furthermore, fecal microbiota was also compared between the GC patients and healthy individuals.
Patients who were diagnosed with advanced gastric adenocarcinoma at distal stomach were enrolled in the study. The bacterial burden within fecal samples was determined using quantitative polymerase chain reaction. To analyze the diversity and composition of gut microbiota from fecal DNA of 20 GC patients and 22 healthy controls, amplicons of the 16S rRNA gene from all subjects were pyrosequenced. To study gut microbiota shifts, the fecal microbiota from 6 GC patients before and after RDG was detected and subsequently analyzed. Short-chain fatty acids were also detected by chromatography spectrometer in these 6 GC patients.
RDG had a moderate effect on bacterial richness and evenness, but had pronounced effects on the composition of postoperative gut microbiota compared with preoperative group. The relative abundances of genera Akkermansia, Esherichia/Shigella, Lactobacillus, and Dialister were significant changed in perioperative period. Remarkably, higher abundances of Escherichia/Shigella, Veillonella, and Clostridium XVIII and lower abundances of Bacteroides were observed in gut microbiota of overall GC patients compared to healthy controls.
This study is the first study to characterize the altered gut microbiota within fecal samples from GC patients during perioperative period, and provide a new insights on such microbial perturbations as a potential effector of perioperative period phenotype. Further research must validate these discoveries and may evaluate targeted microbiota shifts to improve outcomes in GC patients.
1. Introduction
Gastric cancer (GC) is a global health issue and is the second most common cause of cancer-related deaths in China.[1] Surgical excision including proximal, distal, and total gastrectomy with extended lymph node dissection is the leading curative treatment for GC by now. Radical distal gastrectomy (RDG), a standard surgical treatment for middle or lower-third GC, was identified to have better outcomes as compared with total gastretomy.[2]
The human gastrointestinal (GI) tract harbors as many as 1014 microorganisms.[3] These organisms play numerous beneficial roles, including immune system maturation, protection against pathogens, the digestion of complex carbohydrates, and the degradation of toxic substances. As part of the human GI tract, phyla Proteobacteria, Firmicutes, Bacteroidetes, Fusobacteria, and Actinobacteria are predominant in gastric microbiota, although there is considerable variation in the most abundant bacteria between individuals.[4,5]
Mounting evidence from clinical studies has shown major changes in human microbiota after cancer surgery,[6–8] while these shifts were not consistent between studies. This is likely due to differences in objects and samples. Fecal specimens represent an accessible source for investigating the gut microbiota. Culture-derived based approach fail to identify the majority of microbial structure and diversity from stool samples.[9] Rapid and reliable gut microbiome analysis with next generation sequencing has been allowed by technical progress of the last decades. Studies based on 16S rRNA gene sequence analysis in stool samples have revealed enrichment and depletion of certain bacterial taxa after surgery in patients with colorectal cancer.[8,10]
Although effects of gastrectomy (mainly bariatric surgery) on gut microbiota,[11,12] and gastric microbiota alteration in GC patients after subtotal gastrectomy with long-term follow-up were reported.[7] However, gut microbiota changes in patients with GC in perioperative period are not completely understood. The clinic exposure, including antibiotics, dietary, anxiety, and nosocomial pathogens may influence the gut microbiota during perioperative period. In the case of GC patients, the gut microbiota may be further impacted by digestive reconstruction and tumor burden reduction.
The perioperative timeframe is regarded as a window of opportunity for determining long term cancer outcomes. Gut microbiota is related not only to the carcinogenesis of GI tract cancer but also to chemotherapeutic responsiveness postoperative outcomes.[8,13] Moreover, tissue samples are generally inaccessible after surgery in short term. Thus, whether noninvasive fecal samples can be a “barometer” for the gut microbiota of GC patients during perioperative period?
The major aim of this study was designed to characterize the gut microbiota shifts of the GC patients undergoing RDG. In an attempt to provide a normative reference, composition and diversity of gut microbiota were also compared between the GC patients and healthy controls (HCs). Confirming past studies,[14] Short-chain fatty acids (SCFAs) are key end-productions of bacterial fermentation and serve as a primary metabolic substrate for colonocytes. In order to understand how the microbiome shifts may affect nutrition, SCFA was also assessed before and after RDG. This study may provide clues for further strategies to improve postoperative outcomes, may include interventions to modify the microbiota, dietary modification or fecal transplantation.
2. Materials and methods
2.1. Study population
The study was carried out on fecal samples collected from 20 GC patients. The average age of the patients was 52.3 ± 11.2 years. All participants were selected from among those who underwent endoscopy in our hospital from September 2017 to July 2018. A written informed consent was obtained from all the participants and the study protocol was approved by the Ethical Committee of the First Affiliated Hospital of Zhejiang University (Zhejiang China). To minimize the potential influence on the microbiota, all patients enrolled had not received antibiotics, H2 receptor antagonists, proton pump inhibitors and probiotics 1 month before sample collection. Patients who had received radiotherapy, chemotherapy, or/and prior surgery were excluded. Those with endoscopic findings of peptic ulcer, tumor rupture, and hemorrhage, or pyloric obstruction were excluded from this study. For the enrollment of patients with GC, only those with an endoscopic finding of noncardia cancer were included. Histologically, these 20 GC cases consisted of 13 intestinal-type and 7 diffuse-type cancer.
22 HCs with a mean age of 53.4 years were recruited from the Department of Health Examination Center, First Affiliated Hospital of Zhejiang University. These participants were enrolled as HCs and received no antibiotics for 4 weeks before the study. After having written informed consent, HCs were asked to provide fecal samples to us. Moreover, GC patients and HCs were of Chinese origin.
2.2. Stool sample collection
Twenty GC patients and 22 HCs participated in the study provided stool samples at the last week before the operation in hospital. Postoperatively, stools were collected immediately after evacuation beginning 7 days or more. At the end of collection, a total of 48 fecal samples (22 from HCs, 20 from GC patients before surgery, and 6 from GC patients after surgery) were harvested from GC patients and HCs. Fecal samples were collected in sterile bowls, 1 spoon of stool specimen was transferred to the container, and immediately taken to laboratory, followed by immediate freezing at −80°C until DNA extraction.
2.3. DNA extraction
Totally, fecal samples, consisting of 200 mg, were collected from all subjects. Microbial DNA from the fecal samples was extracted by E.Z.N.A Stool DNA Kit (Omega, Norcross, GA) according to the manufacturer's instruction. Briefly, the fecal pellets were first homogenized in lysis buffer and nucleic acids were precipitated with isopropanol. The extracted DNA was quantified by the NanoDrop 2000UV-vis spectrophotometer (Thermo Scientific, Wilmington), and the integrity of the extracted DNA from fecal samples was checked using agarose gel electrophoresis. The extracted DNA was stored at −20°C.
2.4. High-throughput sequencing and bioinformatics analyses
The extracted microbial DNA was processed through polymerase chain reaction (PCR) amplification, purification, and recovery, then quantified by the Qubit 2.0 DNA Assay Kit (Thermo Scientific), followed the same volume of 1:1 mixed for sequencing. The original image file from Illumina Miseq was converted into the original reads by CASAVA base-recognition analysis. Each sample was identified and distinguished according to the barcode-labelled sequence. During the PCR reaction, some chimeras were basically generated due to incomplete extension and also produced some non-specific amplification. Hence, USEARCH Version 8.1 (http://www.drive5.com/) was used to remove non-amplified sequences, followed by error correction, whereas UCHIME Version 4.2 (http://www.drive5.com/) was used to detect chimeras.[15] Subsequently, the chimera-deleted sequences were basic local alignment search tool aligned with representative sequences form database. The sequences based on the distance had a clustering structure, so they could be divided into an operational taxonomic unit (OTU) according to the 97% similarities. According to Bergey's taxonomy, the result was performed with USEARCH into an OUT table, which was used for downstream analysis.[16]
2.5. Determination of SCFA in stool
SCFAs concentration in stool was measured by gas chromatography spectrometer (GCS) (7890B Plus GC System, Agilent, California). Briefly, 100 mg of dry fecal sample was put in a 10 mL centrifuge tube and gently suspended in 1.6 mL deionized water. 0.4 mL 50% H2SO4 and 2 mL diethyl ether were then mixed with an orbital shaker for 45 minutes before centrifuging at 3000 rpm for 5 minutes at room temperature. 10 mg anhydrous CaCl2 was added to remove residual water for collecting supernatant. Finally, 2 μL supernatant was analyzed by injection in the GCS. Gas chromatography analysis was carried out using Agilent 7890B GCS fitted with a flame ionization detector (FID). GCS column (ZB-FFAP, Phenomenex, California) of 30 m × 0.32 mm × 0.25 μm was used. Nitrogen was supplied as the carrier gas at a flow rate of 1.69 mL/min in non-split mode (injector temperature at 250°C). The initial oven temperature was 100°C for 2 minutes, and then rose at a rate of 8°C/min to 240°C before upholding there for 10 minutes. The temperatures of the FID and injection port were 350°C. SCFAs was quantified by an external standard method using the mix standard solution of acetic, propionic, butyric, and valeric acids.
2.6. Statistical analysis
Gut microbiota community diversity and richness were analyzed using the R Microbiome Package and R 3.4 software (https://www.r-project.org/),[17] including abundance-based coverage estimator (ACE), Chao1 estimator, Shannon, and Simpson indices. Beta diversity was estimated and visualized by principal component analysis (PCA) plots by QIIME Version 1.8 (http://qiime.org/install/index.html).[18] Linear discriminant analysis (LDA) effect size (LEfSe, with α = 0.05, Kruskal–Wallis and Wilcoxon tests; http://huttenhower.sph.harvard.edu/galaxy) was used to identify significant differences in relative abundances of gut microbiota. The LDA value threshold was set at 3.5. SPSS Version 21.0 (IBM, New York) and Prism Version 6.0 (GraphPad Software) was used for statistical analyses and graph production. The categorical data were compared by the Chi-square or Fisher exact test, and the continuous data were analyzed by Student t test or nonparametric rank test. The P-value of less than .05 was considered to be significant.
3. Results
3.1. Collection of 16S results
After quality control, an average 7892 sequences per barcoded sample was recovered for downstream analysis. The unique number of OTUs for samples from GC patients (GC group, n = 20) was 215, and 193 OTUs for HCs (HC group = 22). As shown in the rarefraction curves in Supplementary Figure S1A, the numbers of OTUs in the plot increased with the numbers of sequences with tends to reach the platform stage. This means that sequencing quantity for each sample was sufficient and reliable. The OTUs analysis showed a long tail in the rank abundance curves, indicating that the majority of OTUs were at low abundance, and all the OTUs were evenly distributed (Supplementary Fig. S1B).
3.2. Comparison of GC group with the HCs
3.2.1. Richness and diversity
Our study compared the gut microbiota richness and diversity between the GC group and HC group, and the ACE, Chao1 was significantly higher in GC group (Chao1, P = .0002; ACE, P = .002). Moreover, the Shannon and Simpson were calculated to estimate the ecological diversity from each groups (Fig. 1). The GC group had significantly lower Shannon index, in comparison with control group (P = .04). Compared with HC group, the Simpson index in the GC group showed a tendency to increase (P = .057).
Figure 1.
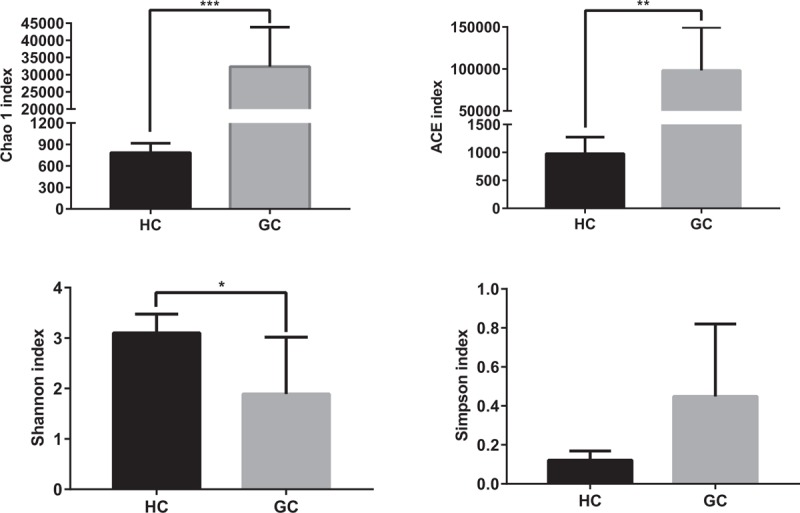
Richness and diversity of gut microbiota between GC patients and HCs. Richness and diversity calculated using phylotype relative abundance measurements between groups at the genus level. ∗ indicates P < .05 when compared with the HCs group. ∗∗ indicates P < .01. ∗∗∗ indicates P < .001. GC = gastric cancer patients group, HC = healthy controls group.
3.2.2. Phylum level
A taxonomy-based comparison was performed to determine the differences between the gut microbiota of GC group and HC group. At the phylum level, the intestinal micobiota was dominated by Proteobacteria, Firmicutes, Actinobacteria, Bacteroidetes, and Verrucomicrobia (Fig. 2A). Compared with HCs, GC group had mainly increased Proteobacteria and reduced Bacteroidetes (Proteobacteria for GC vs HC: 68.06% vs 20.18%, P < .05; Bacteroidetes: 0.24% vs 41.88%, P < .05).
Figure 2.
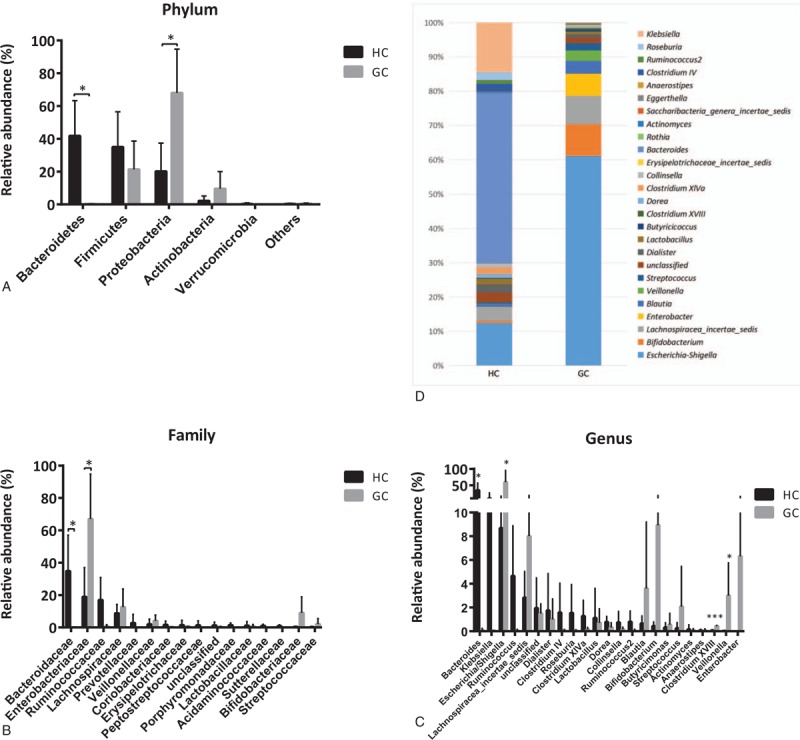
Comparision of gut microbiota between GC patients and HCs. Relative abundance of the compositional difference of dominant bacteria in GC patients and HCs at the phylum (A), family (B), and genus (C and D) level. ∗ indicates P < .05 when compared with the normal group. ∗∗ indicates P < .01. ∗∗∗ indicates P < .001. GC = gastric cancer patients group, HC = healthy controls group.
3.2.3. Class level
The gut microbiota class from 2 groups were separated into 9 known dominant classes including Bacteroidia, Clostridia, Gammaproteobacteria, Negativicutes, Actinobacteria, Bacilli, Erysipelotrichia, Betaproteobacteria, and Verrucomicrobiae (Supplementary Fig. S2A). The bacterial class Gammaproteobacteria, belonging to Proteobacteria, was significantly higher in the GC group compared with HC group (GC vs HC: 67.67% vs 18.97%, P < .05). Moreover, compared with HC group, the bacterial class Bacteroidia, was significantly lower in GC group (GC vs HC: 0.17% vs 41.82%, P < .05).
3.2.4. Order level
At the order level, the relative abundance of main gut microbiota in HC group and GC group is shown in Supplementary Figure S2B. A total of 12 dominant orders were observed in all samples. Among the abundant orders, Enterobacteriales was increased in the GC group, whereas Bacteroidales was decreased significantly in this group.
3.2.5. Family level
Bacterial communities were also compared at the family level. The abundances of Enterobaeteriaceae were found significantly higher in GC group than in controls. Bacteria belonging to family Bacteroidaceae were significantly lower in the group of GC group than in HC group. Relative abundance of major bacterial families in 2 groups is shown in Figure 2B.
3.2.6. Genus level
At the taxonomic level of genus, we found that GC group was markedly enriched with sequences from the genera Escherichia/Shigella, Veillonella, and Clostridium XVIII (Fig. 2C). Samples from HCs contained a higher abundance of Bacteroides than GC patients. (GC vs HC: 0.11% vs 34.88%, P < .05). It should be noted that the bacterial genus Helicobacter had extremely low abundance (<1%) in 2 groups (Fig. 2C and D).
3.3. Alterations of gut microbiota in perioperative period
3.3.1. Clinical intervention
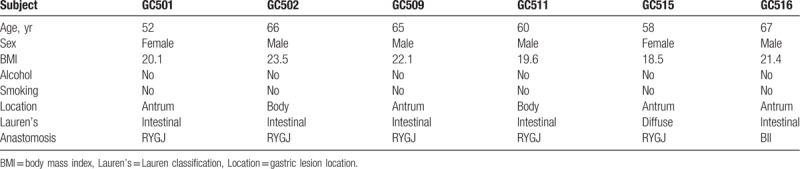
Six distal GC patients (characteristics of the patients are shown in Table 1) underwent RDG, which was defined as the surgical excision of the distal 50% to 60% stomach, then followed by reconstruction of digestive continuity. (Billroth II anastomosis, [BII] or Roux-en-Y gastrojejuno anastomosis [RYGJ]) GC patients received a clear-liquid diet for 1 or 2 days and broad-spectrum prophylactic antibiotics (most commonly Cefmetazole) before surgery and for 0 to 2 days postoperatively. Patients were allowed to resume their diet until 5 days after surgery.
Table 1.
Clinicopathological characteristics of the 6 patients.
3.3.2. Taxonomy composition of the samples
The intestinal microbiome from 6 GC patients has considerable individual variability before surgery (data not shown). In 2 groups, (GC group, preoperative samples from GC patients; HGC group, postoperative samples from GC patients) the microbial community fell into 6 bacterial phyla (Fig. 3A). Proteobacteria, Firmicutes, Verrucomicrobia, and Bacteroidetes were the most abundant phyla, and accounted for more than 95% of the fecal organisms. Three of the top 6 high abundance phyla were diminished in HGC group, including Proteobacteria (from 47% to 39.95%), Firmicutes (from 38.48% to 31.61%), and Actinobacteria (from 3.69% to 0.95%) (Fig. 3A). Three other phyla were increasing: Bacteroidetes (from 8.42% to 9.25%), Fusobacteria (from 0.17% to 2.78%), and Verrucomicrobia (from 2.15% to 15.37%) (Fig. 3A).
Figure 3.
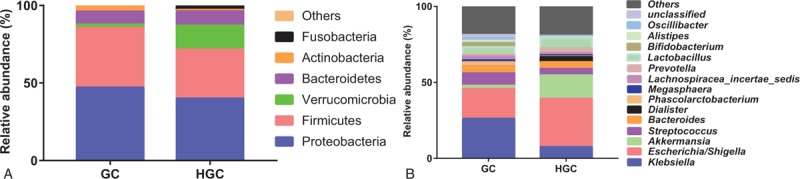
The composition of gut microbiota between GC group and HGC group. Bacterial relative abundance at the phylum (A), genus (B) level for HC group and GC group. GC = preoperative samples form GC patients, HGC = postoperative samples from GC patients.
At genus taxonomy level of 13 high-abundance genus, Escherichia/Shigella, Akkermansia, Dialister, and Prevotella revealed a strong tendency to increase (Fig. 3B). For another, Klebsiella, Streptococcus, Phascolarctobacteium, and Bifidobacterium showed a clear trends to decrease (Fig. 3B).
3.3.3. Effect of RDG on gut microbiota
To estimate the overall difference in fecal microbiota between GC group and HGC group, the alpha diversity and beta diversity were calculated. Compared with GC group, the richness and diversity index of HGC group demonstrated no statistically differences (Chao1, P = .87; ACE, P = .84; Shannon, P = 0.28; Simpson, P = 0.27) (Fig. 4A). However, the richness in HGC group was slightly higher than that in GC group. Samples from the HGC group revealed trends toward decreased Shannon index compared to the GC group (Fig. 4A). One unweighted UniFrac distances PCA plot (Fig. 4B) based on the relative genus-level abundance could not distinguish samples of HGC group from GC group significantly (P = .37). Notably, the gut microbiota from HGC samples tended to cluster together, whereas samples from GC group were scattered.
Figure 4.
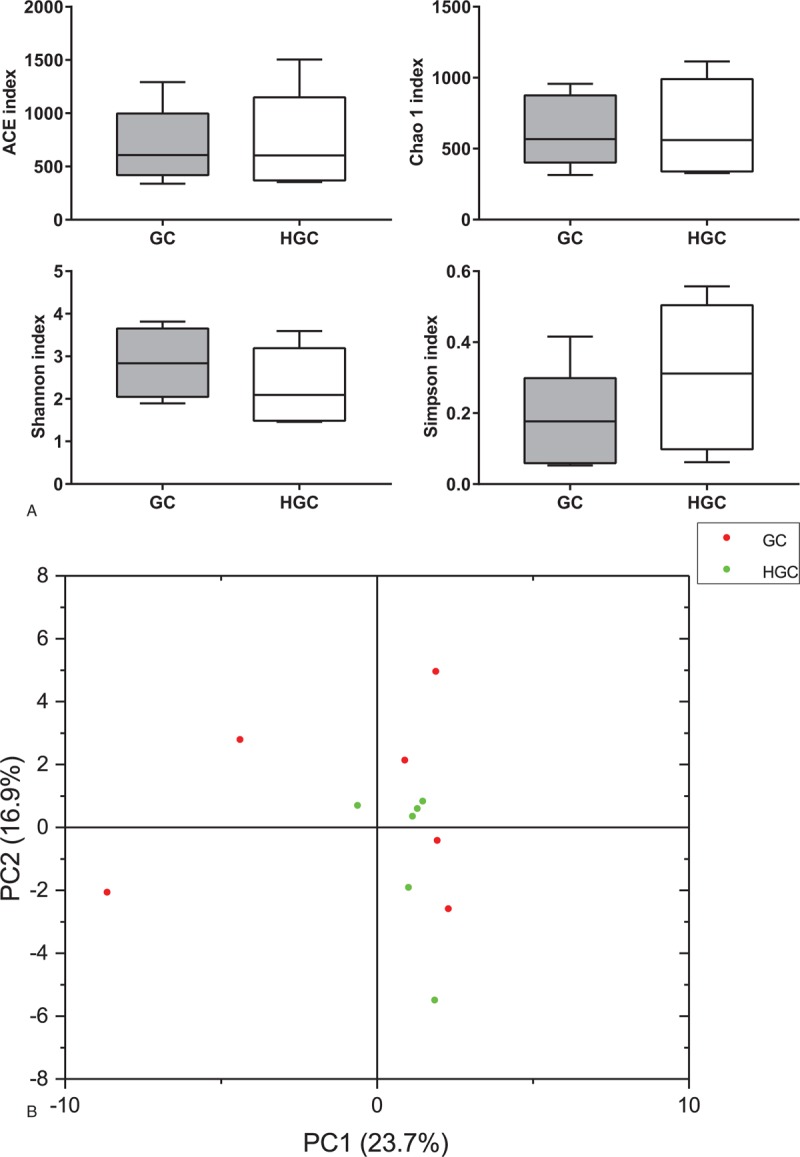
Overall difference in gut microbiota between GC group and HGC group. Box-plots of alpha diversity, and the line inside the box-plot indicates the median. Lines above and below the box represent the 10th and 90th percentiles, respectively (A); PCA of unweighted UniFrac distance as a measure of beta diversity across smples. Each point represents 1 sample. Samples in the same group are labeled the same color. The red dots and green dots denote samples from GC group and HGC group, respectively (B). GC = preoperative samples form GC patients, HGC = postoperative samples from GC patients.
The LEfSe with default parameters was used to identify the key phylotypes from phylum to genus responsible for the differences between the GC group and HGC group. LEfSe analysis further illustrated enrichment levels and variations (Fig. 5A and B). The HGC group were significantly enriched for phylum Verrucomicrobiae (genus Akkermansia) and genus Escherichia/Shigella, Lactobacillus, and Dialister. Whereas the GC group enriched for genus Klebsiella (belong to Proteobacteria).
Figure 5.
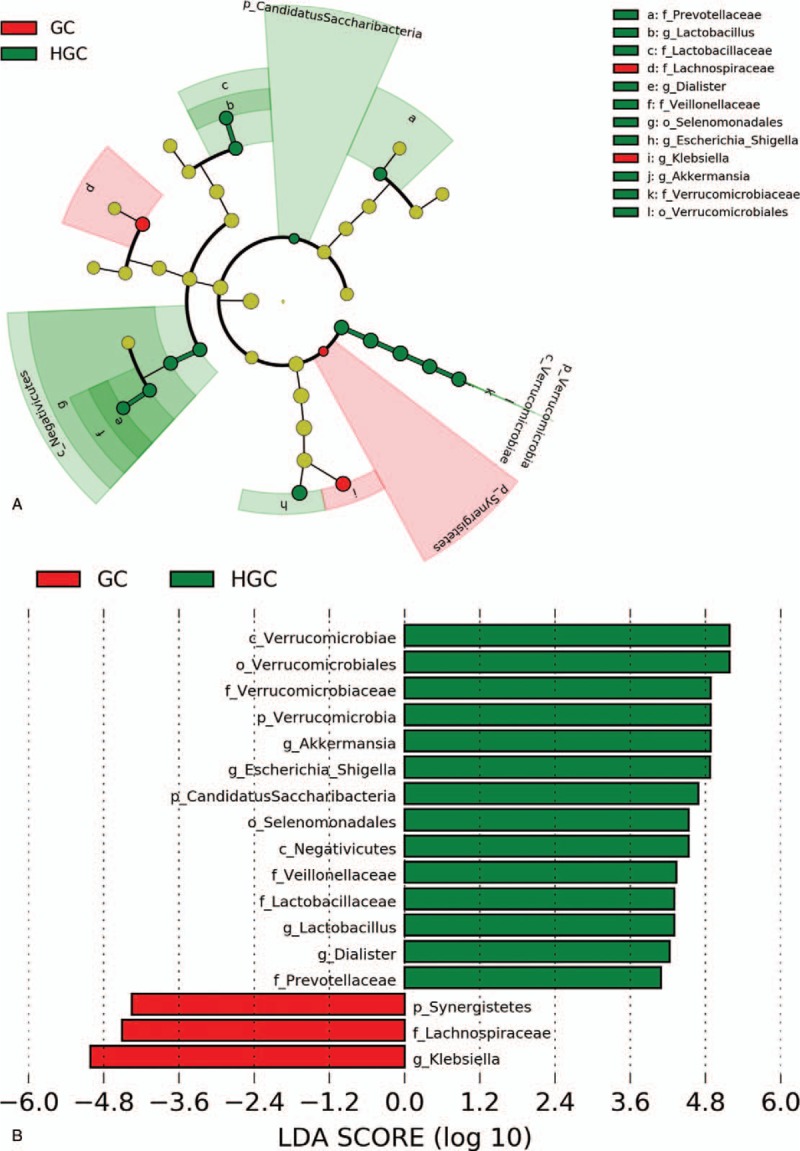
LEfSe analysis of enriched bacterial taxa in gut microbiota between GC group and HGC group. LEfSe-derived taxonomic cladogram (A); LDA score of enriched bacterial taxa (LDA >3.5 of LEfSe). Significantly enriched bacterial taxa in fecal samples from GC group and HGC group are indicated by different colors. Red bars indicate taxa enriched GC group, and green bars indicate taxa enriched HGC group (B). GC = preoperative samples form GC patients, HGC = postoperative samples from GC patients, LDA = linear discriminant analysis.
3.3.4. Alterations of fecal SCFAs
In our study, a significant decreased concentration of Valerate in the HGC group was observed (Fig. 6D) (P < .05). Although not significant, it is a remarkable fact that analogous trends in other beneficial SCFAs (ie, Acetate, Propionate, Butyrate) were also showed in Figure 6.
Figure 6.
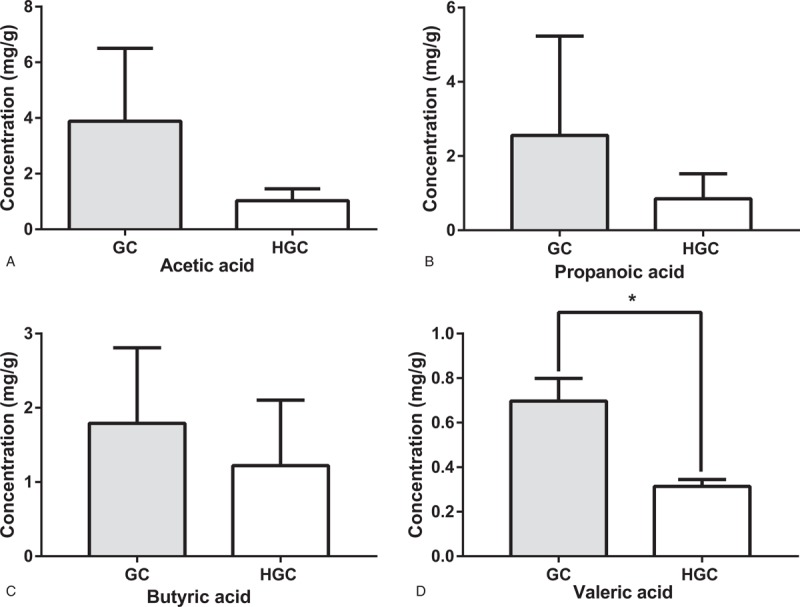
Comparision of fecal SCFA between GC group and HGC group. Concentration of fecal SCFAs, acetic acid (A), propionic acid (B), butyric acid (C) and valeric acid (D) for GC group and HGC group. ∗ indicates P < .05 when compared with the GC group. GC = preoperative samples form GC patients, HGC = postoperative samples from GC patients, SCFA = Short-chain fatty acid.
4. Discussions
Most studies of stomach microbiota were based on gastric mucosal samples, which were obtained by surgical excision or biopsy.[4,5] These studies placed emphasis on differences and changes in gastric bacterial community. However, information of gut microbiota from GC patients was sparse. In present study, we aim to exploit the more convenient and noninvasive fecal samples for elucidating gut mcirobota of GC patients under perioperative conditions. In order to provide a normative reference, composition and diversity of gut microbiota were also compared between the GC patients and HCs. We found apparent different of gut microtiota between GC patients with HCs. Proteobacteria, Firmicutes, Actinobacteria, Bacteroidetes, and Fusobacteria were the major phyla in the gut microbiota of GC patients. This result is consistent with the previous studies about gastric microbiota from GC patients.[19,20] Interestingly, our data showed Verrucomicrobia in stool samples from GC patients, which was not been observed in gastric mucosal microbiota. A recent study also found the phylum Verrucomicrobia in stool samples from early GC patients after subtotal gastrectomy.[21] Several GC-associated bacteria have been identified, including Escherichia, Clostridium, Veillonella, and Streptococcus.[19,20] These microbial features were also prevalent in fecal samples in our study (Fig. 2C and E), although not all reaching statistical significance. The significant higher abundance of genus Veillonella was observed in our GC group than HC group (Fig. 2C). Veillonella belongs to nitrosating bacteria and nitrate-reducing bacteria. The bacteria may augment the production of N-nitroso compounds, which participate in carcinogenesis.[22] It may be necessary to further investigate these enriched bacteria in GC, since they may have potential noninvasive clinical application.
Although the central role of chronic infection by Helicobacter pylori (Hp) in the pathogenesis of gastric diseases was known,[23] the impact of colonization of Hp on gastric microbiota remains to be concerned and controversial. In clinical or preclinical studies, the composition of gastric microbiota showed no significant difference between Hp-positive subjects and Hp-negative controls.[4,24] On the contrary, some studies found that Hp infection is correlated with the component of gastric microbial community.[25,26] Despite the Hp infection, previous studies have shown that the abundance of Hp decreases in gastric microbiota of GC patients.[27,28] The abundance of genus Helicobacter at a very low ratio was observed in our GC fecal samples. Recently, few proportion of genus Helicobacter in fecal samples from actively Hp infected patients was detected.[29] In this paper, the author deduced that the intestinal tract environment might not be able to keep the Hp alive. Unfortunately, the status of Hp infection was not tested for all individuals participating in present study.
Both Chao1 and ACE are species-number based and show the richness within a single community. While, Shannon index, a more comprehensive parameter, is used to describe the richness and evenness for microbial community. In our study, the gut microbial communities in GC patients were structurally different from HCs, with increased richness and decreased Shannon index. Multiple factors including oxygen concentration, luminal pH, and drug use may play a role on microbial diversity.[30] In these factors, gastric acidity could be considered as barrier to bacterial colonization.[31] Beasley et al[32] have reported that gastric acidity can sift out a changed microbial community before it stretch into the intestines. Reduction of gastric acid secretion occurs during the carcinogenic process,[33] resulting in a moderate acid milieu that allows for a novel microbial community. The decreased Shannon index in GC patients could be recognized as a signature of disease states, in line with previous studies involved in inflammation and cancer within GI.[20,34] Above all, current evidence could support the notion that the stool samples can be used to reveal the gut microbiota from GC patients.
The stable human microbial community can be altered by factors ranging from diet to disease to therapeutic intervention. Interestingly, the PCA plot showed the similarity of gut profiles of the GC patients reached maximum after surgery (Fig. 4B). It may indicate that environmental factors and surgery reshape the gut microbiota to more homogeneous in perioperative period. In addition, the 6 patients with varying bacterial profiles did not develop severe complications, like infection, anastomotic leakage. The contribution for this shifts requires further research.
Distinct gastric microbial community changes in diversity and composition have been reported in distal GC patients in 2 years after surgery.[7] In our longitudinal study, gut microbial profiles showed that the RDG induced mildly effect on microbial diversity, but a pronounced impact on microbial composition under treatment. In agreement with above study, the gastrectomy resulting in increase of Bacteroidetes and decrease of Proteobacteria and Actinobacteria in our study. Other studies involving GC patients after surgery showed an increase in some genera Streptococcus, Escherichia, Prevotella, and Veillonella.[7,21] Our study indicated the GC patients who underwent gastrectomy had higher abundance of Escherichia/Shigella, Akkermansia, Dialister, and Prevotella when comparing with their state before surgery. Inconsistent results between these studies and ours may be related to different microbiota type (gut vs stomach) and postoperative temporal selection (days vs years).
Akkermansia, Escherichia/Shigella, Lactobacillus, and Dialister were the top genera after surgery. The surgery for distal GC has similar anatomic change effect with the bariatric bypass surgery, with the BII or RYGJ as the major reconstruction method. Specific population of gut microbiota such as Veillonella, Alistipes, Roseburia, Streptococcus, and Akkermansia has been repeatedly reported riched in gut micobiome after bariatric subtotal gastrectomy.[11,12] The remarkable increase of phylum Verrucomicrobia in GC patients after RDG was identified in our study. As we know, bacteria from Verrucomicrobia were entirely composed of bacteria from the genus Akkermansia. Akkermansia was isolated in 2004 as a new mucus-degrading bacteria from human stool, which was also found to be increased significantly after bariatric RYGB.[11,35]Akkermansia was considered can utilize mucus as a only source of carbon and nitrogen in times of caloric restriction.[36] Other studies suggested host alter inflammation and insulin sensitivity in response to the increase of Akkermansia.[37] Given this result, it is possible that Akkermansia may have potential role in regulating host rehabilitation.
SCFAs have an important role to maintain the integrity of the intestinal mucosa barrier.[14] In our study, a significant decrease in the concentration of Valerate in the HGC group was observed, and there were also decreasing trends of acetic acid, propionic acid, and butyric acid after RDG. Our study suggest that shifts of gut microbiota in GC patients after operation, along with concomitant decreases in beneficial SCFAs. Such loss of multiply SCFAs may further increase the permeability of the intestinal mucosal barrier after RDG. Therefore, prior targeted clinical interventions may help improve postoperative outcomes.
The major limitation of our study is small sample size. This study also was limited to single postoperative timepoint and did not reflect the nosocomial changes of gut microbiome over time. Moreover, the causal links between the candidate microbiota and clinic indicators need further investigation.
5. Conclusion
This prospective study demonstrated the richness, diversity and differential bacteria of gut microbiota between a group of GC patients and HCs. Using a highly sensitive culture-independent technique, the gut microbiota shifts in perioperative period were characterized for the first time in the patients with GC. The mechanisms shape postoperative gut microbiota are not clear. We speculate host and environmental factors may influence this shifts. Study with a larger simple size revealing association from gut microbiota and surgical interventions is still needed.
Author contributions
Conceptualization: Weiren Liang, Haiyong Wang, Shengrong Shen, Lisong Teng.
Data curation: Weiren Liang, Yan Yang, Haiyong Wang, Yimin Lu.
Formal analysis: Yan Yang, Haohao Wang, Lisong Teng.
Funding acquisition: Xiongfei Yu, Lisong Teng.
Investigation: Yan Yang.
Methodology: Weiren Liang, Shengrong Shen.
Project administration: Haohao Wang.
Resources: Haiyong Wang, Haohao Wang, Xiongfei Yu, Yimin Lu, Lisong Teng.
Software: Weiren Liang, Yan Yang, Yimin Lu, Shengrong Shen.
Supervision: Haiyong Wang, Xiongfei Yu, Shengrong Shen, Lisong Teng.
Visualization: Weiren Liang, Lisong Teng.
Writing – original draft: Weiren Liang, Haiyong Wang, Shengrong Shen.
Writing – review and editing: Lisong Teng.
Supplementary Material
Footnotes
Abbreviations: BII = billroth II anastomosis, FID = flame ionization detector, GC = gastric cancer, GCS = gas chromatography spectrometer, GI = gastrointestinal, HC = healthy control, LDA = linear discriminant analysis, OTU = operational taxonomic unit, PCR = polymerase chain reaction, RDG = radical distal gastrectomy, RYGJ = Roux-en-Y gastrojejuno anastomosis, SCFA = short-chain fatty acids.
This study was supported in part by the Natural Science Foundation of Zhejiang Province of China (Grant No. LY15H160026) and foundation of Zhejiang Health and Family Planning Committee (Grant No. 2017209495).
The authors have no conflicts of interest to disclose.
Supplemental Digital Content is available for this article.
References
- [1].Chen W, Zheng R, Baade PD, et al. Cancer statistics in China, 2015. Ca Cancer J Clin 2016;66:115–32. [DOI] [PubMed] [Google Scholar]
- [2].Liu Z, Feng F, Guo M, et al. Distal gastrectomy versus total gastrectomy for distal gastric cancer. Medicine 2017;96:e6003. [DOI] [PMC free article] [PubMed] [Google Scholar]
- [3].Savage DC. Microbial ecology of the gastrointestinal tract. Annu Rev Microbiol 1977;31:107–33. [DOI] [PubMed] [Google Scholar]
- [4].Bik EM, Eckburg PB, Gill SR, et al. Molecular analysis of the bacterial microbiota in the human stomach. Proc Natl Acad Sci U S A 2006;103:732–7. [DOI] [PMC free article] [PubMed] [Google Scholar]
- [5].Delgado S, Cabrera-Rubio R, Mira A, et al. Microbiological survey of the human gastric ecosystem using culturing and pyrosequencing methods. Microl Ecol 2013;65:763–72. [DOI] [PubMed] [Google Scholar]
- [6].Rogers MB, Aveson V, Firek B, et al. Disturbances of the perioperative microbiome across multiple body sites in patients undergoing pancreaticoduodenectomy. Pancreas 2016;46:260–7. [DOI] [PMC free article] [PubMed] [Google Scholar]
- [7].Tseng CH, Lin JT, Ho HJ, et al. Gastric microbiota and predicted gene functions are altered after subtotal gastrectomy in patients with gastric cancer. Sci Rep 2016;6:20701. [DOI] [PMC free article] [PubMed] [Google Scholar]
- [8].Gaines S, Shao C, Hyman N, et al. Gut microbiome influences on anastomotic leak and recurrence rates following colorectal cancer surgery. Brit J Surg 2018;105:e131–41. [DOI] [PMC free article] [PubMed] [Google Scholar]
- [9].Kau AL, Ahern PP, Griffin NW, et al. Human nutrition, the gut microbiome and the immune system. Nature 2011;474:327–36. [DOI] [PMC free article] [PubMed] [Google Scholar]
- [10].Ohigashi S, Sudo K, Kobayashi D, et al. Significant changes in the intestinal environment after surgery in patients with colorectal cancer. J Gastrointest Surg 2013;17:1657–64. [DOI] [PubMed] [Google Scholar]
- [11].Liou AP, Paziuk M, Luevano JM, Jr, et al. Conserved shifts in the gut microbiota due to gastric bypass reduce host weight and adiposity. Sci Transl Med 2013;5:178ra41. [DOI] [PMC free article] [PubMed] [Google Scholar]
- [12].Palleja A, Kashani A, Allin KH, et al. Roux-en-Y gastric bypass surgery of morbidly obese patients induces swift and persistent changes of the individual gut microbiota. Genome Med 2016;8:67. [DOI] [PMC free article] [PubMed] [Google Scholar]
- [13].Viaud S, Saccheri F, Mignot G, et al. The intestinal microbiota modulates the anticancer immune effects of cyclophosphamide. Science 2013;342:971–6. [DOI] [PMC free article] [PubMed] [Google Scholar]
- [14].Wong JM, de Souza R, Kendall CW, et al. Colonic health: fermentation and short chain fatty acids. J Clin Gastroenterol 2006;40:235–43. [DOI] [PubMed] [Google Scholar]
- [15].Edgar RC, Haas BJ, Clemente JC, et al. UCHIME improves sensitivity and speed of chimera detection. Bioinformatics 2011;27:2194–200. [DOI] [PMC free article] [PubMed] [Google Scholar]
- [16].Edgar RC. Search and clustering orders of magnitude faster than BLAST. Bioinformatics 2010;26:2460–1. [DOI] [PubMed] [Google Scholar]
- [17].Segata N, Izard J, Waldron L, et al. Metagenomic biomarker discovery and explanation. Genome Biol 2011;12:R60. [DOI] [PMC free article] [PubMed] [Google Scholar]
- [18].Caporaso JG, Kuczynski J, Stombaugh J, et al. QIIME allows analysis of high-throughput community sequencing data. Nat Methods 2010;7:335–6. [DOI] [PMC free article] [PubMed] [Google Scholar]
- [19].Johan D, Mathilda L, Magnus R, et al. Molecular characterization of the stomach microbiota in patients with gastric cancer and in controls. J Med Microbiol 2009;58:509–16. [DOI] [PubMed] [Google Scholar]
- [20].Ferreira RM, Pereira-Marques J, Pinto-Ribeiro I, et al. Gastric microbial community profiling reveals a dysbiotic cancer-associated microbiota. Gut 2017;67:226–36. [DOI] [PMC free article] [PubMed] [Google Scholar]
- [21].Lin XH, Huang KH, Chuang WH, et al. The long term effect of metabolic profile and microbiota status in early gastric cancer patients after subtotal gastrectomy. PLoS One 2018;13:e0206930. [DOI] [PMC free article] [PubMed] [Google Scholar]
- [22].Plottel CS, Blaser MJ. Microbiome and malignancy. Cell Host Microbe 2011;10:324–35. [DOI] [PMC free article] [PubMed] [Google Scholar]
- [23].Huang JQ, Hunt RH. The evolving epidemiology of Helicobacter pylori infection and gastric cancer. Can J Gastroenterol 2003;17Suppl B:18B–20B. [DOI] [PubMed] [Google Scholar]
- [24].Martin ME, Bhatnagar S, George MD, et al. The impact of Helicobacter pylori infection on the gastric microbiota of the rhesus macaque. PLos One 2013;8:e76375. [DOI] [PMC free article] [PubMed] [Google Scholar]
- [25].Brawner KM, Kumar R, Serrano CA, et al. Helicobacter pylori infection is associated with an altered gastric microbiota in children. Mucosal Immunol 2017;10:1169–77. [DOI] [PMC free article] [PubMed] [Google Scholar]
- [26].Hornsby MJ, Huff JL, Kays RJ, et al. Helicobacter pylori induces an antimicrobial response in rhesus macaques in a cag pathogenicity island-dependent manner. Gastroenterology 2008;134:1049–57. [DOI] [PMC free article] [PubMed] [Google Scholar]
- [27].Eun CS, Kim BK, Han DS, et al. Differences in gastric mucosal microbiota profiling in patients with chronic gastritis, intestinal metaplasia, and gastric cancer using pyrosequencing methods. Helicobacter 2015;19:407–16. [DOI] [PubMed] [Google Scholar]
- [28].Sohn SH, Kim N, Jo HJ, et al. Analysis of gastric body microbiota by pyrosequencing: possible role of bacteria other than Helicobacter pylori in the gastric carcinogenesis. J Cancer Pre 2017;22:115–25. [DOI] [PMC free article] [PubMed] [Google Scholar]
- [29].Gao JJ, Zhang Y, Gerhard M, et al. Association between gut microbiota and Helicobacter pylori-related gastric lesions in a high-risk population of gastric cancer. Front Cell Infect Microbiol 2018;8:202. [DOI] [PMC free article] [PubMed] [Google Scholar]
- [30].Magnus Sn, Giovanni B, Flint HJ, et al. Intestinal microbiota in functional bowel disorders: a Rome foundation report. Gut 2013;62:159–76. [DOI] [PMC free article] [PubMed] [Google Scholar]
- [31].Giannella RA, Broitman SA, Zamcheck N. Gastrie acid barrier to ingested microorganisms in man: studies in vivo and in vitro. Gut 1972;13:251–6. [DOI] [PMC free article] [PubMed] [Google Scholar]
- [32].Beasley DE, Koltz AM, Lambert JE, et al. The evolution of stomach acidity and its relevance to the human microbiome. PLos One 2015;10:e0134116. [DOI] [PMC free article] [PubMed] [Google Scholar]
- [33].Waldum HL, Kleveland PM, Sørdal ØF. Helicobacter pylori and gastric acid: an intimate and reciprocal relationship. Ther Adv Gastroenter 2016;9:836–44. [DOI] [PMC free article] [PubMed] [Google Scholar]
- [34].Gevers D, Kugathasan S, Denson LA, et al. The treatment-naive microbiome in new-onset Crohn's disease. Cell Host Microbe 2014;15:382–92. [DOI] [PMC free article] [PubMed] [Google Scholar]
- [35].Graessler J, Qin Y, Zhong H, et al. Metagenomic sequencing of the human gut microbiome before and after bariatric surgery in obese patients with type 2 diabetes: correlation with inflammatory and metabolic parameters. Pharmacogenomics J 2013;13:514–22. [DOI] [PubMed] [Google Scholar]
- [36].Derrien M, Vaughan EE, Plugge CM, et al. Akkermansia muciniphila gen. nov., sp. nov., a human intestinal mucin-degrading bacterium. Int J Syst Evol Microbiol 2004;54:1469–76. [DOI] [PubMed] [Google Scholar]
- [37].Derrien M, Van Baarlen P, Hooiveld G, et al. Modulation of mucosal immune response, tolerance, and proliferation in mice colonized by the mucin-degrader Akkermansia muciniphila. Front Microbiol 2011;2:166. [DOI] [PMC free article] [PubMed] [Google Scholar]
Associated Data
This section collects any data citations, data availability statements, or supplementary materials included in this article.