Abstract
Neurite self-recognition and avoidance are fundamental properties of all nervous systems1. These processes facilitate dendritic arborization2,3, prevent formation of autapses4, and allow free interaction among non-self neurons1,2,4,5. Avoidance among self-neurites is mediated by stochastic cell-surface expression of combinations of ~60 α-, β-, and γ-clustered protocadherin (Pcdh) isoforms, which provide mammalian neurons with single-cell identities1,2,4–13. Avoidance is observed between neurons expressing identical Pcdh repertoires2,5, with single isoform differences sufficient to prevent self-recognition10. Pcdhs form isoform-promiscuous cis dimers and isoform-specific homophilic trans dimers10,14–20. While these interactions have been characterized in isolation15,17–20, structures for full-length Pcdh ectodomains have not been determined; how these two interfaces engage in self-recognition between neuronal surfaces remains unknown. Here, using X-ray crystallography and cryo-electron tomography (cryo-ET), we determine the molecular arrangement of full-length Pcdh ectodomains in single-isoform self-recognition complexes. We determined the crystal structure of the Pcdh γB4 ectodomain, revealing a zipper-like lattice formed by alternating cis and trans interactions. Using cryo-ET, we show that Pcdh γB6 ectodomains tethered to liposomes spontaneously assemble into linear arrays at membrane contact sites, in a configuration consistent with the assembly observed in the crystal structure. These linear assemblies pack against each other as parallel arrays to form larger two-dimensional structures between membranes. Our results suggest that formation of ordered linear assemblies by Pcdhs represents the initial self-recognition step in neuronal avoidance, supporting the isoform mismatch chain-termination model of Pcdh-mediated self-recognition, which depends on such linear chains11.
We determined a low-resolution crystal structure of a full-length γB4-Pcdh ectodomain, which comprises six extracellular cadherin domains (EC1–6), revealing an extended zipper-like assembly (Fig. 1, Extended Data Fig. 1 and Extended Data Table 1). The γB4 molecules form cis-dimers through an asymmetric interaction between EC5 and EC6 of one protomer with EC6 of the other (Fig. 1a), and head-to-tail EC1–4-mediated trans interactions between distinct cis dimers in the crystal generating a one-dimensional zipper-like array (Fig. 1b). The cis and trans interactions are similar to those observed separately in crystal structures of γB-Pcdh fragments15–20. Root mean square deviations (RMSDs) over aligned Cα atoms are 2–3 Å (Extended Data Fig. 2), suggesting that little conformational change is required for zipper formation. The cis dimers in the zipper are arranged as if emanating from two apposed membrane surfaces and the array is regular and could theoretically propagate indefinitely.
Figure 1: Crystal structure of the Pcdh γB4 ectodomain reveals a zipper-like assembly.
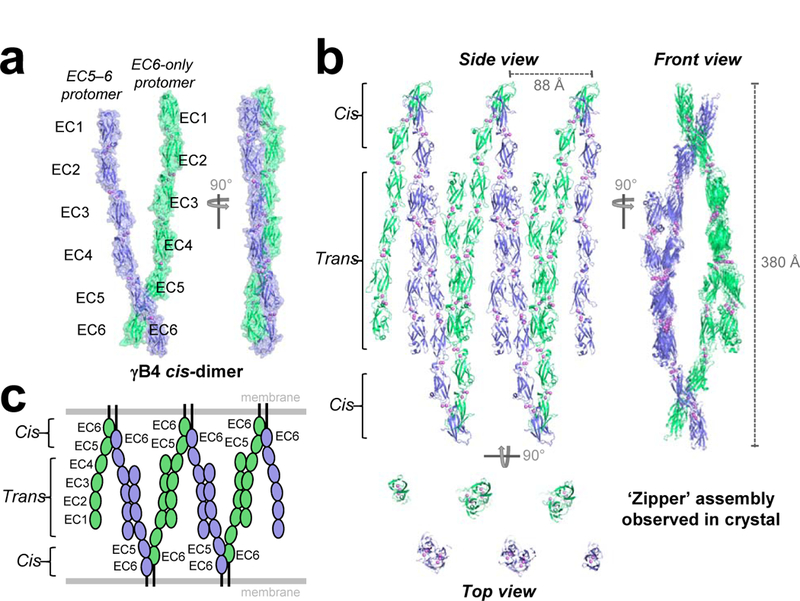
a, Asymmetric unit of the γB4 crystal structure containing two γB4EC1–6 protomers (green and blue) engaged in the asymmetrical cis-dimer interaction.
b, Zipper-like array of γB4 through EC1–4-mediated trans interactions between two-fold related cis dimers. Three orthogonal views shown with bound calcium ions (violet spheres). γB4 molecules interacting in trans are shown in identical colors. Top view shows a slice through the midsection.
c, Schematic of the zipper-like assembly depicted in b arranged as if between two membranes.
While the crystal structure of the Pcdh-γB4 ectodomain reveals a polymeric structure assembled from cis and trans interactions, analytical ultracentrifugation experiments have shown that complete γB-Pcdh ectodomains form dimers-of-dimers in solution15,18. To understand this difference, we determined the overall architecture of these complexes in solution using single particle cryo-ET on purified full-length Pcdh γB6EC1–6 ectodomains21 preserved in vitreous ice (Fig. 2, Extended Data Fig. 3, Supplementary Video 1). Sub-tomogram averaging yielded a 3D map, with resolution calculated to be ~35Å by Fourier shell correlation (FSC=0.143), showing an asymmetrical elongated ellipsoidal shape with readily distinguishable characteristics closely resembling individual observed particles, in which extended Pcdh ectodomains appear to wrap around each other in the central regions, and cross at the top and bottom (Fig. 2a). 2D-class averages obtained from individual images provide domain-level resolution and show the solution complex is a dimer of two bi-antennary cis dimers joined through trans binding interactions in each arm (Fig. 2c, Extended Data Fig. 4). Consistent with this configuration, the interacting EC5–6/EC6 regions of the γB7EC3–6 cis-dimer structure could be readily docked into the map (Fig. 2b). However, the EC3–4-regions from the γB7EC3–6 structure did not fit within the map without allowing flexibility at the EC4:EC5 junction, suggesting a conformational change relative to the fragment crystal structure (Extended Data Fig. 5, Extended Data Table 2). Similarly, fitting two copies of the trans dimer from the γB2EC1–5 crystal structure into the map necessitated bending and rotation of the trans dimers about the EC2:EC3 junctions; this was particularly pronounced in one of the two trans dimer arms (Fig. 2b, Extended Data Fig. 5). These conformational differences with respect to the fragment crystal structures (Fig. 2e) facilitate formation of a compact dimer-of-dimers with all four protomers simultaneously engaging in both cis and trans interactions20 (Fig. 2b). The deformation of cis- and trans-dimer crystal structures required to form the dimer-of-dimers suggests that it may represent a high-energy conformation.
Figure 2: Pcdh γB6 ectodomains in solution assemble as a dimer-of-dimers through cis and trans interfaces.
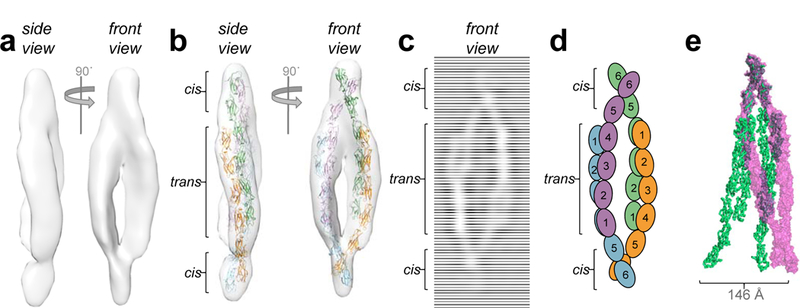
a, Subtomogram averaged density map of γB6EC1–6 particles from reconstructed tomograms reveals an asymmetric ellipsoidal complex.
b, Fit of γB-Pcdh trans and cis dimer crystal structures into the cryo-ET map.
c, 2D-class average of γB6EC1–6 particles in ice. Compare to b.
d, Schematic model of γB6EC1–6 ectodomains in the dimer-of-dimers.
e, Overlay of γB6EC1–6 dimer-of-dimers (magenta volume) with γB4EC1–6 zipper from the crystal structure (green ribbon). Distance between EC6 domains of equivalent protomers in each model indicated by an arrow.
To determine if dimer-of-dimers or zipper assemblies form between membranes, we tethered Pcdh γB6 ectodomains to liposome surfaces22 on which ectodomains could freely diffuse, mimicking a native membrane environment (Fig. 3a). Wild-type γB-Pcdhs mediated robust liposome aggregation, which was dependent on trans interactions (Fig. 3b), and mimicked Pcdh behavior on cell surfaces10,14,15 and in solution15. To visualize Pcdhs at membrane contact sites, we preserved wild-type γB6EC1–6 aggregates in vitreous ice and performed cryo-ET studies (Fig. 3c, Extended Data Fig. 6, and Supplementary Video 2, 3). Reconstructed tomograms revealed contacting liposomes with constant intermembrane spacings of ~375 Å between parallel membranes, with ordered protein density between adherent membranes. Different views of the Pcdh assembly were identifiable in the tomograms (Fig. 3c-e): an ellipsoid ‘front’ view, extending continuously through the volume of the tomogram (Supplementary Video 2, 3, Extended Data Fig. 7); a striped, zipper-like ‘side’ view; and a dotted, regular, grid-like ‘top’ view that was evident in tomographic slices through Pcdh layers connecting vertically stacked liposomes. Visual comparison of γB6EC1–6 assemblies between membranes (Fig. 3c and e) with the Pcdh zipper observed in the crystal structure of γB4EC1–6 (Fig. 1) indicates a high level of correspondence, with the major views evident in the tomogram each consistent with corresponding views of the zipper (Fig. 3c and e). Pcdhs thus form continuous ordered assemblies in a native-like membrane environment.
Figure 3: Pcdh γB6 forms continuous ordered assemblies between liposome membranes.
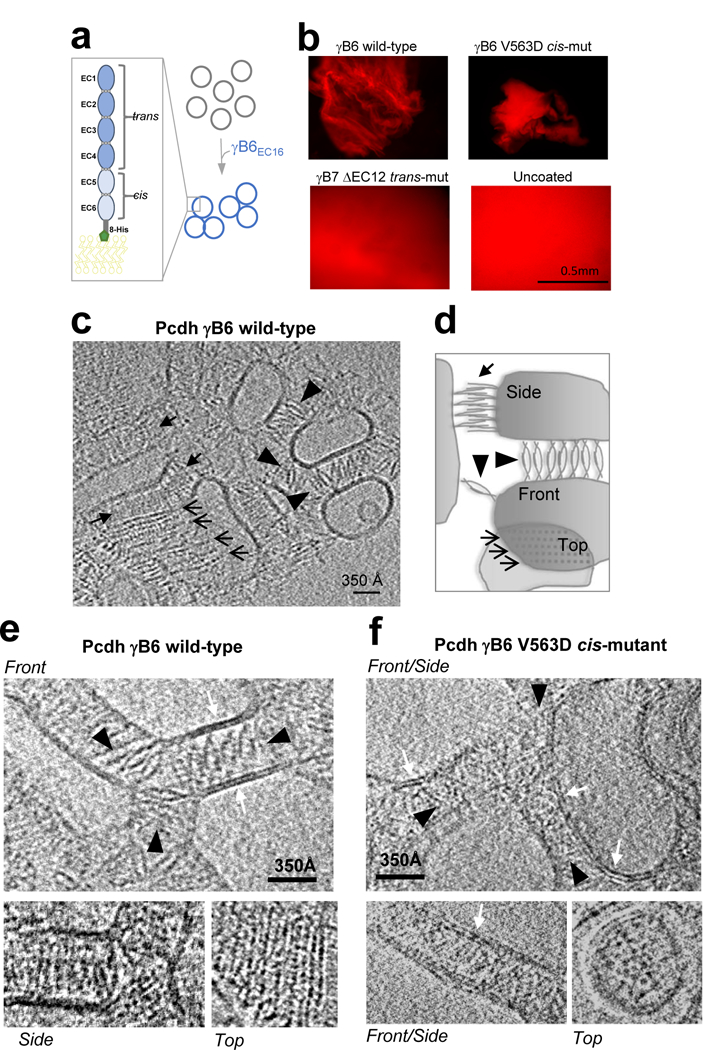
a, γB6EC1–6 ectodomains tethered to liposomes facilitate aggregation.
b, Liposome aggregates visualized by fluorescence microscopy. Wild-type and V563D cis-mutant γB6EC1–6 form single large aggregates (shown), while trans-mutant γB7EC1–6 ΔEC1–2 fails to aggregate liposomes. Negative control shows uncoated liposomes.
c, Slice of a tomogram showing aggregates of liposomes coated with wild-type γB6EC1–6 ectodomains. Different views of ordered assemblies indicated by arrows.
d, Schematic of lattice orientations corresponding to views in c.
e and f, Close up views of individual slices of tomograms showing front (top panel), side (bottom left) and top (bottom right) views of assemblies formed by ectodomains of wild-type (e) and V563D cis-mutant (f) γB6EC1–6. Note that ordered assemblies are absent in the mutant. White arrows indicate lipid bilayers.
To determine the role of the cis interface observed in our crystal structures, we repeated the cryo-ET experiments with γB6 cis-mutant V563D18 on liposomes. As expected, since the trans interface is intact, this mutant mediated liposome aggregation similar to wild-type γB6EC1–6 (Fig. 3b). However, although ectodomains still accumulated at liposome contact sites in tomograms, and single trans dimers could be observed, the characteristic ordered front, side, and top views of the zipper-like arrays from wild-type experiments were absent (Fig. 3f, Supplementary Video 4), demonstrating that ordered Pcdh assembly between membranes depends on cis interactions observed in crystal structures.
We next sought to characterize the correspondence between the crystallographic γB4EC1–6 zipper and the intermembrane assembly observed by cryo-ET. We fitted a portion of the γB4EC1–6 zipper from the crystal structure into consecutive slices following a front view array through the tomogram volume, revealing close correspondence between the crystal structure and the assembly from the tomogram (Extended Data Fig. 7).
To facilitate docking of multiple crystallographic γB-Pcdh zipper-arrays into density, we generated segmented maps for protein density and lipid bilayers using a convolutional neural network (Fig. 4a–b, d, Extended Data Fig. 8, and Supplementary Video 5). Thirteen distinct zipper-arrays, comprising up to 14 cis dimers each, were fitted into the protein density (Fig. 4c and f), with good correspondence to the segmented protein map (Supplementary Video 5). ‘Top views’ of segmented maps depicting Pcdhs assembled between the apposed membranes of vertically stacked liposomes (Fig. 4d) revealed a repeating pattern where distances measured between protomers mid-way through the zipper (Fig 4e) alternated between short and long, with remarkable correspondence to distances measured from the crystal structure (Fig. 4f). Average distance error between the lattices observed in the crystal structure and the tomogram were <3Å (<5%) for the three zippers assessed. Neighboring zipper assemblies are arranged such that they all propagate in parallel, allowing each to extend unimpeded (Fig. 4c and f). This parallel alignment could arise due to packing effects between the matching sawtooth structures of neighboring zippers (Fig. 4e and f and Supplementary Video 5), but display no consistent molecular interactions between protomers.
Figure 4: Pcdh γB6 forms extended parallel zipper arrays on membranes consistent with the chain-termination model.
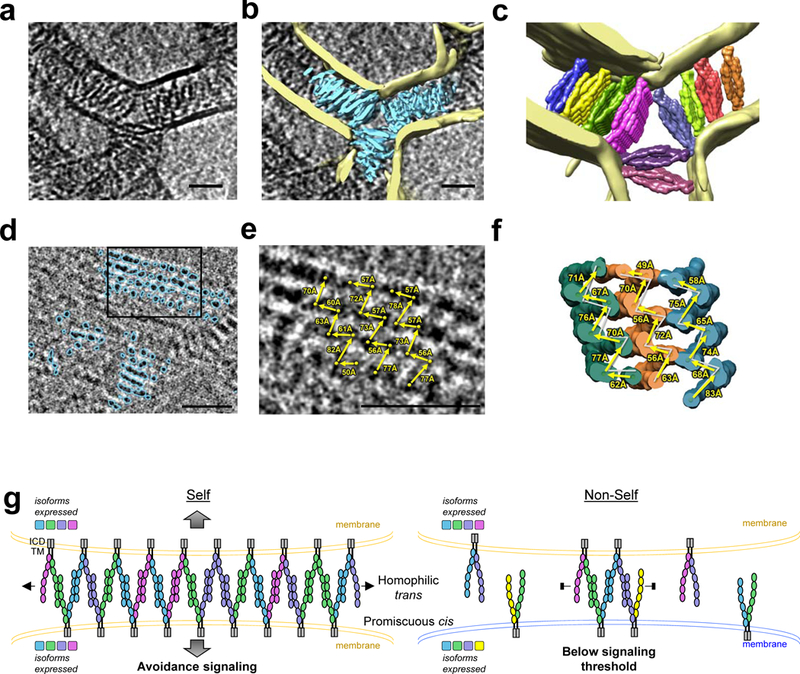
a, Close up view of a single tomographic slice showing γB6EC1–6 assemblies between liposome membranes. Parallel zipper arrays appear as front views extending into the plane (orthogonal to zipper side view shown schematically in g). Scale bar: 350Å.
b, Annotated maps of lipid bilayers (yellow) and γB6EC1–6 (cyan) overlaid as a slab on a.
c, Ten linear arrays of cis/trans interactions from the γB4EC1–6 crystal lattice (surfaces) fitted into the protein density. Lipid bilayers shown in yellow. See also Supplementary Video 5.
d, Tomogram slice showing annotated ‘top views’ of parallel Pcdh zipper arrays (cyan) formed between membranes of vertically stacked liposomes.
e, Magnification of the region boxed in d. Distances (arrows) between protomers (spheres) in three separate zipper arrays are given.
f, Distances analogous to those in e, measured from zipper array crystal structures fitted into the protein density. For comparison distances from e are included as grey lines.
g, Schematic model of the chain-termination model of Pcdh function in neuronal self-avoidance. See text.
The formation of zipper-like structures by Pcdhs between interacting membranes was previously hypothesized based on the cis and trans interactions revealed in biophysical studies15,17,18,20. Here we have shown that, despite their tendency to form dimers-of-dimers in solution, a zipper-like lattice is the favored assembly formed by γB-Pcdhs between interacting membrane surfaces. Since Pcdhs from all subfamilies have similar overall structures and utilize similar cis and trans interfaces15–20, all Pcdhs can likely incorporate into such zipper-like arrays15,18. While dimers-of-dimers were not observed in the tomographic volumes we analyzed, we cannot rule out the possibility that this species could form between membranes when both arms of the interacting cis dimers are matched.
Assembly of Pcdhs into a zipper-like superstructure, in combination with the known homophilic specificity of trans interactions and promiscuity of cis interactions, inspired a chain-termination model for Pcdh-mediated self-vs-non-self discrimination11,15. In this model, large zipper assemblies can form between membrane surfaces expressing identical subsets of Pcdh isoforms (e.g. neurites from the same neuron), triggering a signal leading to avoidance (Fig. 4g). Our tomography results show that contiguous zippers indeed extend the entire length of the contact region between membrane surfaces, and neighboring zippers can form in parallel, further increasing the size of the assembly. In contrast, when isoform repertoires are not identical (e.g. neurites from different neurons), mismatched isoforms are incorporated, preventing further growth of the zipper assemblies and limiting their size below a presumed signaling threshold mediated by Pcdh intracellular domains 5 (Fig. 4g). Computational analyses have demonstrated that this mechanism can account for self-vs-non-self discrimination amongst thousands of interacting neurons11,15,20.
Our results raise the question as to whether the specific arrangement of Pcdh molecules in the zipper assembly is important for downstream signaling, for example by coupling to structured elements in the cytoplasm, or alternatively, whether the role of the zipper is simply to increase the concentration of Pcdhs at cell-cell contacts. Cell-based assays show that Pcdhs achieve high concentrations at contacts10, but whether these concentrations are substantially lowered when mismatched isoforms are present and chains are terminated when they are short15, remains a critical question. The details of the Pcdh-initiated signaling cascade that lead to neuronal avoidance5,23–27 are not yet well defined. While Pcdh ectodomains are known to be cleaved by a metalloproteinase and γ-secretase28, it is unclear whether this function is involved in avoidance. Nevertheless, the structures of Pcdh recognition complexes reported here provide support for the chain-termination model for Pcdh-mediated self-recognition15, and a basis for future studies of the molecular mechanisms underlying neuronal avoidance.
Methods
Protein production
cDNAs for Pcdh ectodomain regions, excluding the predicted signal sequences, were cloned into a pαSHP-H mammalian expression vector (a kind gift from Daniel J. Leahy, John Hopkins University) modified with the BiP signal sequence and a C-terminal octahistidine tag16. The signal sequences were predicted using the SignalP 4.0 server29. Pcdh ectodomains consist of six extracellular cadherin domains (EC) followed by an unstructured linker of 23–25 amino acids prior to the transmembrane helix21. The γB4 and γB6 EC1–6 constructs used in this study contain coding sequences for the six EC domains and five residues from the unstructured linker followed by the octahistidine tag (residues 1–638 for γB4EC1–6, following signal peptide cleavage, and residues 1–641 for γB6EC1–6). Pcdh γB4 and γB6 share 67.1% sequence identity with similar cis and trans dimerization behavior18. The γB6 EC1–6 cis mutant construct (V563D) was generated using the standard Quikchange mutagenesis protocol (Stratagene).
Suspension-adapted HEK293 Freestyle cells (Invitrogen) in serum free media (Invitrogen) were used for protein expression. The cell line was not tested for mycoplasma contamination and has not been authenticated. The plasmid constructs were transfected into cells using polyethyleneimine (Polysciences Inc.). Media was harvested ~6 days after transfection and the secreted proteins were purified by nickel affinity chromatography followed by size exclusion chromatography in 10 mM Tris pH 8.0, 150 mM sodium chloride, 3 mM calcium chloride, and 200–250 mM imidazole pH 8.0. Purified proteins were concentrated to >2 mg/ml and used for crystallization and/or electron microscopy experiments. Molecular masses determined by mass spectrometry (Iowa State University Mass Spectrometry Facility) for the purified wild-type proteins were 76.6 kDa for γB4EC1–6 and 77.7 kDa for γB6EC1–6.
X-ray crystallography
γB4 EC1–6 protein crystals were grown using protein in size exclusion buffer (10 mM Tris pH 8.0, 150 mM sodium chloride, 3 mM calcium chloride, and 200 mM imidazole pH 8.0), at a concentration of 3 mg/ml and the vapor diffusion method. The crystallization condition was 10% (w/v) PEG8000, 20% ethylene glycol, 10% Morpheus Amino Acids (Molecular Dimensions), and 0.1 M Morpheus Buffer System 2 (Hepes/MOPS buffer; Molecular Dimensions) pH 7.5. X-ray diffraction data were collected at 100K from a single crystal at Northeastern Collaborative Access Team (NE-CAT) beamline 24ID-C at the Advanced Photon Source, Argonne National Laboratory. The dataset was indexed using XDS30 and scaled using XSCALE30.
Diffraction anisotropy
The X-ray diffraction data showed strong diffraction anisotropy, with relatively strong diffraction along c* and much weaker diffraction along a* and b* (Extended Data Fig. 1 and Extended Data Table 1). These data were therefore truncated using ellipsoidal limits of 6.0/6.8/4.5 Å along each of the three principle crystal axes as implemented in the UCLA Diffraction Anisotropy Server31. The completeness within the applied ellipsoidal resolution limits was 93.6%.
Crystal structure phasing and refinement
The γB4 EC1–6 crystal structure was solved by molecular replacement using Phaser32, implemented in Phenix33, using the γB7EC3–6 cis-dimer structure (PDB: 5V5X)21 as a search model. Following an initial round of rigid body refinement using Phenix33 EC domains 1 and 2 from the γB2EC1–5 crystal structure (PDB: 5T9T)19 were manually placed, using structural alignment of the EC3–4 regions of the γB2EC1–5 crystal structure to the molecular replacement solution as a guide. The resulting model was subjected to a further round of rigid body refinement. At this stage there was clear difference density for the interdomain calcium ions and covalently linked glycans not present in the models (Extended Data Figure 1). Iterative model building using Coot34 and maximum-likelihood refinement using Phenix33 was subsequently conducted, with care taken to maintain the geometry given the low-resolution of the data, yielding the final refined structure whose statistics are reported in Extended Data Table 1.
The electron density maps obtained were of reasonably good quality given the low resolution (Extended Data Figure 1). However due to the low resolution, atomic details were not well defined, and side chains were often not resolved. The local geometry of the starting models taken from higher resolution published crystal structures of γB-Pcdh fragments was therefore maintained as much as possible. Given these resolution constraints, we have limited our discussion of the crystal structure to the overall architecture and arrangement of the molecules in the crystal.
Structure analysis
Interdomain angles were calculated using UCSF Chimera35. Root mean square deviations over aligned Cα atoms between structures were calculated using PyMol (Schrödinger, LLC). Protein structure figures were made using PyMol or UCSF Chimera35.
Single Particle cryo-Electron Microscopy Sample Preparation
Single particle grids were prepared using Spotiton V1.0 robot36–38 to obtain thin vitreous ice aiding contrast during data collection. Lacey carbon or gold nanowire grids were prepared in house as described previously in Razinkov et al., 201639. Grids were glow-discharged for 10 s with O2 and H2, sample was dispensed onto the grid in 50 pl drops as one single stripe, incubated for ~500 ms as determined by the calibrated self-wicking time per grid, followed by plunging into liquid ethane.
Liposome aggregation assay and sample preparation for cryo-ET experiments
Liposomes were prepared by a hydration and extrusion method from an 8:2 molar ratio of 1,2-dioleoyl-sn-glycero-3-phosphocholine (DOPC) and the nickel salt of 1,2-dioleoyl-sn- glycero-3-([N(5-amino-1-carboxypentyl)iminodiaceticacid]-succinyl) (DOGS-NTA) according to the manufacturer’s protocol (Avanti Lipids). Lipids were hydrated with assay buffer (25 mM HEPES pH 7.4, 0.1 M KCl, 10% (v/v) glycerol, 3 mM CaCl2) and resuspended liposomes extruded using membranes with a pore size of 100 nm. Liposome aggregation assays were adapted from previously described experiments described in Harrison et al., 201122: liposomes and purified octahistidine-tagged Pcdh ectodomains were mixed at final concentrations of 10 mM liposomes and 7 µM protein in assay buffer for a total volume of 20 µL and incubated at 37°C for eight hours. When cells expressing Pcdhs come into contact, all detectable Pcdh from the cell surface localizes to the site of cell-cell contact10; we see a similar effect with liposomes, and Pcdh zippers are observed even for low protein-coating densities (see e.g. Fig. 3c).
For electron microscopy experiments, large aggregates were gently resuspended by trituration with a 10 µL pipette tip and 3 µl of each suspension were incubated on home-made, glow-discharged lacey carbon grids for 10 seconds at 85% relative humidity, blotted for 2.5 sec and flash frozen in liquid ethane using a semi-automated approach by utilizing either a Gatan CP3 or FEI Vitrobot.
For fluorescence microscopy, liposomes were prepared with Rhodamine lipids (Sigma) in addition to the standard composition of DOPC and DOGS-NTA, assays were performed as described for electron microscopy and 5 µL of each experiment was imaged with a Nikon eclipse E800 microscope using QCapture.
Tilt-series data collection
Tilt-series were collected using a Titan Krios (FEI/Thermo Fisher) outfitted with a direct detector Gatan K2 (Gatan, Inc.) at 300 keV. Some wild-type (Supplementary Video 3) and all cis-mutant γB6EC1–6 tilt-series were collected using a Gatan Bioquantum energy filter (Gatan, Inc.). In addition, part of the single-particle tilt-series were collected using a Volta phase plate (FEI/Thermo Fisher). Data was collected bi-directionally with a tilt-range of −54° to 54° in 2° increments using Leginon40,41 with 100 ms frames for each tilt image at a nominal defocus range of 0 and 2 (phase plate collections) or 6 microns. Total dose per tilt-series collected was between 50 and 150 e-/Å2 with dose rates of approximately 8 e-/pixel/sec. Incident dose for the 0° tilt image was between 1.5 and 3.0 e-/Å2, and increased for higher tilt angles according to the cosine of the tilt angle. Single particle tilt-series were collected at a pixel size of 1.76 Å and tilt-series of protocadherin-coated liposomes at 1.84 Å. Full-frame alignment was performed using MotionCor242.
Tilt-series alignment
Tilt-series were aligned using Appion-Protomo43–45. Tilt-series were coarsely aligned, manually aligned and then refined using a set of alignment thicknesses. The best aligned iteration was reconstructed for visual analysis using Tomo3D SIRT46,47 after dose-compensation using the relation described in Grant and Grigorieff (2015)48. CTF correction was not performed.
Sub-tomogram averaging of dimer-of dimers
Particle picking was performed using the dipole set model in Dynamo49,50. Each particle of a dimer-of-dimers was annotated at the termini with ‘north’ and ‘south’ to pre-define the long axis and aid sub-tomogram alignment (see Extended Data Figure 3). In seven tomograms, 506 particles were annotated, sub-volumes extracted and processed through sub-tomogram alignment and refinement using Dynamo49,50. An initial model was created from 86 randomly chosen particles and an ellipsoid mask was applied during refinement. Azimuth and cone flip were both enabled to allow particles to flip 180° during refinement to permit correction of inverted dipole annotation. No symmetry was applied since tests using 2-fold symmetry resulted in featureless maps, which is consistent with the non-identical bend and rotation apparent in the two trans dimer regions of the final map (Fig. 1).
Single particle 2D data collection and processing
Data was collected at 300 kV on a Titan Krios (FEI/Thermo Fisher) equipped with a Gatan K2 Counting camera. The pixel size was 1.1 Å and defocus ranged from 1–4 microns. Exposures were set to 10 s (40 frames per image) for a total dose of ~68 e-/Å2. Frames were aligned using MotionCor242. 1,540 particles were picked manually from 87 micrographs using Appion Manual Picker44 to serve as a training set for a positive-unlabeled convoluted neural network particle picker, Topaz51. 14,569 particles were selected and 2D classification was performed in Relion252, providing domain level resolution. Strong preferred orientation was shown in the 2D class averages and single particle tomograms revealed that protocadherin γB6EC1–6 was predominantly localized to the air water interface23. As a result we pursued further 3D reconstruction using cryo-ET.
Neural Network Tomogram Annotation
Semi-automated segmentation of the tomograms was performed using the TomoSeg protocol in EMAN2.253. Tomograms were imported into the EMAN2.2 workflow and binned for a final pixel size of 7.36 Å. For annotation of clustered protocadherin density, thirteen 64×64 pixel regions of interest (ROIs) were selected from the reconstructed tomogram and manually annotated as positive training references and 123 ROIs were selected as negative training references. For annotation of liposome membrane density, ten ROIs were selected and manually annotated as positive training references and 100 ROIs were selected as negative training references. Convolutional neural network training was performed with EMAN2.2’s default parameters for lipid bilayers, while the clustered protocadherin convolutional neural network was trained over 40 iterations.
Fitting of continuous γB4EC1–6 arrays into annotated tomogram maps
Atomic models were fit into the annotated tomogram using the FitMap command in UCSF Chimera35. The tomogram was examined by eye to determine the length of the lattices that formed between liposome membranes and the lattice assembly of the crystal structure of γB4EC1–6 was extended to match the continuous density. The structural assembly was placed in the intermembrane space and fit globally within a 50 nm radius of the initial placement. The average correlation coefficient at 20 Å was 0.735 ± 0.0305.
Data availability
Crystallographic atomic coordinates and structure factors have been deposited in the protein data bank with accession code PDB: 6E6B. Binned by four or two tomograms of the single-particle and Pcdh-liposome datasets were deposited in the Electron Microscopy Data bank (EMDB) with accession codes: EMD-9197, EMD-9198, EMD-9199 and EMD-9200. Unaligned tilt-series images, Appion-Protomo tilt-series alignment runs, and aligned tilt-series stacks were deposited to the Electron Microscopy Pilot Image Archive (EMPIAR) with accession codes: EMPIAR-10234, EMPIAR-10235, EMPIAR-10236, EMPIAR-10237, and EMPIAR-10238.
Statistics and Reproducibility
The crystal structure was determined from diffraction data obtained from one crystal (n=1; Extended Data Fig. 1a and c). Multiplicity and final refinement statistics are reported in Extended Data Table 1. The single particle cryo-EM map of the dimer-of-dimers was determined using sub-tomogram averaging of volumes extracted from n=7 independent experiments (Fig. 2c and , Extended Data Fig 3). The single particle averages shown in Fig. 2c and Extended Data Fig. 4 were highly reproducible from three independent experiments (n=3). Liposome aggregation assays for wild-type and mutant Pcdh were replicated in n=3 independent experiments and gave highly consistent results (Fig, 3 and 4, Extended Data Fig. 6–8). Reconstructed tomograms of wild-type and mutant proteins coated onto liposomes, of which representative images and regions of interest are shown in Figs. 2 and 4, and Extended Data Fig. 6–8, are derived from n>4 independent experiments. Ordered assemblies (Fig. 3c and e, and 4a and d, and Extended Data Fig. 6–8) were consistently observed in all wild-type Pcdh experiments (n>11), while the ordered assemblies were consistently absent in all cis-mutant Pcdh tilt series (n> 4, Fig. 3f). The neural network segmentation of protein density and lipid bilayers was trained on the full tomogram shown (Extended Data Fig. 8a) and could reliably be applied to other tomograms (n=2, Fig. 4a, b and d, e, Extended Data Fig. 8b),
Extended Data
Extended Data Figure 1: X-ray diffraction anisotropy and electron density map quality for the low-resolution γB4EC1–6 crystal structure.
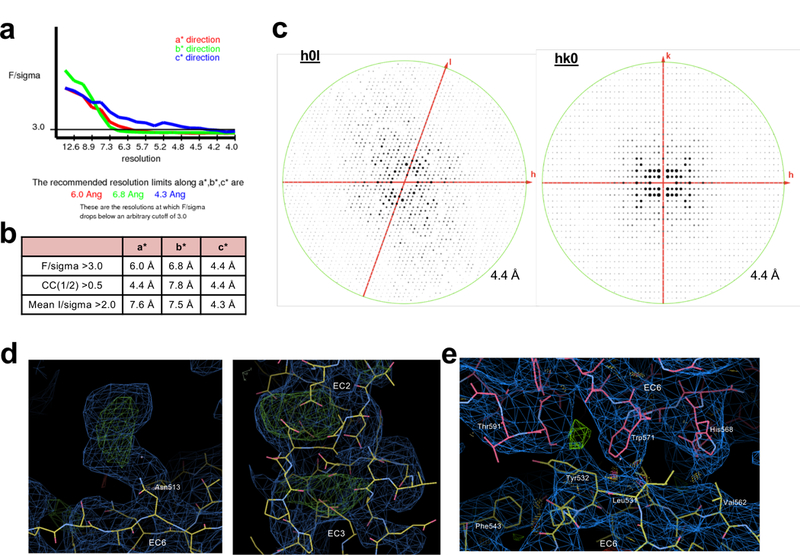
a, UCLA Diffraction Anisotropy Server (Strong et al., 2006) output showing the data strength as measured by F/sigma along the a*, b* and c* axes.
b, The diffraction limits along the a*, b* and c* axes determined by three different methods: F/sigma from (a), and the correlation coefficient (CC) and I/sigma limits calculated by Aimless (Evans et al., 2006; Evans and Murshudov, 2013). c, Synthetic precession photographs of the X-ray diffraction in the k=0 plane (left) and the l=0 plane (right) showing the comparatively stronger/weaker diffraction.
d, Exemplar electron density images of the γB4EC1–6 crystal structure highlighting the difference density observed for ligand molecules following placement of all protein domains and one round of rigid body refinement. The left hand panel shows difference density for a glycosylated asparagine residue (Asn513 chain B) and the right hand panel shows difference density for the three calcium ions coordinated between EC domains (EC2–EC3 chain B). 2Fo-Fc (blue) and Fo-Fc maps (green/red) are shown contoured at 1.0 and ±3.0 sigma, respectively.
e, Exemplar electron density image of the γB4EC1–6 crystal structure after refinement showing the cis-interface (EC5–6 protomer is colored pink, EC6-only protomer is colored yellow). 2Fo-Fc (blue) and Fo-Fc maps (green/red) are shown contoured at 1.0 and ±3.0 sigma, respectively.
Extended Data Figure 2: Comparison between the γB4EC1–6 crystal structure and γB-Pcdh fragment structures reveals formation of the zipper-assembly does not require large conformational changes.
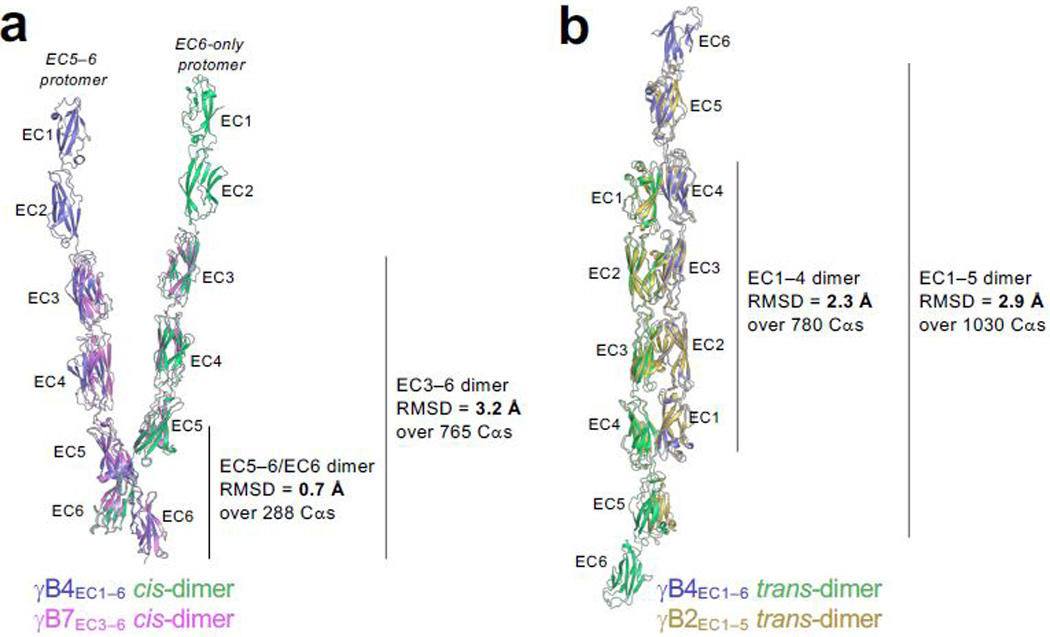
a, Structural superposition of the γB4EC1–6 cis-dimer from the crystal structure (one protomer in slate ribbon, the other green) with the γB7EC3–6 fragment cis-dimer structure (PDB: 5V5X; pink ribbon) showing the overall similarity between the two structures particularly in the EC5–6/EC6 cis-interacting regions.
b, Structural superposition of the γB4EC1–6 trans-dimer from the crystal structure (slate/green ribbon) with the γB2EC1–5 fragment trans-dimer structure (PDB: 5T9T; gold ribbon) showing the overall similarity between the trans-dimers.
Extended Data Figure 3: Particle selection and subtomogram averaging of Pcdh γB6 complexes in solution.
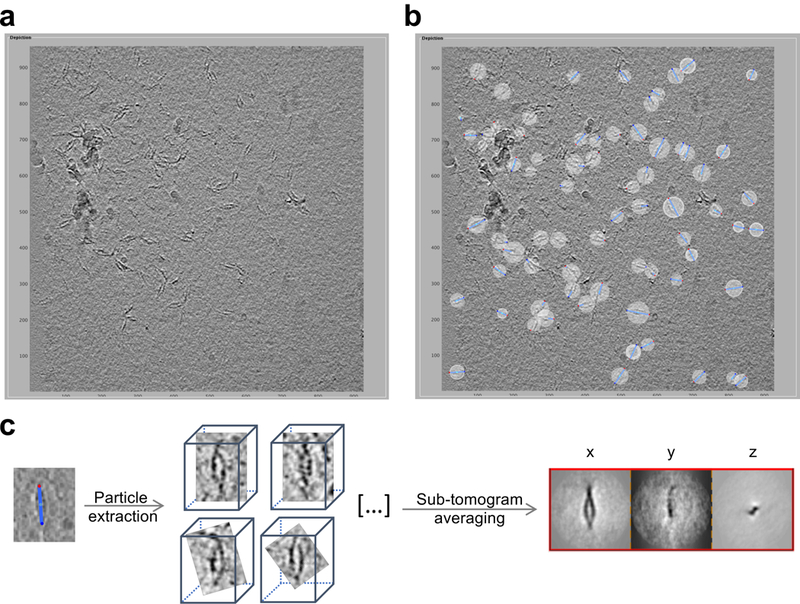
a, Representative tomographic slice showing orientation of γB6EC1–6 complexes in vitreous ice. Note that ‘front views’ are predominant, and represent a preferred orientation. Scale indicates nm.
b, Complexes in the ice are selected as dipole sets (blue sticks). For each particle ‘north’, ‘center’ and ‘south’ points are marked as blue, cyan and red spheres, respectively. Scale indicates nm.
c, Sub-volumes of pre-oriented particles were extracted from tomograms, sub-tomogram averaging converged and projections of last iteration are shown on the right.
Extended Data Figure 4: 2D cryo-electron microscopy of γB6EC1–6 in solution.
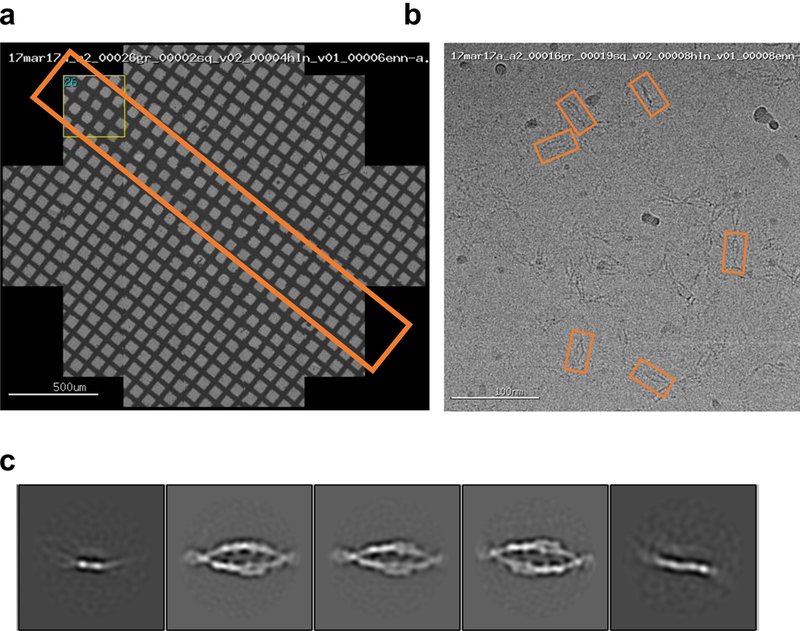
a, Representative grid atlas of a grid prepared using spot-it-on. Orange box highlights the path of sample deposition.
b, Representative micrograph of γB6EC1–6 in vitreous ice. Individual EC domains are distinguishable within the ellipsoid particles. Orange boxes indicate presentative particles.
c, 2D class averages calculated using Relion show highly preferred orientation of γB6EC1–6 in the ice. Five separate class averages are shown.
Extended Data Figure 5: Structural comparisons of the dimer-of-dimers model from single particle cryo-EM with crystallographic cis and trans dimers.
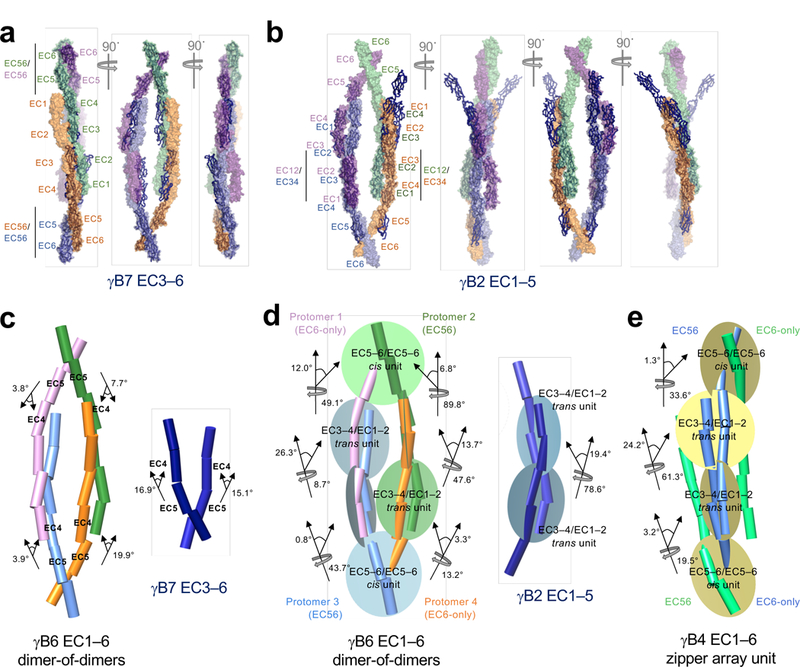
a, Crystallographic cis dimers of γB7EC3–6 (blue ribbon) were aligned with the dimer-of-dimers model (space fill, colors as shown in Fig.1) over the EC5–6 cis-dimer regions derived from γB7EC3–6 (black bars). The EC4/EC5 linker regions appear to accommodate a high degree of structural variation.
b, Crystallographic γB2EC1–5 trans dimers (blue ribbon) were aligned with the manually positioned EC1–2:EC3–4 dimer fragments (black bars) in the dimer-of-dimers density. Deviations derive from differences in rotation and bend at the EC2–3 and EC3–4 linker regions within the antiparallel EC1–4 trans dimers.
c, Comparison of the EC4:5 interdomain deflection angles between the dimer-of-dimers model (left) and the crystallographic γB7EC3–6 cis dimer (right), highlighting the variations between them. Individual EC domains were defined as axes in UCSF chimera and are shown as cylinders. All interdomain deflection angles are listed in Extended Data Table 2.
d, The dimer-of-dimers model was assembled by rigid-body fitting into cryo-ET density of four-domain trans (EC1–2/EC3–4) and cis (EC5–6/EC5–6) units from the γB2EC1–5 and γB7EC3–6 crystal structures, respectively. The figure depicts the deflection and rotational angles between these docked units in the final dimer-of-dimers model (left) compared with those in the γB2EC1–5 trans dimer (right), highlighting the conformational change required within the EC1–4 trans interaction to facilitate formation of the dimer-of-dimers.
e, Deflection and rotational angles between EC5–6/EC5–6 cis-interaction and the EC3–4/EC1–2 trans-interaction units in the repeating unit of the crystallographic γB4EC1–6 zipper array for comparison to the dimer-of-dimers model.
Extended Data Figure 6: Data collection strategy for assessing protein assemblies formed by clustered protocadherins between liposomes.
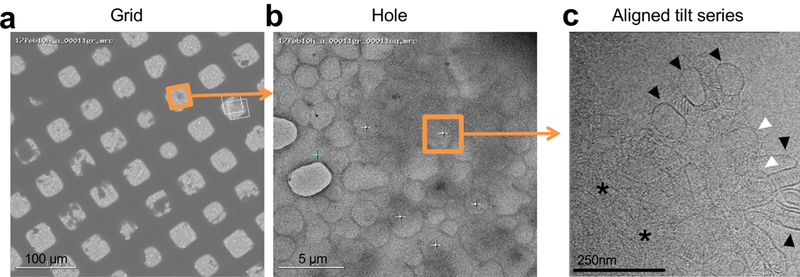
a, Grid-view of protein-liposome aggregates (dark shadows) deposited on lacey carbon grids, 300 copper mesh.
b, Hole-view of the boxed area shown in a. Protein-liposome aggregates can be seen as dark shadows. Tilt-series collection of liposome aggregates over lacey carbon holes in thin ice (orange square). White crosses represent other data collection sites, cyan cross represents focus target.
c, Tilt image collected at the region highlighted in b. A single layer of liposomes coated in protocadherin density (black arrow head), liposomes stacked on top of each other (white arrow head), and, in addition, thick layers of stacked liposomes (asterisk) are visible in the image. Note that membranes at liposome contact sites appear parallel, and Pcdh density appears to be ordered. See Supplementary Video 2 for the reconstructed tomogram.
Extended Data Figure 7: Pcdh zippers from the γB4EC1–6 crystal structure match the ordered linear arrays observed for γB6EC1–6 on membranes.
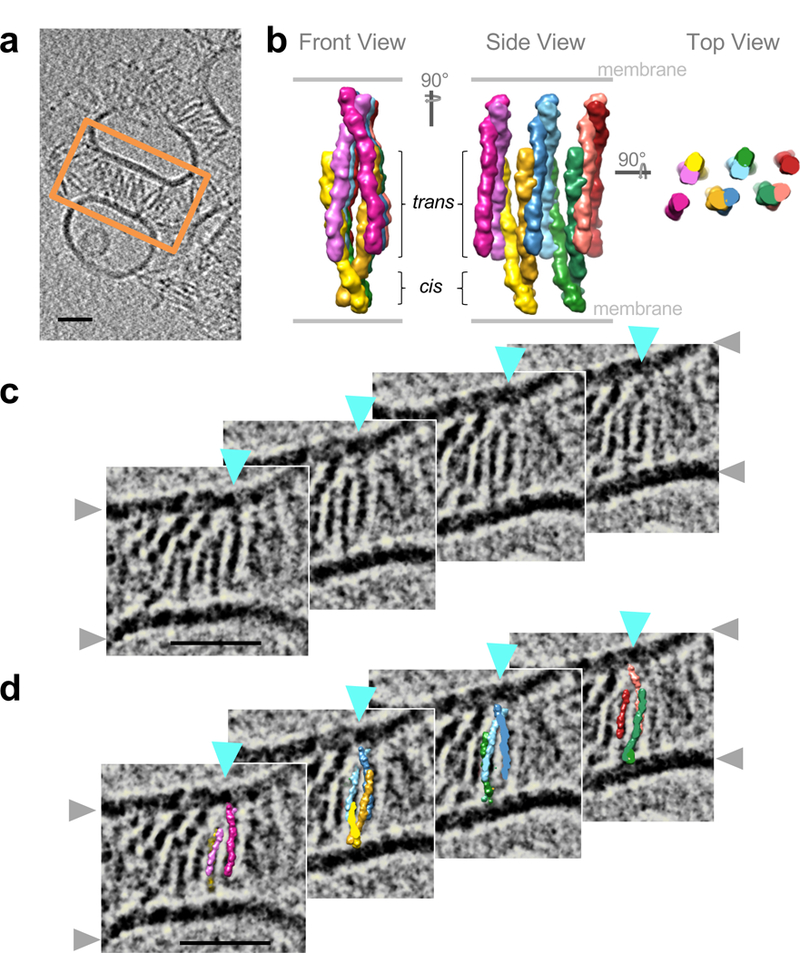
a, Tomographic slice through a reconstructed tomogram of adherent γB6EC1–6-coated liposomes. Region of tomographic slices shown as close-up views in c and d is highlighted by an orange box.
b, Molecular surface views of the γB4EC1–6 crystal lattice arrangement in three orientations. Each protomer is colored in a different color.
c, Tomographic slices spanning 143 Å into the depth of the tomogram, one linear array progressing into the plane of the tomogram is indicated by cyan arrow heads. Grey arrowheads indicate lipid bilayers.
d, Crystallographic γB4EC1–6 zipper fitted consisting of five consecutive cis dimers into the cryo-ET density of the marked γB6EC1–6 array (cyan arrow heads) observed between membranes. Compare density and structure fit between panels in c and d. Protomers colored as in b.Scale bars: 350 Å
Extended Data Figure 8: Automated tomogram annotation of Pcdh density and membranes.
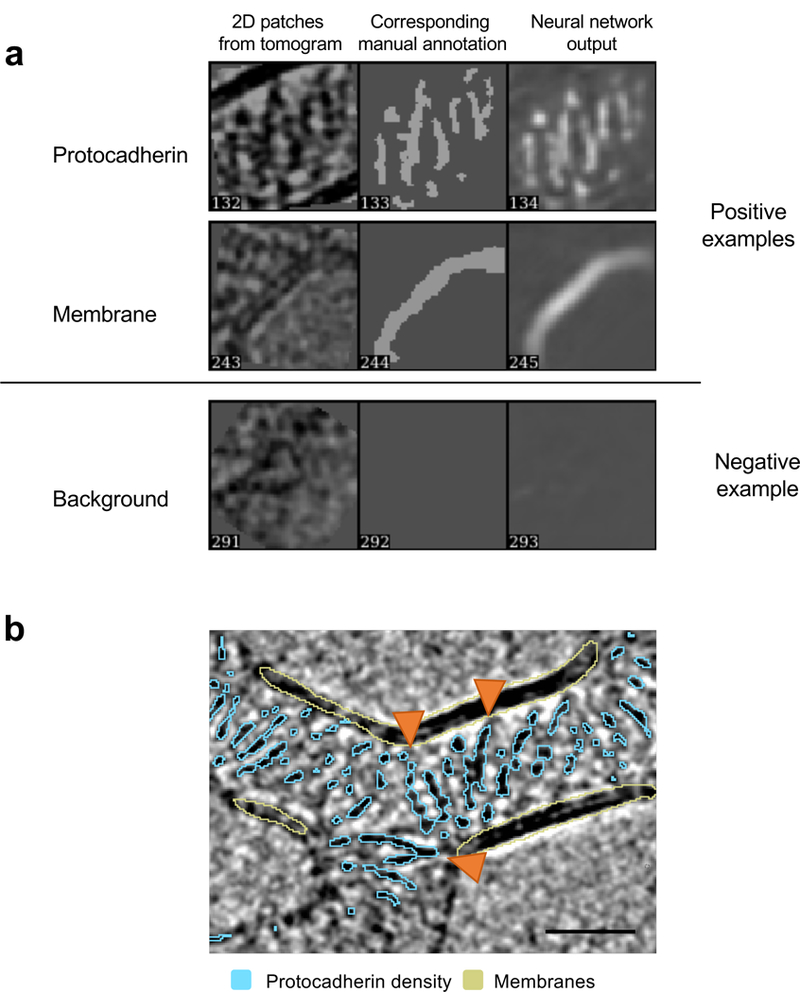
a, Training and annotation of protein density and lipid bilayers. Examples of representative 2D positive (top two panels) and negative (bottom panel) annotations are shown. Regions of interest on a tomographic slice are shown on the left and manual annotation in middle panels identify positive (white particles on black background) features (top two panels). Output after the training is shown on the right. Representative negative example shown in the bottom panel, in which no features are annotated by the trained neural network.
b, Annotated tomographic slice. Pcdh density is shown in cyan, membranes in pastel yellow. Orange arrow heads indicate single protomers to highlight examples for domain level resolution of annotation. Scale bar: 350 Å.
Extended Data Table 1: X-ray crystallography data collection and refinement statistics.
Values in parentheses are for the outer shell. APS, Advanced Photon Source, Argonne National Lab; A.S.U., asymmetric unit; R.m.s., Root mean square. See Extended Data Figure 1 and Methods for further details on the ellipsoidal resolution limits.
| PcdhγB4EC1–6 | ||
|---|---|---|
| Data collection | ||
| Date | 12/0½016 | |
| Beamline | APS 24ID-C | |
| Wavelength (A) | 0.97919 | |
| Space group | P21 | |
| Cell dimensions | ||
| a, b, c (A) | 127.73, 87.58, 149.33 | |
| a, P, Y (°) | 90, 109.94, 90 | |
| Spherical resolution limits | Ellipsoidal resolution limits | |
| Resolution (A) | 40.00–4.50 (5.03–4.50) | 40–6.0/6.8/4.5 (5.05–4.52) |
| No. of reflections | 49398 (13826) | 24717 (966) |
| Unique reflections | 17427 (4999) | 8694 (317) |
| Rmerge | 0.207 (1.921) | 0.112 (0.173) |
| Rmeas | 0.254 (2.366) | 0.138 (0.211) |
| Rpim | 0.145 (1.359) | 0.078 (0.119) |
| CC(½) | 0.993 (0.741) | 0.995 (0.973) |
| I/σI | 2.7 (0.6) | 5.2 (5.7) |
| Spherical completeness (%) | 93.8 (94.9) | 46.7 (5.6) |
| Ellipsoidal completeness (%) | 93.6 (97.2) | |
| Redundancy | 2.8 (2.8) | 2.8 (3.0) |
| Refinement | ||
| Resolution (A) | 40–6.0/6.8/4.5 | |
| Unique reflections | 8683 | |
| Completeness in diffracting ellipsoid (%) | 93.4 | |
| Rwork / Rfree (%) | 23.1 / 27.7 | |
| Molecules in A.S.U. | 2 | |
| Number of atoms | ||
| Protein | 9489 | |
| Ligand/Ion | 253 | |
| Water | 0 | |
| B-factors | ||
| Protein | 138.19 | |
| Ligand/Ion | 157.81 | |
| Water | 0 | |
| R.m.s. deviations | ||
| Bond lengths (Å) | 0.002 | |
| Bond angles (°) | 0.565 | |
| Ramachandran Favored (%) | ||
| Favored (%) | 96.96 | |
| Allowed (%) | 3.04 | |
| Outliers (%) | 0.00 | |
| Rotamer outliers (%) | 0.67 | |
| Wilson B | 66.09 | |
| PDB ID | 6E6B | |
Extended Data Table 2: Interdomain angles.
Interdomain deflection angles between consecutive EC domains are given as the deviation from 180°. Angles were calculated using UCSF chimera. The γB2EC1–5, γB3EC1–4, γB7EC1–4 crystal form 1, γB7EC1–4 crystal form 2, and γB7EC3–6 structures correspond to PDBs: 5T9T, 5K8R, 5SZO, 5SZP, and 5V5X. *The dimer-of-dimers model was generated using four-domain rigid interaction units—four copies of EC12:EC34 from γB2EC1–5 and the two EC56:EC56 units from the γB7EC3–6 crystal structure—therefore the EC1:EC2, EC3:EC4, and EC5:EC6 angles are unchanged.
| Interdomain angles | EC1:EC2 (°) | EC2:EC3 (°) | EC3:EC4 (°) | EC4:EC5 (°) | EC5:EC6 (°) |
|---|---|---|---|---|---|
| γB-Pcdh trans-dimer structures | |||||
| γB2EC1-5 chain A | 19.9 | 9.5 | 15.7 | 13.9 | |
| γB2EC1-5 chain B | 21.5 | 9 | 15.4 | 16.3 | |
| γB3EC1-4 | 8.6 | 11.3 | 17.2 | ||
| γB7EC1-4 crystal form 1 chain A | 11.2 | 5 | 13.2 | ||
| γB7EC1-4 crystal form 1 chain B | 11.2 | 8.2 | 13.4 | ||
| γB7EC1-4 crystal form 2 chain A | 5.2 | 3.7 | 8.5 | ||
| γB7EC1-4 crystal form 2 chain B | 13.6 | 6.9 | 14.6 | ||
| Average γB frans dimer | 13.0 ± 5.9 | 7.7 ± 2.6 | 14.0 ± 2.8 | 15.1 ± 1.7 | |
| γB7 cis-dimer structure | |||||
| γB7EC3–6 chain A (EC6-only) | 8.1 | 15.1 | 12.5 | ||
| γB7EC3–6 chain D (EC5–6) | 8.5 | 16.9 | 14.6 | ||
| γB7EC3–6 chain B (EC5–6) | 14.8 | 15.3 | 19.1 | ||
| γB7EC3–6 chain C (EC6-only) | 11.3 | 14.3 | 11 | ||
| Average γB7 cis dimer | 10.7 ± 3.1 | 15.4 ± 1.1 | 14.3 ± 3.5 | ||
| γB4 zipper crystal structure | |||||
| γB4EC1–6 chain A (EC6-only) | 6.7 | 6.7 | 11 | 19.8 | 16.7 |
| γB4EC1–6 chain B (EC5–6) | 6.6 | 4.4 | 9.7 | 14.3 | 18.8 |
| Average γB4 zipper | 6.7 ± 0.1 | 5.6 ± 1.6 | 10.4 ± 0.9 | 17.1 ± 3.9 | 17.8 ± 1.5 |
| Sinale particle cryo-ET yB6 dimer-of-dimers model | |||||
| γB6EC1–6 protomer 1 (EC6-only) | 21.5 | 15.5 | 15.7 | 3.8 | 12.5 |
| γB6EC1–6 protomer 2 (EC5–6) | 21.5 | 5.1 | 15.7 | 7.7 | 14.6 |
| γB6EC1–6 protomer 3 (EC5–6) | 21.5 | 30.5 | 15.7 | 3.9 | 19.1 |
| γB6EC1–6 protomer 4 (EC6-only) | 21.5 | 23.3 | 15.7 | 19.9 | 11.0 |
| Average dimer-of-dimers | 21.5 ± 0.0* | 18.6 ± 10.9 | 15.7 ± 0.0* | 8.8 ± 7.6 | 14.3 ± 3.5* |
Supplementary Material
Acknowledgements
We thank D. Neau, S. Banerjee, and S. Narayanasami for help with synchrotron data collection conducted at the APS NE-CAT 24-ID-C beamline, supported by National Institutes of Health (NIH) P41GM103403. We acknowledge support from a National Science Foundation grant (MCB-1412472) to B.H., an NIH grants (R01MH114817) to T.M. and L.S., (F32GM128303) to A.J.N, and (R01GM081871) to B.B. Electron microscopy was performed at the Simons Electron Microscopy Center (SEMC) and National Resource for Automated Molecular Microscopy located at the New York Structural Biology Center, supported by grants from the Simons Foundation (SF349247), NYSTAR, and NIH (GM103310 and OD019994) and from Agouron Institute (F00316). We thank E. Eng and L.Y. Yen for technical support at SEMC.
Footnotes
Author Information
Authors declare no competing interests. Readers are welcome to comment of the online version of the paper. Correspondence and requests for materials should be addressed to B.H. (bh6@cumc.columbia.edu) or L.S. (lss8@columbia.edu).
Supplementary Information is available in the online version of the paper.
References
- 1.Zipursky SL & Grueber WB in Annual Review of Neuroscience, Vol 36 Vol. 36 Annual Review of Neuroscience; (ed Hyman SE) 547–568 (2013). [DOI] [PubMed] [Google Scholar]
- 2.Lefebvre JL, Kostadinov D, Chen WV, Maniatis T & Sanes JR Protocadherins mediate dendritic self-avoidance in the mammalian nervous system. Nature 488, 517–521, doi: 10.1038/nature11305 (2012). [DOI] [PMC free article] [PubMed] [Google Scholar]
- 3.Molumby MJ, Keeler AB & Weiner JA Homophilic Protocadherin Cell-Cell Interactions Promote Dendrite Complexity. Cell Reports 15, 1037–1050, doi: 10.1016/j.celrep.2016.03.093 (2016). [DOI] [PMC free article] [PubMed] [Google Scholar]
- 4.Kostadinov D & Sanes JR Protocadherin-dependent dendritic self-avoidance regulates neural connectivity and circuit function. Elife 4, doi: 10.7554/eLife.08964 (2015). [DOI] [PMC free article] [PubMed] [Google Scholar]
- 5.Mountoufaris G et al. Multicluster Pcdh diversity is required for mouse olfactory neural circuit assembly. Science 356, 411–414, doi: 10.1126/science.aai8801 (2017). [DOI] [PMC free article] [PubMed] [Google Scholar]
- 6.Wu Q & Maniatis T A striking organization of a large family of human neural cadherin-like cell adhesion genes. Cell 97, 779–790, doi: 10.1016/s0092-8674(00)80789-8 (1999). [DOI] [PubMed] [Google Scholar]
- 7.Wu Q et al. Comparative DNA sequence analysis of mouse and human protocadherin gene clusters. Genome Research 11, 389–404, doi: 10.1101/gr.167301 (2001). [DOI] [PMC free article] [PubMed] [Google Scholar]
- 8.Zipursky SL & Sanes JR Chemoaffinity Revisited: Dscams, Protocadherins, and Neural Circuit Assembly. Cell 143, 343–353, doi: 10.1016/j.cell.2010.10.009 (2010). [DOI] [PubMed] [Google Scholar]
- 9.Yagi T Molecular codes for neuronal individuality and cell assembly in the brain. Frontiers in Molecular Neuroscience 5, doi: 10.3389/fnmol.2012.00045 (2012). [DOI] [PMC free article] [PubMed] [Google Scholar]
- 10.Thu CA et al. Single-Cell Identity Generated by Combinatorial Homophilic Interactions between alpha, beta, and gamma Protocadherins. Cell 158, 1045–1059, doi: 10.1016/j.cell.2014.07.012 (2014). [DOI] [PMC free article] [PubMed] [Google Scholar]
- 11.Rubinstein R, Goodman KM, Maniatis T, Shapiro L & Honig B Structural origins of clustered protocadherin-mediated neuronal barcoding. Seminars in Cell & Developmental Biology 69, 140–150, doi: 10.1016/j.semcdb.2017.07.023 (2017). [DOI] [PMC free article] [PubMed] [Google Scholar]
- 12.Toyoda S et al. Developmental Epigenetic Modification Regulates Stochastic Expression of Clustered Protocadherin Genes, Generating Single Neuron Diversity. Neuron 82, 94–108, doi: 10.1016/j.neuron.2014.02.005 (2014). [DOI] [PubMed] [Google Scholar]
- 13.Ing-Esteves S et al. Combinatorial Effects of Alpha- and Gamma-Protocadherins on Neuronal Survival and Dendritic Self-Avoidance. The Journal of Neuroscience 38, 2713–2729, doi: 10.1523/jneurosci.3035-17.2018 (2018). [DOI] [PMC free article] [PubMed] [Google Scholar]
- 14.Schreiner D & Weiner JA Combinatorial homophilic interaction between gamma-protocadherin multimers greatly expands the molecular diversity of cell adhesion. Proceedings of the National Academy of Sciences of the United States of America 107, 14893–14898, doi: 10.1073/pnas.1004526107 (2010). [DOI] [PMC free article] [PubMed] [Google Scholar]
- 15.Rubinstein R et al. Molecular Logic of Neuronal Self-Recognition through Protocadherin Domain Interactions. Cell 163, 629–642, doi: 10.1016/j.cell.2015.09.026 (2015). [DOI] [PMC free article] [PubMed] [Google Scholar]
- 16.Nicoludis JM et al. Structure and Sequence Analyses of Clustered Protocadherins Reveal Antiparallel Interactions that Mediate Homophilic Specificity. Structure 23, 2087–2098, doi: 10.1016/j.str.2015.09.005 (2015). [DOI] [PMC free article] [PubMed] [Google Scholar]
- 17.Goodman KM et al. Structural Basis of Diverse Homophilic Recognition by Clustered alpha- and beta-Protocadherins. Neuron 90, 709–723, doi: 10.1016/j.neuron.2016.04.004 (2016). [DOI] [PMC free article] [PubMed] [Google Scholar]
- 18.Goodman KM et al. γ-Protocadherin structural diversity and functional implications. eLife 5, e20930, doi: 10.7554/eLife.20930 (2016). [DOI] [PMC free article] [PubMed] [Google Scholar]
- 19.Nicoludis JM et al. Antiparallel protocadherin homodimers use distinct affinity- and specificity-mediating regions in cadherin repeats 1–4. eLife 5 (2016). [DOI] [PMC free article] [PubMed] [Google Scholar]
- 20.Goodman KM et al. Protocadherin cis-dimer architecture and recognition unit diversity. Proceedings of the National Academy of Sciences 114, E9829–E9837, doi: 10.1073/pnas.1713449114 (2017). [DOI] [PMC free article] [PubMed] [Google Scholar]
- 21.Noble AJ et al. Routine single particle CryoEM sample and grid characterization by tomography. eLife 7, e34257, doi: 10.7554/eLife.34257 (2018). [DOI] [PMC free article] [PubMed] [Google Scholar]
- 22.Harrison OJ et al. The Extracellular Architecture of Adherens Junctions Revealed by Crystal Structures of Type I Cadherins. Structure 19, 244–256, doi: 10.1016/j.str.2010.11.016 (2011). [DOI] [PMC free article] [PubMed] [Google Scholar]
- 23.Schalm SS, Ballif BA, Buchanan SM, Phillips GR & Maniatis T Phosphorylation of protocadherin proteins by the receptor tyrosine kinase Ret. Proceedings of the National Academy of Sciences of the United States of America 107, 13894–13899, doi: 10.1073/pnas.1007182107 (2010). [DOI] [PMC free article] [PubMed] [Google Scholar]
- 24.Suo L, Lu H, Ying G, Capecchi MR & Wu Q Protocadherin clusters and cell adhesion kinase regulate dendrite complexity through Rho GTPase. Journal of Molecular Cell Biology 4, 362–376, doi: 10.1093/jmcb/mjs034 (2012). [DOI] [PubMed] [Google Scholar]
- 25.Keeler AB, Schreiner D & Weiner JA Protein Kinase C Phosphorylation of a γ-Protocadherin C-terminal Lipid Binding Domain Regulates Focal Adhesion Kinase Inhibition and Dendrite Arborization. Journal of Biological Chemistry 290, 20674–20686, doi: 10.1074/jbc.M115.642306 (2015). [DOI] [PMC free article] [PubMed] [Google Scholar]
- 26.Mah KM & Weiner JA Regulation of Wnt signaling by protocadherins. Seminars in Cell & Developmental Biology 69, 158–171, doi: 10.1016/j.semcdb.2017.07.043 (2017). [DOI] [PMC free article] [PubMed] [Google Scholar]
- 27.Fan L et al. Alpha protocadherins and Pyk2 kinase regulate cortical neuron migration and cytoskeletal dynamics via Rac1 GTPase and WAVE complex in mice. eLife 7, e35242, doi: 10.7554/eLife.35242 (2018). [DOI] [PMC free article] [PubMed] [Google Scholar]
- 28.Haas IG, Frank M, Veron N & Kemler R Presenilin-dependent processing and nuclear function of gamma-protocadherins. The Journal of biological chemistry 280, 9313–9319, doi: 10.1074/jbc.M412909200 (2005). [DOI] [PubMed] [Google Scholar]
- 29.Petersen TN, Brunak S, von Heijne G & Nielsen H SignalP 4.0: discriminating signal peptides from transmembrane regions. Nat Meth 8, 785–786, doi:http://www.nature.com/nmeth/journal/v8/n10/abs/nmeth.1701.html#supplementary-information (2011). [DOI] [PubMed] [Google Scholar]
- 30.Kabsch W XDS. Acta Crystallographica Section D: Biological Crystallography 66, 125–132, doi: 10.1107/S0907444909047337 (2010). [DOI] [PMC free article] [PubMed] [Google Scholar]
- 31.Strong M et al. Toward the structural genomics of complexes: Crystal structure of a PE/PPE protein complex from Mycobacterium tuberculosis. Proceedings of the National Academy of Sciences of the United States of America 103, 8060–8065, doi: 10.1073/pnas.0602606103 (2006). [DOI] [PMC free article] [PubMed] [Google Scholar]
- 32.McCoy AJ et al. Phaser crystallographic software. Journal of Applied Crystallography 40, 658–674, doi: 10.1107/S0021889807021206 (2007). [DOI] [PMC free article] [PubMed] [Google Scholar]
- 33.Adams PD et al. PHENIX: a comprehensive Python-based system for macromolecular structure solution. Acta Crystallographica Section D: Biological Crystallography 66, 213–221, doi: 10.1107/S0907444909052925 (2010). [DOI] [PMC free article] [PubMed] [Google Scholar]
- 34.Emsley P, Lohkamp B, Scott WG & Cowtan K Features and development of Coot. Acta Crystallographica Section D: Biological Crystallography 66, 486–501, doi: 10.1107/S0907444910007493 (2010). [DOI] [PMC free article] [PubMed] [Google Scholar]
- 35.Pettersen EF et al. UCSF Chimera—A visualization system for exploratory research and analysis. Journal of Computational Chemistry 25, 1605–1612, doi: 10.1002/jcc.20084 (2004). [DOI] [PubMed] [Google Scholar]
- 36.Jain T, Sheehan P, Crum J, Carragher B & Potter CS Spotiton: A prototype for an integrated inkjet dispense and vitrification system for cryo-TEM. Journal of Structural Biology 179, 68–75, doi: 10.1016/j.jsb.2012.04.020 (2012). [DOI] [PMC free article] [PubMed] [Google Scholar]
- 37.Dandey VP et al. Spotiton: New features and applications. Journal of Structural Biology 202, 161–169, doi: 10.1016/j.jsb.2018.01.002 (2018). [DOI] [PMC free article] [PubMed] [Google Scholar]
- 38.Wei H et al. Optimizing “self-wicking” nanowire grids. Journal of Structural Biology 202, 170–174, doi: 10.1016/j.jsb.2018.01.001 (2018). [DOI] [PMC free article] [PubMed] [Google Scholar]
- 39.Razinkov I et al. A new method for vitrifying samples for cryoEM. Journal of Structural Biology 195, 190–198, doi: 10.1016/j.jsb.2016.06.001 (2016). [DOI] [PMC free article] [PubMed] [Google Scholar]
- 40.Suloway C et al. Automated molecular microscopy: The new Leginon system. Journal of Structural Biology 151, 41–60, doi: 10.1016/j.jsb.2005.03.010 (2005). [DOI] [PubMed] [Google Scholar]
- 41.Suloway C et al. Fully automated, sequential tilt-series acquisition with Leginon. Journal of Structural Biology 167, 11–18, doi: 10.1016/j.jsb.2009.03.019 (2009). [DOI] [PMC free article] [PubMed] [Google Scholar]
- 42.Zheng SQ et al. MotionCor2: anisotropic correction of beam-induced motion for improved cryo-electron microscopy. Nature Methods 14, 331, doi:10.1038/nmeth.419310.1038/nmeth.4193https://www.nature.com/articles/nmeth.4193#supplementary-informationhttps://www.nature.com/articles/nmeth.4193#supplementary-information (2017). [DOI] [PMC free article] [PubMed] [Google Scholar]
- 43.Noble AJ & Stagg SM Automated batch fiducial-less tilt-series alignment in Appion using Protomo. Journal of Structural Biology 192, 270–278, doi: 10.1016/j.jsb.2015.10.003 (2015). [DOI] [PMC free article] [PubMed] [Google Scholar]
- 44.Lander GC et al. Appion: An integrated, database-driven pipeline to facilitate EM image processing. Journal of Structural Biology 166, 95–102, doi: 10.1016/j.jsb.2009.01.002 (2009). [DOI] [PMC free article] [PubMed] [Google Scholar]
- 45.Winkler H & Taylor KA Accurate marker-free alignment with simultaneous geometry determination and reconstruction of tilt series in electron tomography. Ultramicroscopy 106, 240–254, doi: 10.1016/j.ultramic.2005.07.007 (2006). [DOI] [PubMed] [Google Scholar]
- 46.Agulleiro JI & Fernandez JJ Fast tomographic reconstruction on multicore computers. Bioinformatics 27, 582–583, doi: 10.1093/bioinformatics/btq692 (2011). [DOI] [PubMed] [Google Scholar]
- 47.Agulleiro J-I & Fernandez J-J Tomo3D 2.0 – Exploitation of Advanced Vector eXtensions (AVX) for 3D reconstruction. Journal of Structural Biology 189, 147–152, doi: 10.1016/j.jsb.2014.11.009 (2015). [DOI] [PubMed] [Google Scholar]
- 48.Grant T & Grigorieff N Measuring the optimal exposure for single particle cryo-EM using a 2.6 Å reconstruction of rotavirus VP6. eLife 4, e06980, doi: 10.7554/eLife.06980 (2015). [DOI] [PMC free article] [PubMed] [Google Scholar]
- 49.Castaño-Díez D, Kudryashev M, Arheit M & Stahlberg H Dynamo: A flexible, user-friendly development tool for subtomogram averaging of cryo-EM data in high-performance computing environments. Journal of Structural Biology 178, 139–151, doi: 10.1016/j.jsb.2011.12.017 (2012). [DOI] [PubMed] [Google Scholar]
- 50.Castaño-Díez D, Kudryashev M & Stahlberg H Dynamo Catalogue: Geometrical tools and data management for particle picking in subtomogram averaging of cryo-electron tomograms. Journal of Structural Biology 197, 135–144, doi: 10.1016/j.jsb.2016.06.005 (2017). [DOI] [PubMed] [Google Scholar]
- 51.Bepler T et al. Positive-unlabeled convolutional neural networks for particle picking in cryo-electron micrographs. Research in computational molecular biology, Annual International Conference, RECOMB proceedings 10812, 245–247 (2018). [PMC free article] [PubMed] [Google Scholar]
- 52.Kimanius D, Forsberg BO, Scheres SHW & Lindahl E Accelerated cryo-EM structure determination with parallelisation using GPUs in RELION-2. eLife 5, e18722, doi: 10.7554/eLife.18722 (2016). [DOI] [PMC free article] [PubMed] [Google Scholar]
- 53.Chen M et al. Convolutional neural networks for automated annotation of cellular cryo-electron tomograms. Nature Methods 14, 983, doi:10.1038/nmeth.440510.1038/nmeth.4405https://www.nature.com/articles/nmeth.4405#supplementary-informationhttps://www.nature.com/articles/nmeth.4405#supplementary-information (2017). [DOI] [PMC free article] [PubMed] [Google Scholar]
Associated Data
This section collects any data citations, data availability statements, or supplementary materials included in this article.
Supplementary Materials
Data Availability Statement
Crystallographic atomic coordinates and structure factors have been deposited in the protein data bank with accession code PDB: 6E6B. Binned by four or two tomograms of the single-particle and Pcdh-liposome datasets were deposited in the Electron Microscopy Data bank (EMDB) with accession codes: EMD-9197, EMD-9198, EMD-9199 and EMD-9200. Unaligned tilt-series images, Appion-Protomo tilt-series alignment runs, and aligned tilt-series stacks were deposited to the Electron Microscopy Pilot Image Archive (EMPIAR) with accession codes: EMPIAR-10234, EMPIAR-10235, EMPIAR-10236, EMPIAR-10237, and EMPIAR-10238.


