Abstract
Background
Little is known about how the tumor immune microenvironment (TIME) is modulated in recurrent soft tissue sarcomas (STS).
Methods
We evaluated CD8+ T cells, CD20+ B cells, Foxp3+ regulatory T cells (Tregs), and programmed cell death ligand 1 (PD-L1) in 72 paired pre-recurrent (1st resected) versus post-recurrent (2nd resected) STS by immunohistochemistry. Correlations with time to recurrence and prognosis were determined.
Results
We found that CD8, PD-L1, CD20, and Foxp3-positive cell counts changed in post-recurrent STS. PD-L1-positive tumor cell and lymphocyte counts increased in post-recurrent STS, whereas CD8+ T cell counts decreased. Changes in CD8+ T cell, CD20+ B cell, and PD-L1+ lymphocyte counts were associated with the time interval between surgeries. At admission, fewer CD8+ T cells were detected in patients with relapse than in newly diagnosed patients. Furthermore, post-recurrent STS with fewer CD8+ T cells compared with pre-recurrent STS were more likely to exhibit re-recurrence. The change in CD8+ T cells was positively associated with overall survival. In multivariate analyses, a decrease in CD8+ T cell counts in post-recurrent STS was an independent unfavorable prognostic factor.
Conclusions
The TIME differs between pre-recurrent STS and post-recurrent STS. The variation in CD8+ T cells and PD-L1 positivity may have essential roles during tumor relapse and provides a basis for determining therapeutic strategies.
Keywords: Soft tissue sarcomas (STS), recurrence, CD8, programmed cell death ligand 1 (PD-L1), tumor immune microenvironment (TIME)
Introduction
Soft tissue sarcomas (STS) represent a heterogeneous group of mesenchymal malignancies accounting for approximately 1% of all cancers in adult patients. Despite the benefits of conventional chemotherapy and radiotherapy in patients with advanced STS, surgery is still the mainstay of treatment. However, approximately 50% of cases that are completely resected develop recurrence (1), frequently leading to unresectable STS, limb dysfunction, or amputation.
Tumor-infiltrating lymphocytes (TILs) and programmed cell death ligand 1 (PD-L1) positivity have predictive (2,3), therapeutic (4), and prognostic value (5) in various tumors. For example, the administration of CD8+ T cells targeting mutant KRAS G12D leads to tumor regression in metastatic colorectal cancer (4). In a mouse model of adoptive T cell therapy for melanoma, Runx3 overexpression enhances TIL abundance, leading to reduced tumor growth and increased survival (6). For immunotherapy by the blockade of immune checkpoints, PD-L1 positivity in tumor cells enriches for populations with high probabilities of a clinical benefit; patients with PD-L1-positive tumors have a higher response rate than patients with the PD-L1-negative phenotype (7). However, little is known about the roles of TILs in the process of tumor relapse, which limits the development of immunotherapeutic strategies.
In terms of TILs in STS, studies have shown that CD8+ T cells, PD-L1+ lymphocytes, CD20+ B cells, and Foxp3+ regulatory T cells (Tregs) are useful prognostic biomarkers (8-11). However, the effect of the tumor immune microenvironment (TIME), including variation in TILs and PD-L1 positivity, has not been characterized in recurrent STS. CD8+ T cells and CD20+ B cells are predicted to positively mediate the immune response against tumors, whereas Tregs and PD-L1-positive cells suppress the immune response. In this study, we compared TILs (CD8+ T cells, CD20+ B cells, and Tregs) and PD-L1 positivity in 72 paired locally pre-recurrent and post-recurrent STS cases. Our results provide important insights into modulations in the TIME in recurrent STS.
Methods
Patients
The medical records of all patients who underwent complete local resection twice for paired pre-recurrent (1st resected) and post-recurrent (2nd resected) STS at Fudan University Shanghai Cancer Center from January 2008 to April 2017 were retrospectively reviewed; the patients with biopsy or partial resection were excluded, 72 patients with R0 or R1 resection were included in this study.
All cases were previously diagnosed as STS by two professional pathologists. The definition of the 1st surgery was as follows: the patient received surgical treatment for the first time in our hospital, regardless of whether the tumor was primary or recurrent (previous surgery in external hospitals). The definition of the 2nd surgery was as follows: the patient underwent another operation due to tumor relapse after the 1st surgery. The 1st surgery was performed from February 2008 to December 2016 for the 72 patients. The 2nd surgery was performed from October 2008 to April 2017 for the same cases. The interval of time was the time between the first and second surgery in our hospital. The follow-up time (from the first surgery to June 2018) was 18–124 months (median: 58 months). Overall survival was defined as time from the first surgery to the time of all-cause death. The overall survival time was 8–124 months at the last time of follow-up. The mean and median survival times were 51 months and 40 months, respectively. Signed informed consent was obtained from all patients, and the study was approved by the Clinical Research Ethics Committee of Fudan University Shanghai Cancer Center (Number: 050432-4-1805C).
Wide surgical margins were defined as wide local resection with free microscopic margins, and non-wide surgical margins were defined as either positive microscopic margins or a tumor that is very close to the microscopic margins. Grading was performed according to the World Health Organization (WHO) Classification of Tumors of the Soft Tissue and Bone. Staging was determined using the 7th edition of the American Joint Committee on Cancer guideline of tumor, node, and metastasis (TNM) classification.
Immunohistochemical (IHC) staining
Formalin-fixed paraffin-embedded STS tissue blocks (72 paired pre-recurrent and post-recurrent STS samples) were obtained from the Pathology of Fudan University Shanghai Cancer Center, and 4-µm-thick serial sections were generated for immunohistochemistry staining according to standard procedures. Slides were deparaffined and rehydrated. Heat-induced epitope retrieval in EDTA buffer at pH 9 (CD8α, PD-L1, Foxp3) or citric acid buffer at pH 6 (CD20) was performed. Endogenous peroxidase activity was blocked by hydrogen peroxide treatment. Following incubation with protein blocking, slides were incubated at 4 °C overnight with a CD8α antibody (1:200, 70306; Cell Signaling Technology), PD-L1 antibody (1:200, E1L3N; Cell Signaling Technology, MA, USA), CD20 antibody (1:200, EP459Y; Abcam, Cambridge, UK), or Foxp3 antibody (1:100, 236A/E7; Abcam). Signal amplification was performed using the IHC Detection Kit (KIT-5920; Fuzhou Maixin Biotechnology, Fujian, China). Negative controls were isotype-matched. Formalin-fixed paraffin-embedded human lung cancer tissues sectioned at 4-µm from Fuzhou Maixin Biotechnology (Fujian, China) were used as a positive control for PD-L1. Additionally, 4-µm-thick slides of formalin-fixed paraffin-embedded human spleen tissues from the Pathology of Fudan University Shanghai Cancer Center were used as a positive control for CD8α, CD20, and Foxp3.
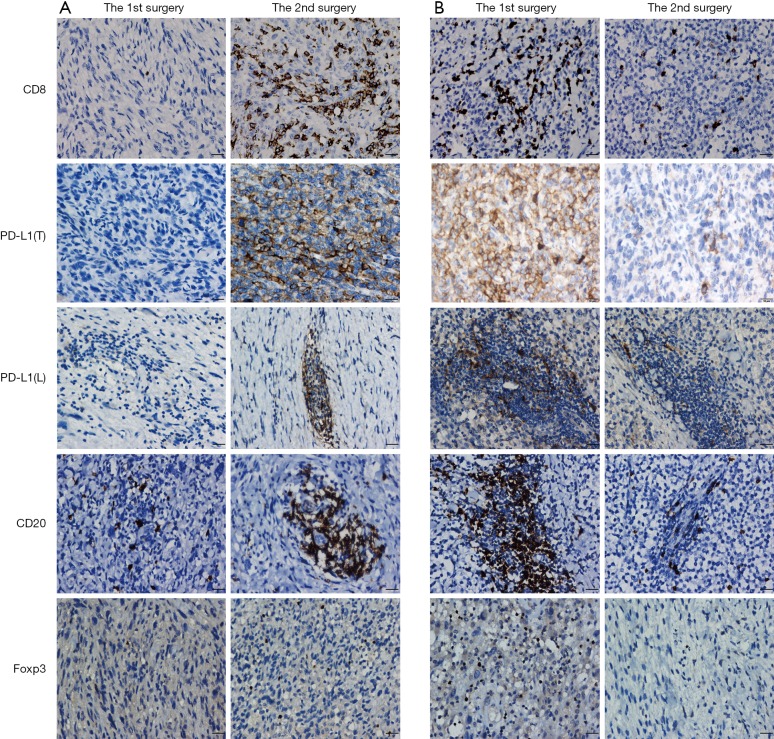
CD8+ and Foxp3+ TILs showed a scattered pattern (Figure 1), and were assessed by counting the absolute number of positive cells per high power field (HPF). Five randomly chosen HPFs (×400) per slide were manually assessed for CD8+ and Foxp3+ TILs and average values were obtained. CD20+ cells were mainly in clusters and quantitated as the lymphocyte subset of CD20+ TILs across the entire tumor area (expressed as percentages). PD-L1 expression on tumor cell membrane and TILs was scored across the entire tumor area as percentages of tumor cell labeling (of any intensity) and TIL labeling (of any intensity), respectively. Quantification was conducted independently by two experienced IHC analysts who were blinded to the clinical data, including whether a given sample was a primary or recurrent tumor; these areas at the tumor invasive front or adjacent to necrosis were not sampled for evaluation. Any discrepancies were resolved by discussion.
Figure 1.
IHC analysis of CD8, PD-L1, CD20, and Foxp3 expression in paired STS between the 1st and 2nd surgery. (A) Increased CD8, PD-L1, CD20, and Foxp3-positive cells were observed in paired STS; (B) decreased CD8, PD-L1, CD20, and Foxp3-positive cells were observed in paired STS. IHC, immunohistochemical; PD-L1, programmed cell death ligand 1; PD-L1(T), PD-L1 in tumor cells; PD-L1(L), PD-L1 in lymphocytes; STS, soft tissue sarcomas. Scale bars =10 µm.
Statistical analysis
Statistical tests were performed using SPSS Statistics 23 (IMB SPSS, Chicago, IL, USA). For paired data, paired t-tests were used. Student’s independent samples t-tests were used for comparisons between groups; if variance ≤0.05, t-tests with Welch’s correction were performed. To investigate the relationships between variables, the non-parametric Spearman correlation was applied. The Kaplan-Meier method was used to estimate overall survival curves, and group differences were analyzed by the log-rank test. A multivariate analysis was performed with the Cox proportional hazards model to assess the impact of each variable on survival. P values were two-tailed and P<0.05 was considered to indicate statistically significant differences.
Results
Patient characteristics
In total, 72 patients with STS who received complete local resection twice with curative intent in our department were included in the study. Of the 72 patients, 13 patients were newly diagnosed at admission and 59 cases were recurrent following previous surgery in external hospitals. The clinicopathological characteristics of the cohort of patients are summarized in Table 1. STS included 21 undifferentiated pleomorphic sarcoma (UPS), 18 myxofibrosarcoma (MFS), 8 fibrosarcoma (FS), 6 liposarcoma (LPS) (5 dedifferentiated LPS, and 1 pleomorphic LPS), 4 leiomyosarcoma (LMS), 4 synovial sarcoma (SS), 2 angiosarcoma (AS), 2 malignant peripheral nerve sheath tumor (MPNST), 1 soft tissue clear cell sarcoma, 1 malignant peripheral primitive neuroectodermal tumor, 1 myxoinflammatory fibroblastic sarcoma, and 4 other STS. In total, 17 patients received chemotherapy and/or radiotherapy after the 1st surgery but before STS recurrence.
Table 1. Characteristics of patients and factors correlated with prognosis.
| Variables | Patient characteristics | n [%] | Univariate analysis | Multivariate analysis | |||||
|---|---|---|---|---|---|---|---|---|---|
| HR | 95% CI | P value | HR | 95% CI | P value | ||||
| Age | ≤60 | 45 [63] | 1.000 | – | – | ||||
| >60 | 27 [37] | 0.558 | 0.265–1.171 | 0.123 | |||||
| Gender | Male | 41 [57] | 1.000 | – | – | ||||
| Female | 31 [43] | 0.568 | 0.276–1.168 | 0.124 | |||||
| Status at admission | Recurrence | 59 [82] | 1.000 | – | – | ||||
| New diagnosis | 13 [18] | 0.719 | 0.278–1.859 | 0.496 | |||||
| Histology | UPS | 21 [29] | 1.000 | – | – | ||||
| MFS | 18 [25] | 0.648 | 0.264–1.590 | 0.343 | |||||
| FS | 8 [11] | 0.535 | 0.151–1.898 | 0.333 | |||||
| LPS | 6 [8] | 1.061 | 0.341–3.303 | 0.918 | |||||
| LMS | 4 [6] | 0.504 | 0.112–2.272 | 0.373 | |||||
| SS | 4 [6] | 0.492 | 0.064–3.798 | 0.497 | |||||
| Other STS | 11 [15] | 0.496 | 0.160–1.541 | 0.226 | |||||
| Localization | Lower extremity | 29 [40] | 1.000 | – | – | ||||
| Upper extremity | 10 [14] | 1.284 | 0.445–3.705 | 0.643 | |||||
| Trunk | 24 [33] | 1.312 | 0.568–3.028 | 0.525 | |||||
| Hip | 5 [7] | 3.132 | 0.992–9.892 | 0.052 | |||||
| Other | 4 [6] | 2.633 | 0.726–9.544 | 0.141 | |||||
| Grading (WHO) | G1 + G2 | 15 [21] | 1.000 | – | – | ||||
| G3 | 57 [79] | 2.625 | 0.922–7.470 | 0.071 | |||||
| T stage | pT1a + pT1b | 31 [43] | 1.000 | – | – | ||||
| pT2a + pT2b | 41 [57] | 2.741 | 1.302–5.771 | 0.008 | |||||
| TNM stage | I + II | 34 [47] | 1.000 | – | – | 1.000 | – | – | |
| III + IV | 38 [53] | 2.605 | 1.264–5.369 | 0.009 | 2.795 | 1.354–5.773 | 0.005 | ||
| Surgical margins | Wide | 55 [76] | 1.000 | – | – | ||||
| Non-wide | 17 [24] | 1.379 | 0.643–2.959 | 0.409 | |||||
| Treatment between the 1st and 2nd surgery | None | 55 [76] | 1.000 | – | – | ||||
| Chemo or (and) radio | 17 [24] | 0.943 | 0.427–2.083 | 0.884 | |||||
| CD8 | Increase group | 20 [28] | 1.000 | – | – | 1.000 | – | – | |
| No change group | 26 [36] | 1.604 | 0.593–4.338 | 0.352 | 1.662 | 0.614–4.499 | 0.317 | ||
| Decrease group | 26 [36] | 2.937 | 1.150–7.499 | 0.024 | 3.226 | 1.261–8.254 | 0.015 | ||
| PD-L1(T) | Increase group | 26 [36] | 1.000 | – | – | ||||
| No change group | 38 [53] | 0.969 | 0.477–1.970 | 0.932 | |||||
| Decrease group | 8 [11] | 0.340 | 0.076–1.519 | 0.158 | |||||
| PD-L1(L) | Increase group | 24 [33] | 1.000 | – | – | ||||
| No change group | 40 [56] | 1.075 | 0.515–2.246 | 0.847 | |||||
| Decrease group | 8 [11] | 0.391 | 0.086–1.779 | 0.225 | |||||
| CD20 | Increase group | 17 [24] | 1.000 | – | – | ||||
| No change group | 35 [49] | 1.289 | 0.538–3.091 | 0.569 | |||||
| Decrease group | 20 [27] | 1.223 | 0.455–3.288 | 0.689 | |||||
| Foxp3 | Increase group | 16 [22] | 1.000 | – | – | ||||
| No change group | 32 [45] | 1.243 | 0.511–3.023 | 0.631 | |||||
| Decrease group | 24 [33] | 1.053 | 0.408–2.719 | 0.914 | |||||
Surgical margins for the 1st surgery resection. PD-L1, programmed cell death ligand 1; PD-L1(T), PD-L1 in tumor cells; PD-L1(L), PD-L1 in lymphocytes; UPS, undifferentiated pleomorphic sarcoma; MFS, myxofibrosarcoma, FS, fibrosarcoma; LPS, liposarcoma; LMS, leiomyosarcoma; SS, synovial sarcoma; AS, angiosarcoma; STS, soft tissue sarcomas.
Changes in the quantities of CD8-, PD-L1-, CD20-, and Foxp3-positive lymphocytes and PD-L1-positive tumor cells in STS between the 1st and 2nd surgery
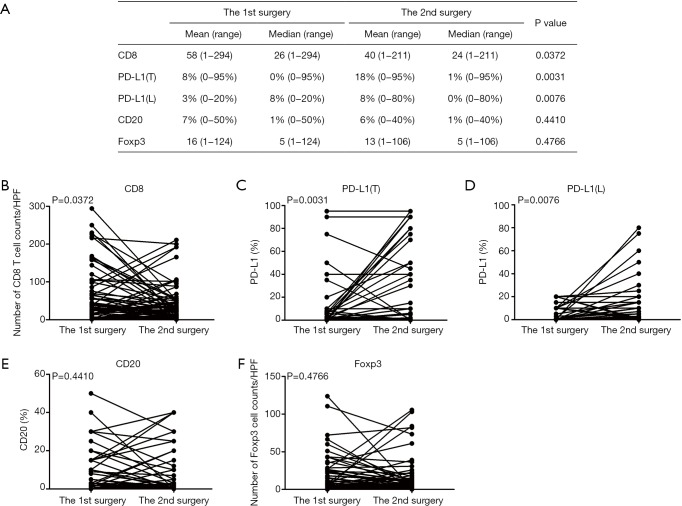
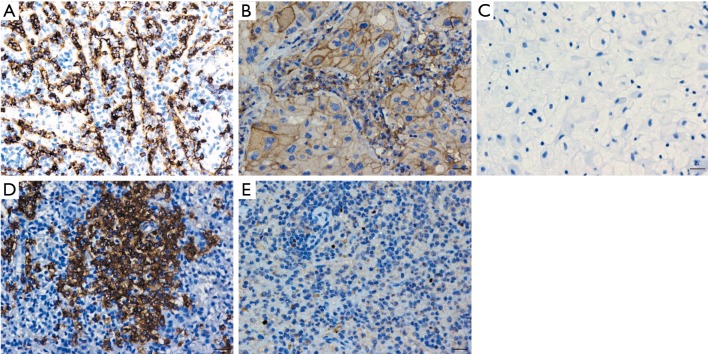
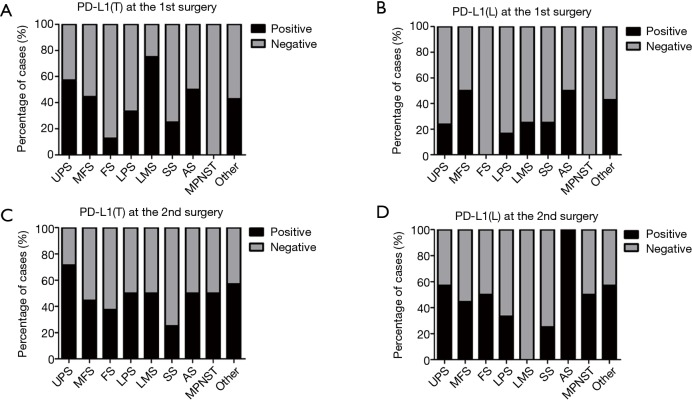
We first examined the positive controls for selected primary antibodies (CD8α, PD-L1, CD20, and Foxp3); obvious PD-L1, CD8α, CD20, and Foxp3 staining was observed in PD-L1-positive lung cancer slides and spleen tissues (Figure S1A,B,C,D,E). A total of 72 paired pre-recurrent and post-recurrent STS cases were evaluated by immunohistochemistry for PD-L1, CD8α, CD20, and Foxp3 (Figure 1A,B). Interestingly, some patients displayed increased numbers (or positivity) of CD8+ cells, PD-L1+ tumor cells, PD-L1+lymphocytes, CD20+ B cells, and Tregs after recurrence (Figure 1A), while some patients showed reduced numbers (or positivity) of CD8+ cells, PD-L1+ tumor cells, PD-L1+lymphocytes, CD20+ B cells, and Tregs (Figure 1B). We did not use the cut-off value for definition of PD-L1 positivity, the lowest value for positive PD-L1 expression is 0.5% [3 patients with 0.5% for PD-L1(T), no patient with 0.5% for PD-L1(L)]. Significantly fewer CD8+ T cells were observed in patients at the 2nd surgery than at the 1st surgery (mean: 40 vs. 58 cells/HPF, P=0.0372, Figure 2A,B), whereas obvious increases in the percentages of PD-L1+ tumor cells (T) and lymphocytes (L) were detected (Figure 2C,D). However, there were no significant differences between the 1st surgery and the 2nd surgery with respect to the percentage of CD20+ B cells and the quantity of Tregs (Figure 2E,F). Of note, the number of patients with positive PD-L1 expression in tumor cells was higher in UPS (12/21; 57%) and LMS (3/4; 75%) than in MFS (8/18; 44%), FS (1/8; 13%), LPS (2/6;33%), SS (1/4; 25%), AS (1/2; 50%), MPNST (0/2; 0%), and other STS (3/7; 43%) at the 1st surgery (Figure S2A). PD-L1-positive TILs were more frequently detected in MFS (9/18; 50%) and AS (1/2; 50%) than in the other STS subtypes at the 1st surgery (Figure S2B). An overall increase was observed in the number of patients with positive PD-L1 expression both in tumor cells and in TILs after recurrence (Figure S2C,D).
Figure 2.
Changes in the quantities of CD8, PD-L1, CD20, and Foxp3-positive lymphocytes and PD-L1-positive tumor cells. (A) Mean or median positive lymphocytes for CD8 and Foxp3 and positivity for PD-L1 and CD20 in STS between the 1st and 2nd surgery; (B) change in the number of CD8-positive lymphocytes; (C) change in PD-L1 positivity in tumor cells (T); (D) change in PD-L1 positivity in lymphocytes (L); (E) change in CD20 positivity; (F) Change in the number of Foxp3-positive lymphocytes. PD-L1, programmed cell death ligand 1; PD-L1(T), PD-L1 in tumor cells; PD-L1(L), PD-L1 in lymphocytes; STS, soft tissue sarcomas.
Correlations among variables
CD8-, PD-L1-, CD20-, and Foxp3-positive lymphocytes and PD-L1-positive tumor cells were significantly positively correlated with each other in STS at the 1st surgery. Moreover, similar results were also observed in STS at the 2nd surgery (Table S1).
Table S1. Correlations among variables in STS.
| Variables | The 1st surgery | The 2nd surgery | |||||||||
|---|---|---|---|---|---|---|---|---|---|---|---|
| CD8 cells | PD-L1(T) | PD-L1(L) | CD20 cells | Foxp3 cells | CD8 cells | PD-L1(T) | PD-L1(L) | CD20 cells | Foxp3 cells | ||
| CD8 cells | – | r=0.4555 | r=0.4373 | r=0.6123 | r=0.7267 | – | r=0.5649 | r=0.5301 | r=0.5356 | r=0.6409 | |
| P<0.0001 | P=0.0001 | P<0.0001 | P<0.0001 | P<0.0001 | P<0.0001 | P<0.0001 | P<0.0001 | ||||
| PD-L1(T) | – | r=0.5834 | r=0.3794 | r=0.6869 | – | r=0.6572 | r=0.3684 | r=0.6201 | |||
| P<0.0001 | P=0.0010 | P<0.0001 | P<0.0001 | P=0.0015 | P<0.0001 | ||||||
| PD-L1(L) | – | r=0.4859 | r=0.6182 | – | r=0.6160 | r=0.6556 | |||||
| P<0.0001 | P<0.0001 | P<0.0001 | P<0.0001 | ||||||||
| CD20 cells | – | r=0.6450 | – | r=0.5473 | |||||||
| P<0.0001 | P<0.0001 | ||||||||||
| Foxp3 cells | – | – | |||||||||
STS, soft tissue sarcomas; PD-L1, programmed cell death ligand 1; PD-L1(T), PD-L1 in tumor cells; PD-L1(L), PD-L1 in lymphocytes.
Changes in CD8, PD-L1, CD20, and Foxp3 with respect to the time between the 1st and 2nd surgery
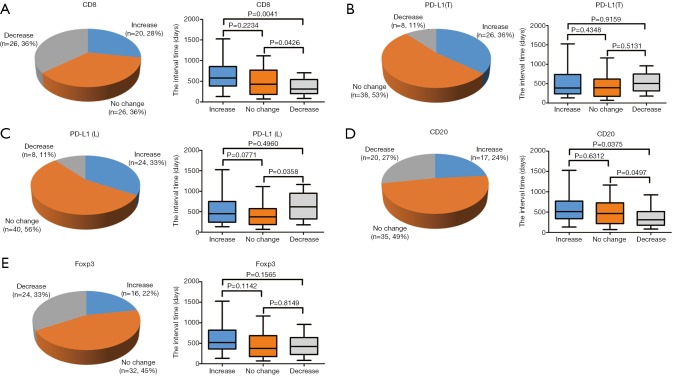
The interval of time between the first and second surgery may reflect the biological behavior of STS, which may also be reflected in the changes of TIME. To determine whether changes in the TIME are related to the interval of time, we divided patients into three groups (increase, no change, and decrease) according to the fold change of relative values (2nd surgery/1st surgery), with thresholds of >2 or <0.5, for CD8, PD-L1, CD20, and Foxp3. Interestingly, the decrease in CD8+ cells was most significant; 26 cases (36%) displayed obvious reductions in CD8+ cells in STS at the 2nd surgery compared with STS at the 1st surgery (Figure 3A). In total, 8, 8, 20, and 24 patients showed reduced positivity (or number) of PD-L1+ tumor cells, PD-L1+lymphocytes, CD20+ B cells, and Tregs, respectively (Figure 3B,C,D,E). A total of 20, 26, 24, 17,and 16 patients displayed increased numbers (or positivity) of CD8+ cells, PD-L1+ tumor cells, PD-L1+ lymphocytes, CD20+ B cells, and Tregs, respectively, and PD-L1(T) exhibited the greatest increase (Figure 3A,B,C,D,E). Furthermore, the decrease group for CD8 showed a shorter time interval than those for the increase and no change groups (Figure 3A). The groups for CD20 showed similar results to those for CD8 (Figure 3D). We also observed that the decrease group for PD-L1(L) showed a prolonged interval compared with that for the no change group (Figure 3C). However, no significant relationships between the time interval and PD-L1(T) and Foxp3 groups were detected (Figure 3B,E).
Figure 3.
Comparison between the increase, no change, and decrease groups for (A) CD8, (B,C) PD-L1, (D) CD20, and (E) Foxp3 with respect to the interval of time between the 1st and 2nd surgery. The distributions of the three groups for (A) CD8, (B) PD-L1(T), (C) PD-L1(L), (D) CD20, and (E) Foxp3 are displayed, and their relationships with the interval of time were analyzed. A fold change in the relative value (2nd surgery/1st surgery) of >2 (increase group) or <0.5 (decrease group) for (A) CD8, (B) PD-L1(T), (C) PD-L1(L), (D) CD20, and (E) Foxp3 was defined as significant, and patients were divided into three groups (increase, no change, and decrease). PD-L1, programmed cell death ligand 1; PD-L1(T), PD-L1 in tumor cells; PD-L1(L), PD-L1 in lymphocytes.
CD8+ T cells are closely associated with tumor relapse
Of 72 patients, 13 were newly diagnosed at admission and 59 recurrent cases underwent previous surgery at external hospitals. We compared the number of CD8+ lymphocytes in STS at the 1st surgery between newly diagnosed and recurrent patients. Patients with recurrent STS had fewer CD8+ T cells than those in patients with primary STS (mean: 50 vs. 99 cells/HPF, P=0.0256, Figure 4A), whereas there were no significant differences for PD-L1(T), PD-L1(L), CD20, and Tregs (Figure 4B,C, Figure S3A,B).
Figure 4.
CD8+ T cells were closely associated with tumor relapse. Comparison of CD8-positive lymphocytes (A) and PD-L1 positivity (B,C) in STS between new diagnosed and recurrent patients. Comparison of CD8-positive lymphocytes (D) and PD-L1 positivity (E,F) in STS between the 1st and 2nd surgery according to patients who were re-recurrent or not after the 2nd surgery. PD-L1, programmed cell death ligand 1; PD-L1(T), PD-L1 in tumor cells; PD-L1(L), PD-L1 in lymphocytes; STS, soft tissue sarcomas.
A total of 36 re-recurrent cases after the 2nd surgery were included. We found that patients with re-recurrent STS exhibited a significant decrease in CD8+ T cells from the 1st surgery to the 2nd surgery(mean: 61 to 35 cells/HPF, P=0.0241, Figure 4D), whereas patients without re-recurrence did not exhibit a significant difference in the number of CD8+ lymphocytes between the 1st and 2nd surgeries (mean: 56 to 44 cells/HPF, P=0.3932, Figure 4D), suggesting that recurrence with decreased CD8+ T cells is more likely to result in re-recurrence. However, patients without re-recurrence and those with re-recurrence both showed increased PD-L1 positivity in the tumor cells and lymphocytes (Figure 4E,F), although the increase was not significant for patients without re-recurrence (P=0.0873), suggesting that PD-L1 is not an important factor for predicting relapse. No significant differences were detected for CD20 and Foxp3 (Figure S4A,B).
Survival analysis with respect to changes in CD8, PD-L1, CD20, and Foxp3
As the changes in CD8+ T cell, CD20+ B cell, and PD-L1+ lymphocyte counts are associated with the time interval between surgeries (Figure 3A,C,D), relapsed patients with a prolonged interval may have a better survival rate, we postulated that the changes in the TIME may be related to patient survival. Interestingly, our results showed that the increase group for CD8 had a longer survival time than that of the no change group, and the no change group had a longer survival time than that of the decrease group (Figure 5A). But a high CD8 cell count at first surgery had no obvious effect on overall survival compared with a low CD8 cell count (Figure S5). There were also no significant relationships between survival and quantities of PD-L1(T), PD-L1(L), CD20, and Foxp3 at first surgery (data not shown). Trends toward better overall survival were observed in the decrease group compared with the no change group or increase group for PD-L1(T) or PD-L1(L), although the study was not sufficiently powered to detect significant differences (Figure 5B,C). There were no associations between patient survival and changes in CD20+ B cells or Tregs (Figure 5D,E). In a univariate analysis, T stage, TNM stage, and decreased CD8+ T cells were significant predictors of overall survival (Table 1). Moreover, as reported in Table 1, multivariate analyses showed that advanced stage and decreased CD8+ lymphocytes were independent prognostic factors for poor survival.
Figure 5.
Survival analysis for patients with increases, no change, and decreases in CD8, PD-L1(T), PD-L1(L), CD20, and Foxp3.Survival analysis for patients with increases, no change, and decreases in (A) CD8, (B) PD-L1(T), (C) PD-L1(L), (D) CD20, and (E) Foxp3. PD-L1, programmed cell death ligand 1; PD-L1(T), PD-L1 in tumor cells; PD-L1(L), PD-L1 in lymphocytes.
Figure S5.
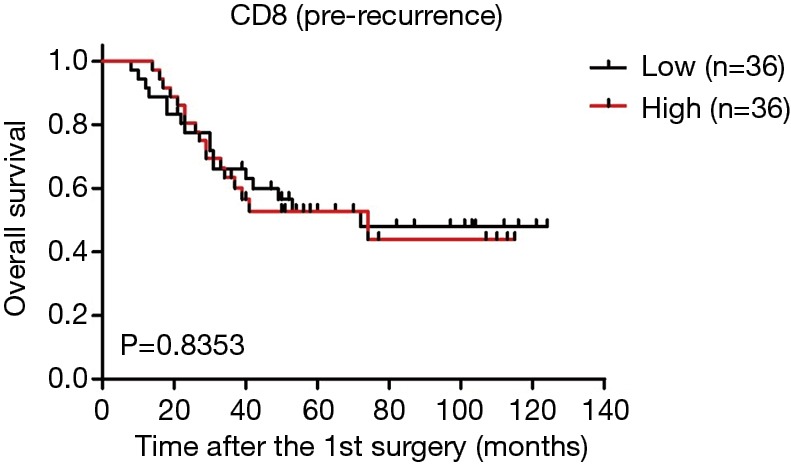
Correlation of CD8+ T cells with survival in STS patients at first surgery (pre-recurrence). Patients were divided into two groups according to the number of CD8+ T cells/HPF. STS, soft tissue sarcomas.
Discussion
We performed the first investigation of the characteristics of the TIME in paired pre-recurrent and post-recurrent STS and report several new findings. First, TILs differed between pre-recurrent STS and post-recurrent STS. Second, changes in CD8+ T cells, CD20+ B cells, and PD-L1+ lymphocytes were associated with the time interval between surgeries. Third, CD8+ T cells were closely associated with tumor relapse. Fourth, PD-L1 expression in tumor cells and TILs increased after recurrence. Finally, a decrease in CD8+ T cells in recurrent STS was negatively associated with overall survival and was an independent unfavorable prognostic factor. Our study delivers important insights into how the TIME is modulated in recurrent STS.
Surgical resection is the most effective therapy for patients with solid tumors. However, as many as 20% to 40% of patients exhibit recurrence after surgery (12), and recurrent tumors are more difficult to treat. TILs are associated with the clinical response to immune therapy (3,13). However, their relationship with tumor relapse is unclear. In this study, CD8+ T cells, PD-L1+ tumor cells, PD-L1+ lymphocytes, CD20+ B cells, and Tregs showed variation. Among CD8, PD-L1(T), PD-L1(L), CD20, and Tregs, CD8+ T cells were the most obviously decreased lymphocytes; 36% of patients showed reduced CD8+ T cells. PD-L1 positivity increased most significantly; 36% and 33% of patients showed increased positivity of PD-L1+ tumor cells and PD-L1+ lymphocytes, respectively. Consistent with a previous report indicating that most types of TILs are positively correlated in STS (10), we observed positive correlations between CD8, PD-L1, CD20, and Foxp3-positive lymphocytes and PD-L1-positive tumor cells before relapse (at the first surgery) and also after relapse (at the second surgery). These results suggest that the TIME changes during disease relapse are accompanied by crosstalk among various lymphocytes and PD-L1-positive tumor cells.
The CD8+ lymphocyte density can be used as a marker for prognosis (11), tumor microenvironment typing (14), and predicting the response to PD-1 inhibitors (15). Studies of the relationship between CD8+ T cells and tumor relapse are lacking. We identified a new role of CD8+ T cells for the prediction of STS recurrence, as fewer CD8+ T cells were observed in patients with recurrence than in newly diagnosed patients. Moreover, patients with recurrent STS with fewer CD8-positive cells than those in patients with pre-recurrent STS were more likely to exhibit re-recurrence. Our results are consistent with a recent study that the immunoscore based on the densities of CD3+ and CD8+ T cells in 2,681 samples provides a reliable estimate of the risk of recurrence in patients with colon cancer; patients with a high immunoscore have a low risk of recurrence and a significantly prolonged time to recurrence (16), but variation in CD8+ T cells in recurrent tumors has not been further studied in colon cancer. Interestingly, we found that CD8+ T cells decreased after disease relapse (mean: 58 vs. 40 cells/HPF, P=0.0372), and relapsed patients with decreases in CD8+ T cells exhibited shorter interval times, indicating that CD8+ T cells play an important role in delaying tumor recurrence. CD8+ T cells mediate tumor rejection by the recognition of tumor antigens and direct killing of malignant cells. CD8+ lymphocytes have the capacities to control tumor growth and treat cancer (4,6,17). Taken together, these results suggest that CD8+ T cells can not only act as potential biomarkers for predicting tumor relapse but also have essential roles during tumor relapse.
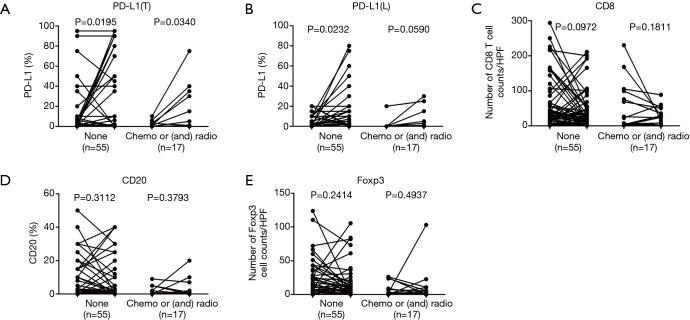
Currently, it is not known whether tumor relapse is related to PD-L1 expression. Studies have shown that PD-L1 expression is increased in recurrent ovarian cancer in small cohorts (18,19). In contrast, Heynckes et al. found that PD-L1 expression is reduced in recurrent glioblastoma (38 paired cases), but PD-L1 expression may be influenced by temozolomide chemotherapy (38 patients), as patients who receive an extended dose of temozolomide have a significantly decreased level of PD-L1 expression (20). A relatively large, therapy-naive and paired cohort is needed to address this question. Our results showed that PD-L1 expression in tumor cells and in lymphocytes increased, irrespective of whether patients received treatment (chemotherapy and/or radiotherapy) (Figure S6A,B). Previous studies have confirmed that PD-L1 expression is increased after pre-operative radiotherapy (21,22), but our study was underpowered for definitively concluding that post-operative treatment is related to PD-L1 expression, as the therapy-naive group (n=55) also showed increased PD-L1 expression.
Immunotherapy by the blockade of immune checkpoints is a promising approach for the treatment of UPS or dedifferentiated LPS (23). Our results suggest that immunotherapy is more suitable for recurrent STS due to increased PD-L1 expression. Moreover, our data also support the concept that PD-L1 expression changes dynamically (24). Archival specimens are less accurate because patients may have undergone several lines of therapy, relapse, or metastasis since the biopsies were performed. Thus, the expression of PD-L1 in pretreatment biopsies might accurately reflect the state of the TIME for immunotherapy.
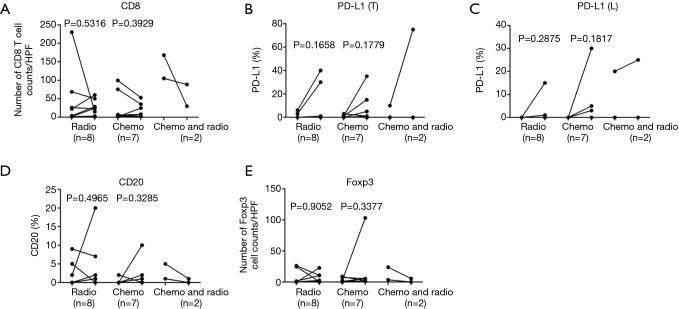
This study had both weaknesses and strengths. The study included post-operative treatment for 17 patients between the 1st and 2nd surgery; however, post-operative treatment was not an independent predictive factor for changes in CD8, PD-L1, CD20, and Foxp3-positive cells (Figure S6A,B,C,D,E and Figure S7A,B,C,D,E). In addition, our study was a retrospective analysis of clinical data. Despite the limitations, our study included a relatively large number of paired cases compared with those of other studies, thus excluding differences in TIME background that may influence lymphocyte counts and PD-L1 positivity in unpaired patients.
Conclusions
In summary, we present the first evidence that the numbers of CD8, PD-L1, CD20, and Foxp3-positive cells change dynamically in post-recurrent STS. Furthermore, CD8+ T cells were closely associated with tumor relapse, and PD-L1 expression in tumor cells and lymphocytes was elevated after recurrence. Our results suggest that variation in CD8+ T cells and PD-L1 positivity may have essential roles during tumor relapse, and changes in TILs and PD-L1 positivity should be considered when immunotherapy is applied to relapsed patients with STS. Further studies of associations between changes in the TIME and the efficacy of immunotherapy in recurrent patients are warranted.
Figure S1.
IHC analysis of CD8, PD-L1, CD20, and Foxp3 expression. Examples of positive CD8 expression (A), CD20 expression (D), and Foxp3 expression (E) on lymphocytes in human spleen tissue. Examples of the positive control (B) and negative control (C) for PD-L1 expression on human lung cancer tissues with an anti-PD-L1 antibody and isotype control, respectively. Scale bars =10 µm. IHC, immunohistochemical; PD-L1, programmed cell death ligand 1.
Figure S2.
Distribution of PD-L1 expression in tumor cells (A,C) and lymphocytes (B,D) in STS depending on histopathologic type at the 1st and 2nd surgery. PD-L1, programmed cell death ligand 1; PD-L1(T), PD-L1 in tumor cells; PD-L1(L), PD-L1 in lymphocytes; UPS, undifferentiated pleomorphic sarcoma; MFS, myxofibrosarcoma, FS, fibrosarcoma; LPS, liposarcoma; LMS, leiomyosarcoma; SS, synovial sarcoma; AS, angiosarcoma; MPNST, malignant peripheral nerve sheath tumor; STS, soft tissue sarcomas.
Figure S3.
Comparison of CD20 positivity (A) and Foxp3-positive lymphocytes (B) in STS between the newly diagnosed and recurrent patients. STS, soft tissue sarcomas.
Figure S4.
Comparison of CD20 positivity (A) and Foxp3-positive lymphocytes (B) in STS between the 1st and 2nd surgery according to re-recurrent status of patients, after the 2nd surgery. STS, soft tissue sarcomas.
Figure S6.
Effects of chemotherapy and/or radiotherapy on the quantities of PD-L1, CD8, CD20, and Foxp3-positive cells. The quantities of PD-L1(T), PD-L1(L), CD8, CD20, and Foxp3-positive cells were compared in paired STS between the 1st and 2nd surgery in patients who underwent post-operative treatment (chemotherapy and/or radiotherapy) or no post-operative treatment. PD-L1, programmed cell death ligand 1; PD-L1(T), PD-L1 in tumor cells; PD-L1(L), PD-L1 in lymphocytes; STS, soft tissue sarcomas.
Figure S7.
Effects of chemotherapy or radiotherapy on the quantities of CD8, PD-L1, CD20, and Foxp3-positive cells. Quantities of CD8, PD-L1(T), PD-L1(L), CD20, and Foxp3-positive cells were compared in paired STS between the 1st and 2nd surgery in patients who received radiotherapy (n=8), chemotherapy (n=7), or chemotherapy plus radiotherapy (n=2). PD-L1, programmed cell death ligand 1; PD-L1(T), PD-L1 in tumor cells; PD-L1(L), PD-L1 in lymphocytes; STS, soft tissue sarcomas.
Acknowledgments
Funding: This study was supported by grants from the National Natural Science Foundation of China (Grant No: 81572454, 81472480, 81302103).
Ethical Statement: The authors are accountable for all aspects of the work in ensuring that questions related to the accuracy or integrity of any part of the work are appropriately investigated and resolved. Signed informed consent was obtained from all patients, and the study was approved by the Clinical Research Ethics Committee of Fudan University Shanghai Cancer Center (Number: 050432-4-1805C).
Footnotes
Conflicts of Interest: The authors have no conflicts of interest to declare.
References
- 1.Rothermundt C, Whelan JS, Dileo P, et al. What is the role of routine follow-up for localised limb soft tissue sarcomas? A retrospective analysis of 174 patients. Br J Cancer 2014;110:2420-6. 10.1038/bjc.2014.200 [DOI] [PMC free article] [PubMed] [Google Scholar]
- 2.Luen SJ, Salgado R, Fox S, et al. Tumour-infiltrating lymphocytes in advanced HER2-positive breast cancer treated with pertuzumab or placebo in addition to trastuzumab and docetaxel: a retrospective analysis of the CLEOPATRA study. Lancet Oncol 2017;18:52-62. 10.1016/S1470-2045(16)30631-3 [DOI] [PMC free article] [PubMed] [Google Scholar]
- 3.Gibney GT, Weiner LM, Atkins MB. Predictive biomarkers for checkpoint inhibitor-based immunotherapy. Lancet Oncol 2016;17:e542-51. 10.1016/S1470-2045(16)30406-5 [DOI] [PMC free article] [PubMed] [Google Scholar]
- 4.Tran E, Robbins PF, Lu YC, et al. T-Cell Transfer Therapy Targeting Mutant KRAS in Cancer. N Engl J Med 2016;375:2255-62. 10.1056/NEJMoa1609279 [DOI] [PMC free article] [PubMed] [Google Scholar]
- 5.Dieci MV, Criscitiello C, Goubar A, et al. Prognostic value of tumor-infiltrating lymphocytes on residual disease after primary chemotherapy for triple-negative breast cancer: a retrospective multicenter study. Ann Oncol 2014;25:611-8. 10.1093/annonc/mdt556 [DOI] [PMC free article] [PubMed] [Google Scholar]
- 6.Milner JJ, Toma C, Yu B, et al. Runx3 programs CD8+ T cell residency in non-lymphoid tissues and tumours. Nature 2017;552:253-7. 10.1038/nature24993 [DOI] [PMC free article] [PubMed] [Google Scholar]
- 7.Powles T, Eder JP, Fine GD, et al. MPDL3280A (anti-PD-L1) treatment leads to clinical activity in metastatic bladder cancer. Nature 2014;515:558-62. 10.1038/nature13904 [DOI] [PubMed] [Google Scholar]
- 8.Que Y, Xiao W, Guan YX, et al. PD-L1 expression is associated with FOXP3+ regulatory T-cell infiltration of soft tissue sarcoma and poor patient prognosis. J Cancer 2017;8:2018-25. 10.7150/jca.18683 [DOI] [PMC free article] [PubMed] [Google Scholar]
- 9.Sorbye SW, Kilvaer T, Valkov A, et al. Prognostic impact of lymphocytes in soft tissue sarcomas. PLoS One 2011;6:e14611. 10.1371/journal.pone.0014611 [DOI] [PMC free article] [PubMed] [Google Scholar]
- 10.Boxberg M, Steiger K, Lenze U, et al. PD-L1 and PD-1 and characterization of tumor-infiltrating lymphocytes in high grade sarcomas of soft tissue - prognostic implications and rationale for immunotherapy. Oncoimmunology 2017;7:e1389366. 10.1080/2162402X.2017.1389366 [DOI] [PMC free article] [PubMed] [Google Scholar]
- 11.Fujii H, Arakawa A, Utsumi D, et al. CD8+ tumor-infiltrating lymphocytes at primary sites as a possible prognostic factor of cutaneous angiosarcoma. Int J Cancer 2014;134:2393-402. 10.1002/ijc.28581 [DOI] [PubMed] [Google Scholar]
- 12.Aliperti LA, Predina JD, Vachani A, et al. Local and systemic recurrence is the Achilles heel of cancer surgery. Ann Surg Oncol 2011;18:603-7. 10.1245/s10434-010-1442-0 [DOI] [PMC free article] [PubMed] [Google Scholar]
- 13.Hamid O, Schmidt H, Nissan A, et al. A prospective phase II trial exploring the association between tumor microenvironment biomarkers and clinical activity of ipilimumab in advanced melanoma. J Transl Med 2011;9:204. 10.1186/1479-5876-9-204 [DOI] [PMC free article] [PubMed] [Google Scholar]
- 14.Ock CY, Keam B, Kim S, et al. Pan-cancer immunogenomic perspective on the tumor microenvironment based on PD-L1 and CD8 T-cell infiltration. Clin Cancer Res 2016;22:2261-70. 10.1158/1078-0432.CCR-15-2834 [DOI] [PubMed] [Google Scholar]
- 15.Haratani K, Hayashi H, Tanaka T, et al. Tumor immune microenvironment and nivolumab efficacy in EGFR mutation-positive non-small-cell lung cancer based on T790M status after disease progression during EGFR-TKI treatment. Ann Oncol 2017;28:1532-9. 10.1093/annonc/mdx183 [DOI] [PubMed] [Google Scholar]
- 16.Pagès F, Mlecnik B, Marliot F, et al. International validation of the consensus Immunoscore for the classification of colon cancer: a prognostic and accuracy study. Lancet 2018;391:2128-39. 10.1016/S0140-6736(18)30789-X [DOI] [PubMed] [Google Scholar]
- 17.Ostroumov D, Fekete-Drimusz N, Saborowski M, et al. CD4 and CD8 T lymphocyte interplay in controlling tumor growth. Cell Mol Life Sci 2018;75:689-713. 10.1007/s00018-017-2686-7 [DOI] [PMC free article] [PubMed] [Google Scholar]
- 18.Aust S, Felix S, Auer K, et al. Absence of PD-L1 on tumor cells is associated with reduced MHC I expression and PD-L1 expression increases in recurrent serous ovarian cancer. Sci Rep 2017;7:42929. 10.1038/srep42929 [DOI] [PMC free article] [PubMed] [Google Scholar]
- 19.Ojalvo LS, Thompson ED, Wang TL, et al. Tumor-associated macrophages and the tumor immune microenvironment of primary and recurrent epithelial ovarian cancer. Hum Pathol 2018;74:135-47. 10.1016/j.humpath.2017.12.010 [DOI] [PubMed] [Google Scholar]
- 20.Heynckes S, Gaebelein A, Haaker G, et al. Expression differences of programmed death ligand 1 in de-novo and recurrent glioblastoma multiforme. Oncotarget 2017;8:74170-7. 10.18632/oncotarget.18819 [DOI] [PMC free article] [PubMed] [Google Scholar]
- 21.Keung EZ, Tsai JW, Ali AM, et al. Analysis of the immune infiltrate in undifferentiated pleomorphic sarcoma of the extremity and trunk in response to radiotherapy: Rationale for combination neoadjuvant immune checkpoint inhibition and radiotherapy. Oncoimmunology 2017;7:e1385689. 10.1080/2162402X.2017.1385689 [DOI] [PMC free article] [PubMed] [Google Scholar]
- 22.Patel KR, Martinez A, Stahl JM, et al. Increase in PD-L1 expression after pre-operative radiotherapy for soft tissue sarcoma. Oncoimmunology 2018;7:e1442168. 10.1080/2162402X.2018.1442168 [DOI] [PMC free article] [PubMed] [Google Scholar]
- 23.Tawbi HA, Burgess M, Bolejack V, et al. Pembrolizumab in advanced soft-tissue sarcoma and bone sarcoma (SARC028): a multicentre, two-cohort, single-arm, open-label, phase 2 trial. Lancet Oncol 2017;18:1493-501. 10.1016/S1470-2045(17)30624-1 [DOI] [PMC free article] [PubMed] [Google Scholar]
- 24.Chen J, Jiang CC, Jin L, et al. Regulation of PD-L1: a novel role of pro-survival signalling in cancer. Ann Oncol 2016;27:409-16. 10.1093/annonc/mdv615 [DOI] [PubMed] [Google Scholar]


