

Abstract
Objective
To determine individual‐ and country‐level determinants of utilization of key maternal health services in sub‐Saharan Africa (SSA).
Study Setting
We used the most recent standard demographic and health survey data from the period of 2005 to 2015 for 34 SSA countries. Predictors of key maternal health service indicators were determined using a sample of 245 178 women who had at least one live birth 5 years preceding the survey.
Study Design
We used a two‐level hierarchical model, considering individual predictors at level one and country factors at level two of the hierarchy.
Principal Findings
While the skilled birth attendance (SBA) utilization rate reached 53 percent during the study period, the recommended four or more antenatal care (ANC) coverage was commonly low with less significant differences among different groups of women and countries. Being in a middle‐income country increased the individual‐level association between ANC and SBA (OR = 2.34, 95% CI: 1.24, 4.44). Less privileged women with lower education level were less likely to receive maternal health services.
Conclusions
This study reveals the existence of wide gaps between ANC and SBA coverage in SSA. Urgent policy attention is required to improve access, utilization, and quality of maternal health services.
Keywords: antenatal care, multilevel analysis, skilled birth attendance, sub‐Saharan Africa
1. INTRODUCTION
Reproductive age is of central importance to all women, their families, communities, and the next generation of a country.1 Although some literature suggests that maternal health statistics should focus on counting deaths,2 data on service coverage and maternal health service utilization are essential partly due to the following: Most obstetric complications and deaths can be prevented during the continuum of care during the pre‐, intra‐, and postnatal period.3 It has been established that most maternal deaths are preventable using a well‐known and evidence‐based interventions during this period. While the prenatal period is a crucial time to promote healthy behaviors and parenting skills,4 the intra‐ and postnatal periods are the most critical time to the health and survival of a mother and her newborn.5 Hence, selected key indicators that measure access to maternal health service have been used to track progress of countries in addressing maternal health needs.6, 7
The provision of continuous maternal health services that starts with good quality antenatal care (ANC), followed by skilled birth attendance (SBA) and postnatal care (PNC), is the capstone of maternal and child health services.8 For instance, the WHO once recommended that all pregnant women should have at least four ANC visits by, or under the supervision of, a skilled attendant.6 In the revised version of the report,9 it is recommended to have a minimum of eight contacts.
However, despite the priority given by health systems to improve the quality of and access to these services, optimal level of maternal health utilization is not always the case, particularly in developing countries. This is due to a range of factors. First of all, there is a shortage of skilled workforce.10, 11 For instance, the sub‐Saharan Africa (SSA) region, a land of about one‐tenth (11 percent) of the world's population and that shares over 24 percent of the global disease burden, has only 3 percent of the global health workforce. Comparatively, North America—mainly United States and Canada—which has around 14 percent of the world's population and that contributes only 10 percent of the world's disease burden, has more than one‐third (37 percent) of the global health workforce.12
Furthermore, despite the fact that one of the most important interventions for safe motherhood is to ensure that a skilled health provider with midwifery skills attends every birth,13 there is a gap between the training of skilled health personnel and their competence to manage delivery. Studies in Ethiopia14 and Tanzania15 indicate the unpleasantness of attending health facilities for laboring women due to the inexperienced and neglectful health workers.
A multicountry study16 also established that the theoretical and technical skill of health professionals (HPs) is worryingly low especially in high mortality settings. Moreover, there is an inadequate enabling environment for SBA service utilization, such as the limited capacity of health facilities to deliver the full range of basic services17, 18 as well as distance for women to travel to the health facility.19 Likewise, poor quality of ANC service, as a result of low capacity of the health facilities, is one of the main factors for low SBA coverage.20
A final factor, thought to be the main contributing factor to low SBA coverage, is the influence of social determinants of health, particularly the low socioeconomic status of women on maternal health service utilization.21 As such, SSA is placed at the bottom of the pyramid with regard to the quality and coverage of ANC and SBA services. In 2014, while 52 percent of pregnant women in developing regions received the recommended four or more ANC visits, the coverage in SSA was 49 percent, with only a 2 percent increase in the past two decades. For SBA, the coverage worldwide ranges from universal access in part of Eastern Asia to as low of about 52 percent in SSA. This difference is seen as a contributor to the region's high maternal mortality ratio of 510 deaths per 100 000 live births.22, 23
Studies have shown that the main determinants of maternal health service utilization are related to sociocultural such as education, perceived need such as birth order, economic accessibility such as occupation, and physical accessibility factors such as place of residence.24 Within the public health research community, there is a concern that health intervention programs are often mainly supply‐oriented, ignoring the social factors constraining the demand for, access to, and effective use of health services.25
Literature indicates that factors at different hierarchy including individual, household, and community levels predict maternal health service utilization,26 and it is evident that country‐level factors such as health workers to population ratio27 and socioeconomic status21, 28, 29 play a major role in maternal health service utilization. Even though several multilevel studies have been conducted to determine predictors of ANC and/or SBA in the SSA region, there are no multicountry studies that take the effect of individual‐ and country‐level factors into consideration. Therefore, this study was designed to investigate the two‐level determinants of recommended ANC, SBA and combined ANC and SBA services in SSA using a two‐level hierarchical modeling.
2. METHODS
2.1. Data source
The most recent standard Demographic and Health Survey (DHS) data of each of the 34 SSA countries with at least one survey from 2005 to 2015 were used in the study. DHSs are nationally representative household surveys that provide data for a wide range of monitoring and impact evaluation indicators in the areas of population, health, and nutrition using face‐to‐face interviews with women aged 15‐49 years.30 DHS uses a list of enumeration areas (EAs) from the census as the sampling frame.31 Two‐stage stratified cluster sampling techniques are applied for this survey. At the first stage, a stratified sample of EAs is selected with probability proportional to size. At the second stage, a fixed number of households are selected by equal probability systematic sampling in the selected EAs. In these DHS datasets, only the individual record datasets that contain relevant variables about maternal health services were considered for this study. Women aged 15‐49 years with at least one live birth in the last 5 years preceding the survey, counting multiple births as one, were considered in this study. A complex sample analysis procedure was applied using guidelines supplied in the DHS statistics manuals32 to adjust for sampling weight. While identifying outcome and predictor variables, standardized variables were used as defined in the DHS recode manual,33 so as to allow comparisons across countries. All the DHSs were conducted by Central Statistical Offices of respective countries with technical support from ICF International. Ethical clearance has been granted by all relevant bodies.34 Country‐level background indicators were obtained from the World Bank indicator database.35
2.2. Selection of indicators/variables
2.2.1. Outcome indicators
The study included three outcome variables, namely SBA, recommended ANC, and both ANC and SBA. All variables referred to the last birth within the last 5 years preceding the survey. The outcome variables were dichotomous, coded as 1 if the woman received the service and 0 otherwise.
2.2.2. Predictor variables
While the predictors were initially considered based on known facts and various studies25 including a multilevel study on maternal health,26 a summary framework about determinants of SBA as outlined by Gabrysch and Campbell was used to group all level‐one (individual) predictors into four categories: sociocultural, perceived need, economic accessibility, and physical accessibility. The study predictors were identified using a bivariate logistic regression model between the outcome and each of the independent variables. An exploratory analysis was used as a screening tool for level‐two (country) variables. Initially, a random coefficient model without predictors was used to assess the extent to which individual‐level variation in the outcome indicators was associated with country‐level factors. After checking its eligibility using intraclass correlation (ICC), a two‐level hierarchal model was conducted to determine the individual‐level predictors after controlling the effects of country‐level factors. Table 1 shows the list of level‐one and level‐two factors, and the outcome variables included in the model. Level‐one predictors relate to individual mothers, and level‐two predictors relate to countries. Among the level‐one predictors, age of the woman and number of ANCs are measured on a metric scale while the rest are dichotomous.
Table 1.
Description of level‐one, level‐two predictors and outcome variables
| Variable | Description |
|---|---|
| Level‐one predictors (individuals) | |
| Sociocultural factors | |
| Age | Age of a woman (in y) |
| Literate | Literacy status of the woman (literate = 1 and illiterate = 0) |
| Married | Marital status (married = 1 and unmarried = 0) |
| Partner's education | Partner's education (primary education or greater = 1 and uneducated = 0) |
| Birth spacing | Whether a woman had one only birth within the 5 y preceding the survey (one birth = 1 and two or more birth = 0) |
| Number of ANC | Number of ANC services for the most recent birth in the 5 y preceding the survey |
| Physical/service accessibility | |
| Urban | Residence of the woman (urban = 1 and rural = 0) |
| Skilled antenatal care | Any ANC services received from skilled personnel for the most recent birth (any service = 1 and no service = 0) |
| Economic accessibility | |
| Wealth index | Wealth index of the woman (upper quintile and middle = 1, and poor = 0) |
| Perceived need | |
| Wanted pregnancy | Whether the index pregnancy among the most recent live births was wanted (yes = 1 and unwanted or wanted to delay = 0) |
| Level‐two factors (countries) | |
| Survey period | Survey period of the country (1‐10). Country with a survey conducted in 2006 was coded as 1 and if conducted in 2015 was coded as 10 |
| Middle income | World Bank income grouping of the country (middle income = 1 and low income = 0) |
| Birth order | The order in which the children were born |
| Urban population | Percentage of population living in urban areas |
| Literacy rate | Percentage of women who are literate |
| Ratio of HPs to population | Physicians, nurses, and midwives per 10 000 population |
| Outcome variables | |
| SBA | SBA at index birth (delivery service for the most recent birth = 1 and otherwise = 0) |
| *Recommended ANC | Receipt of recommended ANC during index pregnancy (four or more occasions of ANC service with the first being in the first trimester = 1 and otherwise = 0) |
| ANC and SBA | Receipt of both the recommended ANC and SBA (both received for the most recent birth = 1 and otherwise = 0) |
Antenatal care (ANC) coverage: The proportion of women who were attended by at least one skilled health personnel for reasons relating to pregnancy.6, 47
Skilled birth attendance (SBA): The process by which a woman is provided with adequate care during labor, delivery, and the early postpartum period.6, 47
Skilled health personnel: An accredited, health professional such as doctor, midwife, or nurse, who has been educated and trained to proficiency in the skills needed to manage normal pregnancies, childbirth and the immediate postnatal period, and in the identification, management and referral of complications in women and newborn babies.6, 47
*Recommended ANC coverage: Proportion of women who received four or more ANC consultations, the first visit in the first trimester.38 This is based on the previous WHO definition.
2.3. Analytic approach
Only predictors with significant association with the outcome indicators in the binary logistic regression were considered in the final model. More indicators were initially included in both levels. However, the model has identified some multicollinearity issues. Therefore, selected indicators are kept in the final model (Table 3).
Table 3.
Predictors of utilization of maternal health services in sub‐Saharan Africa: multilevel models
| Fixed effect | SBA | Recommended ANC | ANC and SBA | |||
|---|---|---|---|---|---|---|
| OR | 95% CI | OR | 95% CI | OR | 95% CI | |
| Country‐level factors | ||||||
| Intercept | 0.167 | 0.105, 0.264* | 0.243* | 0.182, 0.325 | 0.724 | 0.490, 1.069 |
| Urban pop (%) | 1.016 | 1.003, 1.028** | 1.025* | 1.013, 1.037 | 1.013* | 1.001, 1.026 |
| Women literacy rate | 1.032 | 1.019, 1.045* | 0.992** | 0.985, 0.999 | 1.013* | 1.006, 1.020 |
| Middle income | 0.593 | 0.324, 1.087 | 1.200 | 0.754, 1.910 | 1.348 | 0.819, 2.218 |
| Individual‐level factors | ||||||
| Age | 1.024 | 1.015, 1.032* | 1.027* | 1.023, 1.031 | 1.027* | 1.016, 1.038 |
| Urban | 2.170 | 1.806, 2.607* | 1.154* | 1.042, 1.278 | 2.172* | 1.708, 2.762 |
| Literate | 1.572 | 1.403, 1.762* | 1.257* | 1.174, 1.346 | 1.575* | 1.378, 1.799 |
| Wealthy (middle and upper quintile) | 1.899 | 1.710, 2.108* | 1.407* | 1.293, 1.530 | 1.947* | 1.668, 2.273 |
| Birth order | 0.882 | 0.862, 0.903* | 0.910* | 0.897, 0.922 | 0.883 | 0.856, 0.911 |
| Wanted pregnancy | 0.954 | 0.901, 1.009 | 1.200* | 1.152, 1.250 | 0.964* | 0.917, 1.014 |
| Birth spacing | 1.062 | 1.007, 1.119** | 1.082* | 1.042, 1.123 | 1.066* | 1.011, 1.123 |
| Number of ANC | 1.131 | 1.093, 1.171* | ||||
| Skilled ANC | 5.812 | 3.750, 9.009* | ||||
| Literacy rate | 0.976 | 0.963, 0.989* | ||||
| Middle income | 2.343 | 1.237, 4.440* | ||||
Variable names are described in Table 1.
*Significant at 0.01, **Significant at 0.05.
Our analysis used a data structure where women (level one) were nested within countries (level two), allowing us to deal with microlevel and macrolevel data simultaneously.36 The model also corrected for possible errors in parameter estimates which could result from potential clustering.37 Analyses were conducted using HLM 7, SPSS 24, and Tableau 9 software. Numeric level‐one predictors were considered as group‐centered and numeric level‐two predictors were centered on the grand mean, whereas categorical predictors were managed as uncentered.
Across all 34 countries, there were a total of 241 683 women with at least one live birth in the 5 years preceding the survey and whose ANC and SBA services status were recorded. We chose to remove women with missing data, as suggested by the HLM manual. The final model therefore used data for 201 746 women, which was about 83.5 percent of the total sample. Nigeria and Sao Tome & Principe had the largest and smallest samples, respectively. Country‐specific sample size is presented in Appendix S1.
2.4. Level‐one, level‐two, and mixed models
The formula and description of the model are indicated in Appendix S2. At level one, a separate individual‐level regression model was defined for each country, taking individuals as the unit of analysis. The model represents the outcome for woman i within country j. At level two, level‐one coefficients were modeled as a function of level‐two predictors. If we take one of the outcome variables, SBA, the γ 00 presented in equation (4) indicates the average log‐odds of SBA across countries whereas the error term of the intercept (u 0j) allows for country‐specific intercepts.
2.5. Data quality assurance
Multiple responses for maternal health service utilization were addressed by limiting the study to only looking at the service given to the woman by the highest‐qualified health worker who she saw during her pregnancy. These include doctors/gynecologists followed by nurses/midwives. In individual record data, many countries followed the standardized DHS manual while coding variable names of maternal health providers based on their proficiency; however, recoding was required for some countries that managed the variable names differently (syntax is available on request). This procedure was used to ensure that consistent variable names and value labels were used for all outcome indicators across all study countries prior to merging. Some countries regard auxiliary health workers as skilled staff while others used the WHO definition that includes the following worker categories: gynecologist, doctor, midwife, nurse and clinical supervision or multidisciplinary HPs. However, the decision to include auxiliary health workers (usually only a very small percentage) to either skilled or other categories was based on each country's DHS report. Details of the general categorization are shown in Appendix S3.
3. RESULTS
3.1. Coverage of maternal health services
About 54 percent women with live birth in the 5 years preceding the survey received delivery service from skilled personnel during delivery, whereas the percentage of women who received both ANC and delivery service from skilled personnel was 52 percent. The coverage of recommended ANC service, that is, at least four ANC services with the first ANC visit in the first trimester, was only 25 percent. Figure 1 shows regional and country‐specific cascade of maternal health service coverage. Indicators included in Figure 1 are described in Table 4.
Figure 1.
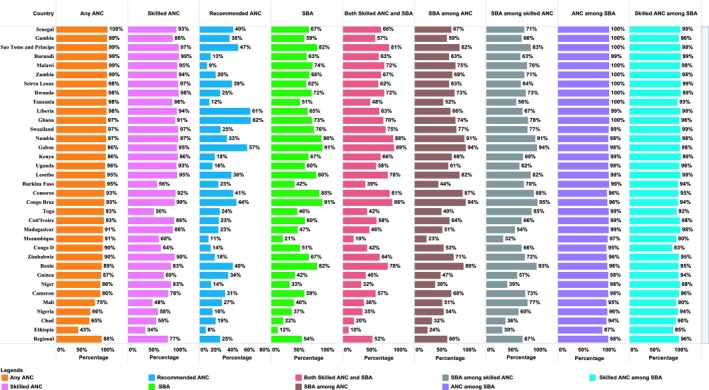
Country‐specific coverage of maternal health services in sub‐Saharan Africa [Color figure can be viewed at wileyonlinelibrary.com]
Table 4.
Definition of indicators/variables included in Figure 1
| Indicator | Description |
|---|---|
| Any ANC | Percentage of women who received at least one antenatal care service from any provider (among all women with a live birth 5 y preceding the survey) |
| Skilled ANC | Percentage of women who received at least one antenatal care service from skilled personnel |
| Recommended ANC | Percentage of women who received at least four antenatal care services, the first visit in the first trimester |
| SBA | Percentage of women who were attended by skilled personnel during delivery |
| Both skilled ANC and SBA | Percentage of women who received both antenatal care delivery services from skilled providers. |
| ANC among SBA | Percentage of women who received at least one antenatal care service from any provider among those who were assisted by skilled personnel during delivery. |
| Skilled ANC among SBA | Percentage of women who received skilled antenatal care service among those who were assisted by skilled personnel during delivery. |
| SBA among ANC: | Percentage of women who were assisted by skilled personnel during delivery among those who received antenatal service from any provider |
| SBA among skilled ANC | Percentage of women who were assisted by skilled personnel during delivery among those who received antenatal service from skilled personnel |
Abbreviations: ANC, antenatal care; Rec ANC, recommended ANC; SBA, skilled birth attendance.
3.2. Descriptive statistics: level‐one and level‐two factors
Table 2 summarizes the descriptive statistics of all variables included in the final model, considering women with no missing values in each of the variables. The median age for the women included in the model was 28.8 (IQR = 7.2). The majority of women were married and rural dwellers. Fifty‐eight percent of the women had only one birth in the 5 years preceding the survey. The majority (74.0 percent) of the women reported that they wanted to have a baby at the time they became pregnant. The mean gestational age during the first ANC visit was 4.2 months (SD = 1.6).
Table 2.
Descriptive statistics of outcome indicators, as well as level‐one and level‐two predictors
| N | Mean (%) | SD | Min | Max | |
|---|---|---|---|---|---|
| A. Level‐one (individual level) descriptive statistics | |||||
| Age (y) | 245 178 | 28.97 | 7.24 | 15.00 | 49.00 |
| Urban (%) | 245 178 | 30.00 | 46.00 | 0.00 | 100.00 |
| Literate (%) | 244 497 | 48.00 | 50.00 | 0.00 | 100.00 |
| Married (%) | 245 178 | 86.00 | 34.00 | 0.00 | 100.00 |
| Middle income (%) | 245 178 | 20.00 | 40.00 | 0.00 | 100.00 |
| Wealthy (%) | 245 178 | 38.00 | 48.00 | 0.00 | 100.00 |
| Wanted pregnancy (%) | 245 178 | 74.00 | 44.00 | 0.00 | 100.00 |
| Birth spacing (%) | 245 178 | 58.00 | 49.00 | 0.00 | 100.00 |
| Number of ANC visits | 245 178 | 4.24 | 1.75 | 0.00 | 30.00 |
| Birth order | 245 178 | 3.80 | 2.48 | 1.00 | 18.00 |
| ANC Timing | 245 178 | 4.24 | 1.56 | 1.00 | 9.00 |
| Skilled ANC | 245 178 | 77.00 | 42.00 | 0.00 | 100.00 |
| SBA | 245 178 | 53.00 | 50.00 | 0.00 | 100.00 |
| ANC and SBA | 245 178 | 51.00 | 50.00 | 0.00 | 100.00 |
| Recommended ANC | 245 178 | 20.00 | 40.00 | 0.00 | 100.00 |
| Birth order | 245 178 | 28.97 | 7.24 | 15.00 | 49.00 |
| B. Level‐two (country level) descriptive statistics | |||||
| Age in y | 34 | 28.90 | 0.79 | 27.46 | 30.75 |
| Birth order | 34 | 3.72 | 0.52 | 14.25 | 16.61 |
| Urban population (%) | 34 | 33.00 | 16.57 | 9.00 | 86.00 |
| Literacy (%) | 34 | 51.68 | 26.98 | 10.00 | 97.00 |
| Partner Edu. (%) | 34 | 66.74 | 26.24 | 17.72 | 98.00 |
| Wanted pregnancy (%) | 34 | 69.00 | 15.00 | 33.00 | 91.00 |
| Pop (millions) | 34 | 22.59 | 33.11 | 0.16 | 172.82 |
| Survey time | 34 | 6.56 | 1.91 | 1.00 | 9.00 |
| Middle income (%) | 34 | 44.00 | 50.00 | 0.00 | 100.00 |
| GDP per capita ($) | 34 | 2870.47 | 3268.58 | 693.47 | 17919.06 |
| HP per 10 000 pop. | 34 | 9.30 | 10.3 | 4.00 | 51.10 |
See Table 1 for coding details of the variables.
Abbreviations: N, sample size; SD, standard deviation; Partner Edu, Partner's education, HP per 10 000 pop., health professionals (physicians and midwives/nurses) per 10 000 population.
For the country‐level analyses, the mean literacy rate was 52.0 percent (SD = 27.0 percent), varying from 10.0 percent in Niger to 97.0 percent in Lesotho. The average ratio of physicians and nurses to population was 9:10 000 (SD = 10.3). Other than the three countries in the middle‐income group, all countries had less than the minimum requirement of 23 physicians/nurses per 10 000 population.
3.3. Multilevel modeling
3.3.1. Skilled birth attendance
There is a significant difference in SBA service utilization across countries; however, the expected country‐level predictors such as HPs per 10 000 population and gross domestic product (GDP) per capita were excluded from the model during the screening process. Another predictor, income status of countries, did not explain a significant difference in SBA service utilization (Table 3).
After controlling level‐one and level‐two factors, the main predictor of SBA utilization was found to be receiving ANC from skilled personnel. The odds of SBA service utilization for those who received at least one episode of ANC service from skilled personnel were on average 5.8 times (AOR = 5.81, 95% CI = 3.75, 9.01) higher than for those who did not receive the service. Unadjusted relationship between ANC and SBA at country‐specific and overall regional level is also displayed in Appendix S4.
The association between skilled ANC and SBA increased for women in middle‐income countries compared to those in low‐income countries. Countries with a higher literacy rate saw a decreased association between ANC and SBA. Controlling for other factors, the odds of SBA service utilization for those who resided in urban areas were about twice as high as those who resided in rural areas.
3.3.2. Recommended antenatal care
The following predictors had significant associations with service uptake: age of the respondent, residence, literacy status, parity, and whether the pregnancy was wanted by the time the women became pregnant (see Table 3). The odds of receiving the recommended number of ANC visit was on average was 40.7 percent (AOR = 1.41, 95% CI = 1.29, 1.53) higher for the wealthy and middle‐income women than for poor women. The odds of getting the service were on average 20 percent higher for women whose pregnancy was wanted by the time they became pregnant than women who either wanted to delay pregnancy or did not want any more children.
3.3.3. Antenatal care and skilled birth attendance
Keeping all other predictors constant, residence and wealth index of the woman were the main predictors of ANC and SBA service utilization combined (see Table 3). The odds of receiving both services were on average about two times higher (AOR = 2.17, 95% CI = 1.71, 2.76) for those who resided in an urban area than for those residing in a rural area. Similarly, the odds of receiving both ANC and SBA services for women in upper and middle quintile were on average two times that of those in lower quintile (poorer and poorest).
4. DISCUSSION
This study examined key maternal health indicators including SBA, recommended ANC, and use of both ANC and SBA services for the most recent live birth in the 5 years preceding the most recent DHS in each of the selected countries. Individual‐ and country‐level factors contributed to the low coverage of maternal health services. While individual‐level factors are the main predictors for three of the maternal health indicators, key country‐level factors such as literacy rate altered the relationship.
Skilled birth attendance is critically important to reduce maternal and child deaths; ANC is mainly important to detect and prevent both maternal and neonatal adverse events and to increase assisted delivery.38, 39 Although all women deserve to be assisted by skilled health personnel during delivery, only about half of the women surveyed received this service. One of the contributing factors to attaining this goal is the number of HPs per head of population. The WHO established that at least 23 HPs per 10 000 population are necessary to deliver essential maternal and child health services.40 The coverage of maternal health services is expected to improve as HPs per 10 000 population increases. However, our findings indicated that HPs per 10 000 population is not a significant predictor in the model because only three of the 34 countries in this study met this minimum threshold, while the rest were far below the threshold. With this evidence, it might not be surprising that the region's skilled maternal health service coverage is the lowest in the world.
The finding revealed that women who had only one birth, counting twins as one birth, 5 years preceding the survey were more likely to receive maternal health services than those who had two or more births. Birth order and birth interval were also significant predictors. This is in line with previous studies.41, 42 This resulted in the likelihood of improving maternal and child survival.43 Therefore, it is important to note that efforts to ensure birth spacing and birth limiting would help to enhance maternal health service utilization as well as to improve maternal health.
Skilled ANC service provision had the highest achievement in the region, as previously reported by Gill et al.1 However, the high level of maternal mortality accompanying these high levels of ANC coverage in the region suggests that service quality is suboptimal.4 Our findings revealed that the WHO recommendation of at least four ANC visits, with the first ANC visit in the first trimester,9, 38 was limited to less than one‐third of the mothers. Moreover, although skilled ANC was the strongest predictor of SBA, 33 percent of ANC attendees did not receive SBA service. Hence, given that coverage is already high, future efforts need to focus on the quality of ANC service in the region. The socioeconomic status of the countries modified the association between ANC and SBA. For women in middle‐income countries, this association was further increased. In such countries, there may be better human resources and infrastructure to ensure that ANC attendees receive SBA service during delivery and the quality of ANC may be greater. This highlights the importance of social determinants of health in examining reproductive health outcomes.
On the other hand, the gap between ANC and SBA could partly be due to the fact that SBA service, sometimes referred to as institutional delivery, is provided in health facilities whereas ANC can also be accessed through outreach services at community level in many African settings.44 However, this needs further research and intervention. We also suggest further research to assess why recommended ANC coverage is even much lower than SBA coverage.
Place of residence is another important factor for maternal health service utilization. The disparity in the proportion of skilled personnel between urban and rural areas affirms this reality. As understaffing of midwifery and emergency obstetric services is common in rural areas,27 strategies to attract and retain health workers in remote and rural areas45 could help to reach the least privileged women. Empowering women through economic strengthening schemes and education may also improve maternal health service utilization.
There were some strategies used to address the limitations in the datasets. The effect of up to 10‐year difference in the survey dates in the countries examined was controlled by including the survey time as part of the model. We used country‐level categorization of skilled health workers as not all countries followed the WHO definition. However, there were some data availability issues which prevented us from further analyzing the skillsets and competency of the providers of ANC and SBA. More than 15 percent of women were excluded from the analysis; however, this did not significantly affect the analysis as those women were distributed proportionally across all countries and key predictor variables. Level‐two predictors were limited to data availability. Finally, as emphasized by Graham et al,46 the information gathered from population‐based surveys was based on a self‐reported qualification of the birth attendant, not on the provider skills. Hence, the SBA data might not indicate the actual proficiency of the health workers.
5. CONCLUSIONS AND RECOMMENDATIONS
Based on the findings of this study, the following conclusions and recommendations are made.
Use of a hierarchical model when analyzing multicountry data is appropriate since the model can quantify the extent of country‐ and individual‐level variations.
Although the coverage of skilled ANC was found to be high in most countries, there was no corresponding coverage of recommended ANC or SBA coverage in those countries.
ANC was found to be the strongest predictor of SBA and its effect was modified by country‐level predictors, mainly women's literacy rate and the countries’ economic status. Urbanization and the wealth index were also associated with both ANC and SBA service utilization.
Policy attention is needed to improve access, utilization, and quality of maternal health services in SSA.
Further research should focus on exploring the various bottlenecks on the quality and continuity of maternal health service utilization in the region.
CONFLICT OF INTEREST
The authors declare that they have no conflict of interest.
AUTHOR CONTRIBUTIONS
MAW conceptualized the study, extracted the data, conducted data analysis, and prepared the draft manuscript. DM provided statistical support on data analysis. JH, WM, DM, and JB reviewed and revised the draft manuscript with substantial input. All authors read and approved the manuscript for submission.
DATA SHARING STATEMENT
This study used existing datasets from the Demographic and Health Survey (DHS) Program. Data are accessible free of charge on registration with the DHS Program from the following DHS website: https://dhsprogram.com/data/available-datasets.cfm.
Supporting information
ACKNOWLEDGMENTS
Joint Acknowledgment/Disclosure Statement: The data are sourced from MEASURE DHS ICF through online access. The authors are grateful to the owners of the data for authorizing free access to all sub‐Saharan Africa DHS data. Our gratitude also goes to Associate Professor Timothy Moore for his editing support. Swinburne University of Technology provided both technical and financial support for this study.
Woldegiorgis MA, Hille J, Mekonnen W, Meyer D, Bhowmik J. Determinants of antenatal care and skilled birth attendance in sub‐Saharan Africa: A multilevel analysis. Health Serv Res. 2019;54:1110‐1118. 10.1111/1475-6773.13163
Funding information
This work was supported by Swinburne University of Technology, a postgraduate research Award.
REFERENCES
- 1. Gill K, Pande R, Malhotra A. Women deliver for development. Lancet. 2007;370(9595):1347‐1357. [DOI] [PubMed] [Google Scholar]
- 2. Campbell OM, Graham WJ, LMSSs Group . Strategies for reducing maternal mortality: getting on with what works. Lancet. 2006;368(9543):1284‐1299. [DOI] [PubMed] [Google Scholar]
- 3. World Health Organization . Mother‐baby package: implementing safe motherhood in countries: practical guide. 1996.
- 4. Lincetto O, Mothebesoane‐Anoh S, Gomez P, Munjanja S. Antenatal care In: Lord D, Wake R, Elder L, Grear K, Antayhua A. ed. Opportunities for Africa's Newborns: Practical Data, Policy and Programmatic Support for Newborn Care in Africa. Cape Town, SA: Mills Litho; 2006:55‐62. [Google Scholar]
- 5. Warren C, Daly P, Toure L, Mongi P. Postnatal care In: Lord D, Wake R, Elder L, Grear K, Antayhua A, ed. Opportunities for Africa' s Newborns Cape Town, South Africa: Partnership for Maternal, Newborn and Child Health. Cape Town, SA: Mills Litho; 2006:79‐90. [Google Scholar]
- 6. World Health Organization . Reproductive health indicators: guidelines for their generation, interpretation and analysis for global monitoring. 2006.
- 7. Mahler H. The safe motherhood initiative: a call to action. Lancet. 1987;1(8534):668. [DOI] [PubMed] [Google Scholar]
- 8. Darmstadt GL, Bhutta ZA, Cousens S, et al. Evidence‐based, cost‐effective interventions: how many newborn babies can we save? Lancet. 2005;365(9463):977‐988. [DOI] [PubMed] [Google Scholar]
- 9. World Health Organization . WHO Recommendations on Antenatal Care for a Positive Pregnancy Experience. Geneva: World Health Organization; 2016. [PubMed] [Google Scholar]
- 10. Chaudhury N, Hammer J, Kremer M, Muralidharan K, Rogers FH. Missing in action: teacher and health worker absence in developing countries. J Econ Perspect. 2006;20(1):91‐116. [DOI] [PubMed] [Google Scholar]
- 11. World Health Organization . World Health Statistics 2010. Geneva: World Health Organization; 2010. [Google Scholar]
- 12. Anyangwe SC, Mtonga C. Inequities in the global health workforce: the greatest impediment to health in sub‐Saharan Africa. Int J Environ Res Public Health. 2007;4(2):93‐100. [DOI] [PMC free article] [PubMed] [Google Scholar]
- 13. Family Care International Starrs A, Motherhood I‐AGfS . The Safe Motherhood Action Agenda: Priorities for the Next Decade: Report on the Safe Motherhood Technical Consultation, 18‐23 October 1997, Colombo, Sri Lanka. Family Care International; 1998.
- 14. Shiferaw S, Spigt M, Godefrooij M, Melkamu Y, Tekie M. Why do women prefer home births in Ethiopia? BMC Pregnancy Childbirth. 2013;13(1):5. [DOI] [PMC free article] [PubMed] [Google Scholar]
- 15. Mselle LT, Moland KM, Mvungi A, Evjen‐Olsen B, Kohi TW. Why give birth in health facility? Users’ and providers’ accounts of poor quality of birth care in Tanzania. BMC Health Serv Res. 2013;13(1):174. [DOI] [PMC free article] [PubMed] [Google Scholar]
- 16. Harvey SA, Blandón YCW, McCaw‐Binns A, et al. Are skilled birth attendants really skilled? A measurement method, some disturbing results and a potential way forward. Bull World Health Organ. 2007;85(10):783‐C. [DOI] [PMC free article] [PubMed] [Google Scholar]
- 17. Adegoke A, Van Den Broek N. Skilled birth attendance‐lessons learnt. BJOG. 2009;116(s1):33‐40. [DOI] [PubMed] [Google Scholar]
- 18. Pearson L, Shoo R. Availability and use of emergency obstetric services: Kenya, Rwanda, Southern Sudan, and Uganda. Int J Gynaecol Obstet. 2005;88(2):208‐215. [DOI] [PubMed] [Google Scholar]
- 19. Bohren MA, Hunter EC, Munthe‐Kaas HM, Souza JP, Vogel JP, Gülmezoglu AM. Facilitators and barriers to facility‐based delivery in low‐and middle‐income countries: a qualitative evidence synthesis. Reprod Health. 2014;11(1):71. [DOI] [PMC free article] [PubMed] [Google Scholar]
- 20. Chukwuma A, Wosu AC, Mbachu C, Weze K. Quality of antenatal care predicts retention in skilled birth attendance: a multilevel analysis of 28 African countries. BMC Pregnancy Childbirth. 2017;17(1):152. [DOI] [PMC free article] [PubMed] [Google Scholar]
- 21. McTavish S, Moore S, Harper S, Lynch J. National female literacy, individual socio‐economic status, and maternal health care use in sub‐Saharan Africa. Soc Sci Med. 2010;71(11):1958‐1963. [DOI] [PubMed] [Google Scholar]
- 22. United Nations . The Millennium Development Goals Report 2014. New York, NY: United Nations; 2014. [Google Scholar]
- 23. United Nations . The Millennium Development Goals Report 2015. New York, NY: United Nations; 2015. [Google Scholar]
- 24. Gabrysch S, Campbell OM. Still too far to walk: literature review of the determinants of delivery service use. BMC Pregnancy Childbirth. 2009;9(1):1. [DOI] [PMC free article] [PubMed] [Google Scholar]
- 25. Ahmed S, Creanga AA, Gillespie DG, Tsui AO. Economic status, education and empowerment: implications for maternal health service utilization in developing countries. PLoS ONE. 2010;5(6):1‐6. [DOI] [PMC free article] [PubMed] [Google Scholar]
- 26. Babalola S, Fatusi A. Determinants of use of maternal health services in Nigeria ‐ looking beyond individual and household factors. BMC Pregnancy Childbirth. 2009;9(1):43. [DOI] [PMC free article] [PubMed] [Google Scholar]
- 27. Gerein N, Green A, Pearson S. The implications of shortages of health professionals for maternal health in sub‐Saharan Africa. Reprod Health Matters. 2006;14(27):40‐50. [DOI] [PubMed] [Google Scholar]
- 28. Woldegiorgis MA, Hiller JE, Mekonnen W, Bhowmik J. Disparities in maternal health services in sub‐Saharan Africa. Int J Public Health. 2018;63(4):525‐535. [DOI] [PubMed] [Google Scholar]
- 29. Kruk ME, Prescott MR, Galea S. Equity of skilled birth attendant utilization in developing countries: financing and policy determinants. Am J Public Health. 2008;98(1):142‐147. [DOI] [PMC free article] [PubMed] [Google Scholar]
- 30. ICF International . Survey Organization Manual for Demographic and Health Surveys. Calverton, MD: ICF International; 2012. [Google Scholar]
- 31. ICF International . Demographic and Health Survey Sampling and Household Listing Manual. Calverton, MD: ICF International; 2012. [Google Scholar]
- 32. Rutstein SO, Rojas G. Guide to DHS statistics, Demographic and Health Survey methodology. Demographic and Health Survey's DHS Toolkit of methodology for the MEASURE DHS Phase III project, implemented from 2008‐2013. Calverton, MD: Demographic and Health Surveys, ORC Macro; 2006.
- 33. MEASURE DHS/ICF International . Standard recode manual for DHS 6. Demographic and Health Survey's DHS Toolkit of methodology for the MEASURE DHS Phase III project, implemented from 2008‐2013 2013.
- 34. The DHS Program . Protecting the Privacy of DHS Survey respondents n.d.; http://dhsprogram.com/What-We-Do/Protecting-the-Privacy-of-DHS-Survey-Respondents.cfm. Accessed March 25, 2017.
- 35. World Bank . World Development Indicators: Population dynamics. n.d.; http://wdi.worldbank.org/table/2.1. Accessed July 25, 2016.
- 36. Diez‐Roux AV. Multilevel analysis in public health research. Annu Rev Public Health. 2000;21(1):171‐192. [DOI] [PubMed] [Google Scholar]
- 37. Guo G, Zhao H. Multilevel modeling for binary data. Ann Rev Sociol. 2000;26:441‐462. [Google Scholar]
- 38. Lincetto O, Mothebesoane‐Anoh S, Gomez P, Munjanja S. Antenatal Care: Opportunities for Africa's Newborns. New York, NY: World Health Organization; 2010. [Google Scholar]
- 39. Carroli G, Rooney C, Villar J. How effective is antenatal care in preventing maternal mortality and serious morbidity? An overview of the evidence. Paediatr Perinat Epidemiol. 2001;15(s1):1‐42. [DOI] [PubMed] [Google Scholar]
- 40. World Health Organization . Achieving the health‐related MDGs. It takes a workforce! n.d.; http://www.who.int/hrh/workforce_mdgs/en/. Accessed March 21, 2017.
- 41. Winikoff B. The effects of birth spacing on child and maternal health. Stud Fam Plann. 1983;14:231‐245. [PubMed] [Google Scholar]
- 42. Conde‐Agudelo A, Rosas‐Bermúdez A, Kafury‐Goeta AC. Effects of birth spacing on maternal health: a systematic review. Am J Obstet Gynecol. 2007;196(4):297‐308. [DOI] [PubMed] [Google Scholar]
- 43. Setty‐Venugopal V, Upadhyay UD. Birth spacing: three to five saves lives. Population Rep Ser L Issues World Health. 2002;13:1‐23. [PubMed] [Google Scholar]
- 44. Kerber KJ, de Graft‐Johnson JE, Bhutta ZA, Okong P, Starrs A, Lawn JE. Continuum of care for maternal, newborn, and child health: from slogan to service delivery. Lancet. 2007;370(9595):1358‐1369. [DOI] [PubMed] [Google Scholar]
- 45. Dolea C, Stormont L, Braichet J‐M. Evaluated strategies to increase attraction and retention of health workers in remote and rural areas. Bull World Health Organ. 2010;88(5):379‐385. [DOI] [PMC free article] [PubMed] [Google Scholar]
- 46. Graham WJ, Bell JS, Bullough CH, De Brouwere V, Van Lerberghe W. Can skilled attendance at delivery reduce maternal mortality in developing countries In: De Brouwere V, Van Lerberghe W, eds. Safe Motherhood Strategies: A Review of the Evidence. Antwerp, Belgium: ITGPressPublisher; 2001:97‐130. [Google Scholar]
- 47. World Health Organization . Making Pregnancy Safer, the critical role of the skilled attendant. 2004.
Associated Data
This section collects any data citations, data availability statements, or supplementary materials included in this article.
Supplementary Materials