

Abstract
Objective
To evaluate the implementation and outcomes of evidence‐based fall‐risk‐reduction processes when those processes are implemented using a multiteam system (MTS) structure.
Data Sources/Study Setting
Fall‐risk‐reduction process and outcome measures from 16 small rural hospitals participating in a research demonstration and dissemination study from August 2012 to July 2014. Previously, these hospitals lacked a fall‐event reporting system to drive improvement.
Study Design
A one‐group pretest‐posttest embedded in a participatory research framework. We required hospitals to implement MTSs, which we supported by conducting education, developing an online toolkit, and establishing a fall‐event reporting system.
Data Collection
Hospitals used gap analyses to assess the presence of fall‐risk‐reduction processes at study beginning and their frequency and effectiveness at study end; they reported fall‐event data throughout the study.
Principal Findings
The extent to which hospitals implemented 21 processes to coordinate the fall‐risk‐reduction program and trained staff specifically about the program predicted unassisted and injurious fall rates during the end‐of‐study period (January 2014‐July 2014). Bedside fall‐risk‐reduction processes were not significant predictors of these outcomes.
Conclusions
Multiteam systems that effectively coordinate fall‐risk‐reduction processes may improve the capacity of hospitals to manage the complex patient, environmental, and system factors that result in falls.
Keywords: falls, implementation evaluation, multiteam systems, patient safety, quality improvement
1. INTRODUCTION
Approximately 3 percent of hospitalized patients fall annually.1, 2 Nearly one‐fourth of these falls result in injury3 with an average associated excess cost of $7000 per injury.4 Regardless of injury, falling can lead to fear that limits mobility and accelerates functional decline.5 To incentivize safer care, serious fall‐related injuries have been categorized as a preventable hospital‐acquired condition (HAC) since 2008. There are now 14 HACs for which the Centers for Medicare and Medicaid Services no longer reimburse hospitals that receive payment under the Prospective Payment System if the condition was not present on admission.6 The most recent national evaluation of this “pay‐for‐outcomes” program revealed limited impact on serious fall‐related injuries. The incidence of serious fall‐related injuries per 1000 discharges decreased 15 percent from 2010 to 2015.7 In comparison, the incidence of central line‐associated bloodstream infections and catheter‐associated urinary tract infections decreased 91 and 33 percent, respectively, per 1000 discharges during the same period.7
Reasons for limited progress in decreasing fall‐related injuries include the complex etiology of falls and lack of rigorous research regarding the impact of system interventions8 to adaptively manage this complexity.9 The etiology of falls includes patient, environmental, and system risk factors. Patient factors include the following: age >80 years, muscle weakness, history of falls, gait and balance deficits, use of an assistive device, impaired cognition, urinary frequency/incontinence, and medication side effects.1, 10, 11, 12 Environmental factors include the following: clutter/tripping hazards, room design, inadequate lighting, and inappropriate furniture heights.1, 13 System factors include the following: the attitude that falls are inevitable,14 inadequate staffing,15 and poor teamwork, which has been linked to missed nursing care (eg, assisting transfers/mobility).16 Additional system factors include not integrating evidence from multiple disciplines, not using standard fall‐event definitions, and not learning from fall‐event data.17 Standard fall‐event definitions are needed to aggregate fall‐event data for benchmarking that reveals the scope of risk to patients and supports resource prioritization.18
Falls and fall‐related injuries are an outcome of the structure and process of a health care system. Within Donabedian's19 framework, outcomes are defined as changes in individuals and populations due to health care, and structure refers to how care is organized, financed, and delivered. Structure determines a system's capacity for work and may be the primary determinant of the quality of care a system can deliver.19 Process refers to actions taken; how people use structures to produce outcomes.19 Donabedian's19 structure‐process‐outcome framework is a system of interacting elements that is causal in nature—improving outcomes requires innovation in structure and/or process. A reductionistic focus on one element of a system is insufficient to mitigate a complex adverse outcome such as a patient fall.20 Consequently, randomized controlled trials of individual processes such as use of bed/chair pressure sensors,21, 22 low‐low beds,23 and patient education24 have not significantly decreased fall risk. Bundling multiple processes may decrease fall risk by 30 percent, but the ideal combination of processes14 and the most effective implementation structure remains unknown.25
Effective team functioning is one of the Institute of Medicine's five principles for implementing health care safety systems that seek high reliability.26 Empirical studies27, 28, 29, 30, 31 and systematic reviews14, 32 of inpatient fall‐risk‐reduction programs have established that an interprofessional team is more effective than a nursing‐centric structure to sustain decreases in fall rates. A team is two or more people with complementary skills and specific roles who interact to achieve a collective goal.33 However, health care is a sociotechnical system; human beings work in social structures within complex technical environments to achieve goals too large and complex for a single team.34 Achieving large, complex goals requires coordination within and between multiple teams.34 Multiteam systems (MTSs) consist of two or more component teams that interact to manage complex sociotechnical systems and achieve a collective goal.35 Effective coordination among component teams within an MTS achieves system goals by planning, standardizing, and adjusting processes in real time.36 These three elements of effective coordination—planning, standardizing, and adjusting—ensure accountability when roles and responsibilities are clarified, predictability when the actions and needs of others are anticipated, and a shared mental model of how coordinated component team processes achieve a collective goal37 such as fall‐risk reduction.
A typical health care MTS consists of three interprofessional component teams: coordinating, core, and contingency teams. Coordinating teams lead the MTS by managing resources38 and team performance. Team performance management requires coordinating component team processes and conducting training to improve team member knowledge and skills.39 Coordination and training are leadership functions that establish role clarity and accountability,40 which is important when component team members are temporally (across shifts) and geographically (across departments) dispersed41 as in fall‐risk‐reduction. Core teams composed of licensed and unlicensed staff provide direct patient care. Contingency teams, composed of members from various component teams, conduct debriefs (also known as huddles) to adaptively manage risk by reflecting on an event.38 Debriefs and huddles improve MTS coordination when knowledge is shared across component teams.42, 43 The Joint Commission identifies postfall huddles as a key component of postfall management.44
While it is established that an interprofessional team can reduce fall risk,14, 27, 28, 29, 30, 31, 32 little is known about the coordination of processes across diverse professionals and teams that may be needed to adaptively manage the complexity of inpatient fall‐risk‐reduction. The purpose of this study is to evaluate the implementation of evidence‐based fall‐risk‐reduction processes and their impact on fall‐related outcomes when those processes are implemented using an MTS structure.
2. METHODS
2.1. Study design
We used a one‐group pretest‐posttest design embedded in a participatory research framework, which was consistent with the funding mechanism described below. Participatory research facilitates social change when researchers and organizations collaborate to solve problems by applying theory to reality.45 This study, Collaboration and Proactive Teamwork Used to Reduce (CAPTURE) Falls, was approved by the Institutional Review Board of the University of Nebraska Medical Center.
2.2. Setting, participants, and procedures
From August 2012 through July 2014, health care professionals in a collaborative of 16 small rural hospitals in a Midwestern state participated in this research demonstration and dissemination study funded by the Agency for Healthcare Research and Quality (AHRQ). The purpose of this funding mechanism was twofold: (a) to implement safe practices that demonstrate evidence of reducing errors and risks associated with health care processes; and (b) to inform AHRQ, providers, patients, and payers about implementation of safe practices in diverse settings. Of the 16 hospitals, 15 were Critical Access Hospitals (CAHs), which are licensed for 25 beds or less; the one non‐CAH was licensed for <50 beds. These hospitals were located in 16 unique counties with an average population of 12 087 per county (Table 1). They had previously participated in a cross‐sectional survey to assess the quality of fall‐risk‐reduction in Nebraska hospitals.17 Nebraska is a rural state in which 76 percent of the 84 general community hospitals are CAHs.46 The results of that study revealed the problem to be addressed in the current study: The risk of falls and fall‐related injuries was significantly greater among the state's CAHs as compared to its larger hospitals.
Table 1.
Hospital contextual factors and fall‐rate outcomes among 16 hospitals by three coordination‐effectiveness levelsa
| Contextual factors and fall‐rate outcomes | Aggregate (n = 16) | Lowa (n = 5) | Moderatea (n = 6) | Higha (n = 5) | P value |
|---|---|---|---|---|---|
| Baseline period (2012) | |||||
| Licensed beds, mean (SD or range) | 26 (6) | 24 (18‐25) | 24 (18‐25) | 29 (25‐47) | NA |
| 2010 county population, mean (SD)b | 12 087 (7792) | 12 722 (6495) | 10 693 (7145) | 13 124 (10 814) | 0.82‡ |
| 2010 proportion of county population 65+ years of age, mean (SD)b | 0.19 (0.04) | 0.20 (0.03) | 0.18 (0.04) | 0.18 (0.04) | 0.64‡ |
| Use Agency for Healthcare Research and Quality fall definition, No. (%) | 3 (19%) | 0 (0%) | 1 (17%) | 2 (40%) | 0.46§ |
| Integrate fall‐risk‐reduction evidence from multiple disciplines, No. (%) | 7 (44%) | 1 (20%) | 4 (67%) | 2 (40%) | 0.39§ |
| Interprofessional team accountable for fall‐risk‐reduction, No. (%) | 1 (6%) | 0 (0%) | 1 (17%) | 0 (0%) | 1.0§ |
| Total patient days, mean (SD) | 2972 (1893) | 3100 (1556) | 2352 (1280) | 3589 (2809) | 0.85‡ |
| Total fall rate, mean (SD) | 5.1 (1.6)** | 5.6 (0.8) | 4.8 (1.5) | 4.9 (2.3) | 0.70‡ |
| Injurious fall rate, mean (SD) | 1.7 (1.0)** | 2.4 (0.9) | 1.0 (0.6) | 1.8 (1.1) | 0.043‡ |
| Unassisted fall rate, mean (SD) | 4.0 (1.8)** | 4.5 (0.8) | 2.7 (1.5) | 4.4 (2.3) | 0.32‡ |
| Duration of study (August 2012‐July 2014) | |||||
| Number of 31 study activities in which hospital participated, mean (SD) | 21 (6) | 19 (7) | 20 (5) | 24 (7) | 0.24‡ |
| Postfall huddle rate, mean (SD) | 0.67 (0.18) | 0.64 (0.12) | 0.65 (0.22) | 0.73 (0.21) | 0.43‡ |
| Repeat fall rate, mean (SD) | 1.12 (0.13) | 1.13 (0.08) | 1.11 (0.17) | 1.13 (0.15) | 0.67‡ |
| End‐of‐study period (January‐July 2014) | |||||
| Fall‐risk‐reduction coordination‐effectiveness score, mean (SD)a | 54.3 (8.5) | 44.8 (3.4) | 54.0 (2.6) | 64.0 (4.3) | NA |
| Total patient days, mean (SD) | 1551 (992) | 1507 (7987) | 1257 (594) | 1947 (1512) | 0.77‡ |
| Total fall rate, mean (SD) | 4.5 (1.9)** | 5.8 (2.4) | 4.7 (1.4) | 3.1 (0.6) | 0.098‡ |
| Injurious fall rate, mean (SD) | 2.0 (2.3)** | 3.4 (3.5) | 1.6 (1.4) | 1.0 (1.0) | 0.22‡ |
| Unassisted fall rate, mean (SD) | 3.7 (2.0)** | 5.1 (2.5) | 3.6 (1.7) | 2.4 (0.8) | 0.033‡ |
These levels were based on the distribution of the fall‐risk‐reduction coordination‐effectiveness score (low = 40‐49, moderate = 51‐58, and high = 59‐69), which was the coordinating team's rating of their effectiveness implementing 21 processes (0 = not performed to 4 = very effective) using the gap analysis (Appendix S2) at study end.
Reference.74
Statistical significance calculated using: ‡Kruskal‐Wallis exact test for differences between levels of coordination. §Pearson chi‐square exact test for differences between levels of coordination. **Paired samples t test (no statistically significant differences between baseline and end‐of‐study period).
We sought to improve fall‐risk‐reduction structure by requiring each hospital to form an interprofessional coordinating team to lead the fall‐risk‐reduction MTS. In addition, we developed a system for all hospitals to report, benchmark, and learn from fall events. Reflecting the complementary skills needed to mitigate patient, environmental, and system fall‐risk factors, we recommended that each coordinating team include at a minimum staff from nursing, pharmacy, physical and/or occupational therapy, and patient safety/quality improvement.17 Consistent with best practices in quality improvement implementation, we also recommended that teams span the authority gradient from unlicensed personnel (eg, certified nursing assistant) to a senior leader (eg, director of nursing).47, 48
We developed the CAPTURE Falls learning form (Appendix S1) for hospitals to report inpatient falls via U.S. mail or secure email. This form collected patient, environmental, and system data, building upon the common format for fall events developed by AHRQ.49 Thus, a fall was defined as “a sudden, unintended, uncontrolled downward displacement of a patient's body to the ground or other object” and included unassisted and assisted falls—when a patient is assisted to the ground by hospital staff.49 Just three of the 16 hospitals used this definition prior to the study (Table 1). Levels of injury collected on the form ranged from minor harm to death and were consistent with those used by the National Database of Nursing Quality Indicators.50
During the first quarter of the study, we conducted site visits to help each coordinating team develop a customized action plan using a gap analysis completed for the previous survey17 and to educate them to use the CAPTURE Falls learning form (Appendix S1). This initial gap analysis assessed presence vs absence of processes only. The education emphasized reporting assisted falls as system successes because assisted falls are less likely to result in injury than unassisted falls50 and reporting assisted falls provides feedback about the effectiveness of training core team members in safe transfers/mobility. This training facilitates early mobilization of patients, which is essential to prevent secondary functional decline,51, 52 and it should include principles of postural control, bed mobility, body mechanics, use of devices and lifts,53 and techniques to assist gait.54
Reflecting the participatory nature of the design, we interacted with coordinating teams throughout the study by conducting:
11 one‐hour learning modules with the collaborative, which were posted in our online toolkit;55
19 half‐hour conference calls conducted monthly with the collaborative to share lessons learned from reported fall events and to address implementation barriers;55 and
quarterly conference calls with each coordinating team to monitor action plan implementation, reflect about causes of specific falls, identify patterns in aggregate fall‐event data (eg, location of falls, absence of interventions), and overcome implementation barriers.
CAPTURE Falls was a complex social intervention (CSI). By definition, CSIs consist of multiple components customized to fit an organization's unique context. People implement CSIs to improve multiple outcomes by working in teams across multiple organizational levels.56 CAPTURE Falls was a CSI comprised of multiple processes that each coordinating team prioritized and adapted to fit their context using their initial gap analysis. The coordinating, contingency, and core teams implemented these processes at organization, unit, and patient levels, respectively. Consistent with best practices to evaluate CSIs, our evaluation procedures:
assessed the extent to which the intervention was implemented,
determined whether the relationship between the intervention and outcome(s) was consistent with theory, and
established a “causal chain”56 regarding how interventions may produce changes in outcomes.56, 57
We used impact and process theories to guide the planning and evaluation of this study. Impact theories describe how an innovation will work, and process theories describe how to plan and organize the innovation.58 Donabedian's19 structure‐process‐outcome framework was our impact theory. We hypothesized that the MTS structure would improve organizational capacity to implement and coordinate fall‐risk‐reduction processes. Rogers’59 five stages of organization innovation was our process theory. We supported coordinating teams to complete the five stages: (a) identify the need for innovation using baseline fall rates and the gap analysis, (b) match evidence‐based innovations from collaborative education and the online toolkit to needs, (c) restructure the organization to implement innovations, (d) clarify fall‐risk‐reduction roles and tasks, and (e) routinize innovations by conducting audits and changing policy/procedure.
2.3. Outcome measures
The 16 hospitals reported patient, environmental, and system factors associated with 347 fall events and postfall huddle data for the 232 of those 347 falls that were followed by a huddle. We entered these data into a Microsoft® Access database and clarified inconsistencies and missing data with each coordinating team. We calculated five fall‐related outcome measures (Figure 1): rates per 1000 patient days for total, injurious, and unassisted falls during the end‐of‐study period (January‐July 2014); a repeat fall rate for the duration of the study; and perceptions of the frequency of reporting all falls (reporting‐fall‐events score) at the end of the study (Appendix S2, p. 6). To calculate fall rates, we requested patient days annually and at the end of the study. The denominator, total patient days, was the sum of patient days for acute, skilled, and hospice admissions plus hours patients were under observation divided by 24.17
Figure 1.
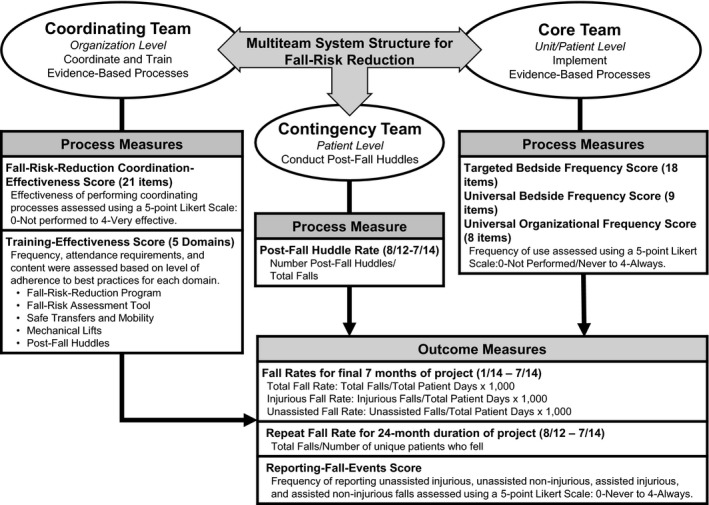
Process and outcome measures used to evaluate the use of a multiteam system to implement fall‐risk‐reduction among 16 hospitals
Note: Gap analysis with scoring rubric available in Appendix S2
2.4. Extent of process implementation measures
During the final quarter of the study, each coordinating team updated their gap analysis (Appendix S2) to rate the extent of process implementation for coordinating and core team processes. We compared these measures to the findings from our quarterly monitoring of each hospital's implementation progress. We calculated effectiveness or frequency scores for these processes by aggregating the ordinal ratings from the final gap analysis (Figure 1 and Appendix S2). There were six effectiveness scores to assess extent of process implementation by the coordinating team:
One coordination‐effectiveness score, which was the sum of the ratings of the effectiveness of 21 processes using a 5‐point scale (0‐not performed to 4‐very effective; Appendix S2, p. 2). Coordinating teams used these 21 processes listed in Table 2 to coordinate the fall‐risk‐reduction program.
Five training‐effectiveness scores (Appendix S2, p. 3): (a) purpose, interventions, and outcomes of the fall‐risk‐reduction program; (b) use of the fall‐risk assessment tool by nursing; (c) safe transfers/mobility; (d) use of mechanical lifts; and (e) how to conduct postfall huddles.
Table 2.
Comparison of 21 fall‐risk‐reduction coordinating team processes among 16 hospitals by three coordination‐effectiveness levelsa
| Coordinating team process at study end, mean (SD) | Coordination‐effectiveness score at study end | ||||
|---|---|---|---|---|---|
| Aggregate (n = 16) | Lowa (n = 5) | Moderatea (n = 6) | Higha (n = 5) | P valueb | |
| Processes reported as at least somewhat effective among the three levels (P > 0.10) | |||||
| Select fall‐risk assessment tool(s) | 3.3 (1.0) | 2.6 (1.5) | 3.5 (0.5) | 3.6 (0.5) | 0.30 |
| Select interventions to reduce risk of falls | 3.3 (0.6) | 3.0 (0.7) | 3.3 (0.5) | 3.4 (0.5) | 0.56 |
| Educate staff to report all falls (unassisted & assisted) | 3.3 (0.6) | 3.2 (0.8) | 3.5 (0.5) | 3.2 (0.4) | 0.64 |
| Educate staff to use fall‐risk assessment tool | 3.3 (1.0) | 2.8 (1.6) | 3.5 (0.5) | 3.4 (0.5) | 0.81 |
| Create fall‐risk‐reduction policies/procedures | 2.9 (0.9) | 3.0 (0.7) | 2.5 (1.2) | 3.2 (0.4) | 0.48 |
| Educate staff about fall‐risk‐reduction policies/procedures | 2.9 (0.6) | 2.6 (0.9) | 3.0 (0) | 3.2 (0.4) | 0.22 |
| Select/develop/revise fall reporting form | 2.8 (1.0) | 2.2 (1.3) | 3.2 (0.8) | 3.0 (0.7) | 0.33 |
| Educate staff about outcomes of fall‐risk‐reduction program | 2.7 (0.9) | 2.0 (1.2) | 3.0 (0.6) | 3.0 (0.7) | 0.19 |
| Processes that differed in reported effectiveness among the three levels (P < 0.10) | |||||
| Inform front‐line staff about actions taken to improve systems as a result of reported falls | 2.9 (0.9) | 2.4 (0.5) | 2.5 (0.8) | 3.8 (0.4) | 0.01 |
| Communicate fall‐risk‐reduction program barriers and successes to senior leaders | 2.8 (1.0) | 2.8 (0.4) | 2.2 (1.2) | 3.6 (0.5) | 0.03 |
| Educate staff to implement targeted fall‐risk‐reduction interventions | 2.7 (0.6) | 2.0 (0) | 3.0 (0) | 3.0 (0.7) | 0.01 |
| Analyze data regarding fall‐risk‐reduction program outcomes | 2.6 (0.7) | 2.2 (0.4) | 2.3 (0.5) | 3.4 (0.5) | 0.02 |
| Modify fall‐risk‐reduction policies/procedures based on fall‐related outcomes | 2.6 (1.3) | 1.4 (1.5) | 2.8 (0.8) | 3.6 (0.5) | 0.03 |
| Link targeted interventions to identified fall‐risk factors | 2.4 (1.2) | 1.6 (0.9) | 2.3 (1.4) | 3.4 (0.5) | 0.02 |
| Integrate evidence from multiple disciplines to improve fall‐risk‐reduction | 2.9 (1.2) | 2.6 (0.9) | 2.3 (1.5) | 3.8 (0.4) | 0.07 |
| Collect data regarding fall‐risk‐reduction program outcomes | 2.9 (0.6) | 2.6 (0.5) | 2.7 (0.5) | 3.4 (0.5) | 0.08 |
| Conduct audits of fall‐risk‐reduction interventions to monitor adherence | 2.1 (1.1) | 1.4 (0.9) | 2.2 (1.2) | 2.8 (1.1) | 0.096 |
| Processes reported as less than effective among the three levels (P > 0.10) | |||||
| Share fall‐risk‐reduction program and outcomes with hospital board | 1.9 (1.4) | 1.6 (1.5) | 1.7 (1.4) | 2.4 (1.5) | 0.56 |
| Communicate results of audits of fall‐risk‐reduction interventions to staff | 1.6 (1.4) | 0.8 (0.8) | 2.2 (1.3) | 1.6 (1.8) | 0.28 |
| Conduct or participate in individual root cause analysis of injurious falls | 1.4 (1.5) | 1.2 (1.6) | 1.2 (1.3) | 2.0 (1.9) | 0.54 |
| Conduct or participate in aggregate root cause analysis of multiple falls | 1.1 (1.3) | 0.8 (1.1) | 1.2 (1.3) | 1.2 (1.6) | 0.85 |
These levels were based on the distribution of the fall‐risk‐reduction coordination‐effectiveness score (low = 40‐49, moderate = 51‐58, and high = 59‐69), which was the coordinating team's rating of their effectiveness implementing 21 processes (0 = not performed to 4 = very effective) using the gap analysis (Appendix S2) at study end.
Statistical significance calculated using the Kruskal‐Wallis exact test for differences between levels of coordination.
There were three core team frequency scores, which were the sum of the ratings of the frequency of implementing evidence‐based processes at the bedside using a 5‐point scale (0‐never to 4‐always; Appendix S2, p. 5):
universal bedside frequency score (eg, patient/family education),
targeted bedside frequency score (eg, alarms, toileting schedule, use of a gait belt), and
universal organizational frequency score (eg, communicate fall‐risk status when patients are handed off across shifts).
There was one measure to assess the extent of process implementation by the contingency team, which was the postfall huddle rate (the proportion of reported falls for which a postfall huddle was conducted throughout the study). We used the study fall‐event database to calculate this rate for each hospital.
2.5. Statistical analysis
We used SAS/STAT software, version 9.4 (SAS Institute Inc.), to conduct all analyses. To compare hospital characteristics and fall rates from baseline to end‐of‐study, we categorized the 16 hospitals into three coordination‐effectiveness levels based on the distribution of the coordination‐effectiveness score (low, moderate, and high), which ranged from 40 to 69. Consistent with best practices in evaluating CSIs, this categorization was intended to reveal variations in implementation and outcomes by extent of implementation. We used the Kruskal‐Wallis exact test to determine differences in the medians of the coordination‐effectiveness scores for the 21 coordinating team processes among these three levels. We used Spearman correlations with exact P values to determine associations between the three component team process measure scores and the five fall‐related outcomes. Consistent with establishing a “causal chain,”56 we used Poisson rate models and nonparametric regression (due to our small sample size) to establish the direction of change. Specifically, we sought to model changes in the total, injurious, and unassisted fall rates due to a 1‐unit increase in a component team process measure score—except for coordination‐effectiveness, for which changes were calculated due to a 5‐unit increase (reflecting the maximum possible score of 84). An offset variable was included in the Poisson rate models, which accounted for total patient days by entering the natural log of this variable. We used nonparametric regression to model changes in the repeat fall rate and the reporting‐fall‐events score due to the same incremental changes in component team process measures. We considered P values <0.05 to be statistically significant and P values <0.10 to be practically significant, given our sample size of 16 hospitals and the value of recognizing potentially promising evidence.57, 60
3. RESULTS
3.1. Contextual factors and outcomes by coordination‐effectiveness Levels
There were no differences among the three coordination‐effectiveness levels in hospital contextual factors or total and unassisted fall rates at baseline (Table 1). However, baseline injurious fall rates were significantly higher among hospitals in the low coordination‐effectiveness level (2.4) as compared to hospitals in the moderate (1.0) and high levels (1.8). During the study, hospitals participated in about two‐thirds of the 31 educational and feedback activities, and 67 percent of all falls were followed by a postfall huddle. The five hospitals in the high coordination‐effectiveness level participated in more study activities and conducted postfall huddles more often than the other 11 hospitals. End‐of‐study average total, injurious, and unassisted fall rates did not differ significantly from baseline rates among the 16 hospitals. However, the end‐of‐study unassisted fall rates were significantly lower among hospitals in the high coordination‐effectiveness level (2.4) as compared to hospitals in the moderate (3.6) and low (5.1) levels.
3.2. Extent of implementation of fall‐risk‐reduction coordination
The 16 coordinating teams rated eight of the 21 coordinating team processes as at least somewhat effective (Table 2). These eight processes were intended to standardize the fall‐risk‐reduction program (eg, educate staff to report all falls). Hospitals varied in how they rated their effectiveness for nine of the 21 coordinating team processes. These nine processes standardized (eg, conduct audits) and adjusted fall‐risk‐reduction processes (eg, modify fall‐risk‐reduction polices/procedures based on data) and provided feedback (eg, inform the front line about actions taken). Finally, four of the 21 coordinating team processes were rated as less than effective by all hospitals. These four processes included providing feedback to front‐line staff and the board and conducting root cause analyses (RCAs) for learning and adjustment.
3.3. Associations between component team process measures and outcomes
Of the three core team process measures, only the universal bedside frequency score was significantly associated with an outcome measure (repeat fall rates). All of the coordinating team process measures were significantly or practically associated with one or more of the five outcome measures. The contingency team process (the postfall huddle rate) was practically associated with repeat fall rates (Table 3).
Table 3.
Spearman correlation coefficients for associations between multiteam system component team process measures and five fall‐related outcomes among 16 hospitals
| Multiteam system component team process measures at study end | Fall‐related outcomes at study end | ||||
|---|---|---|---|---|---|
| Total fall rate | Injurious fall rate | Unassisted fall rate | Repeat fall rate | Reporting‐fall‐events score | |
| Core team process measures | |||||
| Targeted bedside frequency score | −0.205 | −0.309 | −0.344 | −0.414 | 0.049 |
| Universal bedside frequency score | 0.167 | −0.039 | −0.064 | −0.541† | 0.173 |
| Universal organizational frequency score | −0.275 | −0.224 | −0.397 | −0.251 | −0.094 |
| Coordinating team process measures | |||||
| Fall‐risk‐reduction coordination‐effectiveness score | −0.443* | −0.383 | −0.586† | −0.129 | 0.004 |
| Training: fall‐risk‐reduction program score | −0.253 | −0.441* | −0.418 | −0.235 | 0.648‡ |
| Training: fall‐risk assessment tool score | −0.198 | −0.521† | −0.384 | −0.075 | 0.125 |
| Training: safe transfers and mobility score | −0.003 | −0.277 | −0.200 | −0.414 | 0.602† |
| Training: mechanical lifts score | 0.350 | 0.176 | 0.214 | −0.590† | 0.344 |
| Training: postfall huddle score | 0.317 | −0.174 | −0.009 | −0.586† | 0.330 |
| Contingency team process measure | |||||
| Postfall huddle rate | 0.097 | −0.392 | −0.109 | −0.465* | 0.391 |
All process measure scores and the reporting‐fall‐events score were calculated based on the coordinating team's rating of their frequency or effectiveness using the gap analysis (Appendix S2) at study end. Total, injurious, and unassisted fall rates were measured during the end‐of‐study period January‐July 2014. The repeat fall rate was measured for the duration of the study August 2012‐July 2014. Statistical significance was calculated using Spearman exact test for correlations.
*P < 0.10; † P < 0.05; ‡ P < 0.01.
3.4. Extent of process implementation predicts outcomes
Poisson rate models demonstrated that incremental changes in core team process measures did not predict changes in total, injurious, or unassisted fall rates (Table 4). However, the more frequently core teams implemented universal bedside interventions (eg, purposeful hourly rounding), the lower were repeat fall rates. Specifically, nonparametric regression predicted that for every 1‐unit increase in the universal bedside frequency score, there was a practically significant 0.01 decrease in repeat fall rates.
Table 4.
Modeling change in five fall‐related outcomes among 16 hospitals by multiteam system component team process measures
| Multiteam system component team process measures at study end | Outcome multipliers (95% CI)* | Slopes† | |||
|---|---|---|---|---|---|
| Total fall rate (95% CI) | Injurious fall rate (95% CI) | Unassisted fall rate (95% CI) | Repeat fall rate | Reporting‐fall‐events score | |
| Core team process measures | |||||
| Targeted bedside frequency score | 0.98 (0.95‐1.02) | 0.98 (0.93‐1.03) | 0.98 (0.94‐1.01) | 0.00 | 0.00 |
| Universal bedside frequency score | 0.99 (0.95‐1.03) | 0.97 (0.90‐1.04) | 0.98 (0.93‐1.03) | −0.01‡ | 0.07 |
| Universal organizational frequency score | 0.97 (0.92‐1.02) | 0.94 (0.87‐1.02) | 0.96 (0.90‐1.01) | −0.01 | 0.00 |
| Coordinating team process measures | |||||
| Fall‐risk‐reduction coordination‐effectiveness score | 0.89 (0.79‐1.00)‡ | 0.82 (0.68‐1.00)‡ | 0.86 (0.75‐0.99)§ | 0.00 | 0.00 |
| Training: fall‐risk‐reduction program score | 0.94 (0.83‐1.06) | 0.80 (0.65‐0.98)§ | 0.90 (0.78‐1.03) | −0.02 | 0.60§ |
| Training: fall‐risk‐assessment tool score | 0.98 (0.91‐1.06) | 0.87 (0.75‐1.01)‡ | 0.97 (0.89‐1.07) | 0.00 | 0.00 |
| Training: safe transfers and mobility score | 0.98 (0.94‐1.03) | 0.95 (0.89‐1.02) | 0.98 (0.93‐1.02) | −0.01‡ | 0.17§ |
| Training: mechanical lifts score | 1.01 (0.97‐1.06) | 0.98 (0.90‐1.06) | 1.00 (0.95‐1.05) | −0.02‡ | 0.09 |
| Training: postfall huddle score | 1.02 (0.95‐1.09) | 0.93 (0.83‐1.05) | 0.99 (0.92‐1.08) | −0.02‡ | 0.17 |
| Contingency team process measure | |||||
| Postfall huddle rate | 1.03 (0.92‐1.17) | 0.93 (0.77‐1.11) | 1.01 (0.88‐1.15) | −0.53‡ | 3.21 |
All process measure scores and the reporting‐fall‐events score were calculated based on the coordinating team's rating of their frequency or effectiveness using the gap analysis (Appendix S2) at study end. Total, injurious, and unassisted fall rates were measured during the end‐of‐study period January‐July 2014. The repeat fall rate was measured for the duration of the study August 2012‐July 2014.
Outcome multipliers and slopes were calculated for every 5‐unit increase in the fall‐risk‐reduction program coordination score; outcome multipliers and slopes for all other process scores were calculated for every 1‐unit increase in that score.
Statistical significance was calculated using: *a Poisson rate model for the outcome multipliers for the total, injurious, and unassisted fall rates; †nonparametric regression method for the repeat fall rate and the reporting‐fall‐events score (Appendix S2, p. 6); ‡ P < 0.10; § P < 0.05.
Poisson rate models and nonparametric regression demonstrated that incremental changes in coordinating team process measures predicted changes in all five outcome measures within the observed data:
The more effectively coordinating teams planned, standardized, and adjusted (ie, coordinated) the fall‐risk‐reduction program, the lower were total, injurious, and unassisted fall rates. Specifically, for every 5‐unit increase in the coordination‐effectiveness score, there was a significant 0.86 decrease in unassisted fall rates and practically significant 0.82 and 0.89 decreases in injurious and total fall rates, respectively.
The more effectively coordinating teams trained core teams about the fall‐risk‐reduction program, the lower were injurious fall rates, and the better were perceptions that all falls were reported. Specifically, for every 1‐unit increase in the fall‐risk‐reduction program training score, there was a significant 0.80 decrease in the injurious fall rate and a significant 0.60 increase in the reporting‐fall‐events score.
The more effectively coordinating teams trained core team nurses to use the fall‐risk‐assessment tool, the lower were injurious fall rates. Specifically, for every 1‐unit increase in the fall‐risk‐assessment tool training score, there was a practically significant 0.87 decrease in the injurious fall rate.
The more effectively coordinating teams trained core teams in safe transfers/mobility, the lower were repeat fall rates, and the better were perceptions that all falls were reported. Specifically, for every 1‐unit increase in the safe transfers/mobility training score there was a practically significant 0.01 decrease in the repeat fall rate and a significant 0.17 increase in the reporting‐fall‐events score.
The more effectively coordinating teams trained core team members to use mechanical lifts and conduct postfall huddles, the lower were repeat fall rates. Specifically, for every 1‐unit increase in these two training scores, there were practically significant 0.02 decreases in the repeat fall rate.
Finally, the more often a fall was followed by a postfall huddle (the contingency team process measure), the lower were repeat fall rates. Specifically, for every 1‐unit increase in the postfall huddle rate, there was a practically significant 0.53 decrease in the repeat fall rate.
4. DISCUSSION
Much of the previous fall‐risk‐reduction research has focused on innovation in one element of Donabedian's19 framework: structure, process, or incentivizing outcomes. We sought to evaluate the impact of fall‐risk‐reduction processes on five fall‐related outcomes when those processes are implemented and coordinated by an MTS structure. This approach was intended to decrease the risk of falls in a collaborative of 16 small rural hospitals and address the lack of knowledge regarding the impact of an MTS structure as a system intervention to decrease fall risk. We found that the effectiveness of the coordinating team's efforts to manage core and contingency team performance by coordinating (planning, standardizing, and adjusting) processes and conducting training predicted the five outcomes. If we had limited our evaluation to a baseline vs end‐of‐study comparison of aggregate fall rates (Table 1, column two), we would have wrongly concluded that the MTS structure and coordination processes had no impact on fall‐related outcomes. This study may be the first to report an association between MTS structures and processes and patient level outcomes.
These results have implications for fall‐risk‐reduction quality improvement and research. First, coordinating team processes predicted total, injurious, and unassisted fall rates, which are the primary fall‐related outcomes reported in the literature.61 This finding is consistent with a laboratory simulation, which demonstrated that MTS performance was explained by the extent of inter‐team coordination conducted by the leadership (eg, coordinating) team.39 In addition, this finding supports the use of a gap analysis to identify deficits in fall‐risk‐reduction coordination and training and the development of a coordinating team to mitigate these gaps. This finding also supports conducting annual training for staff about the purpose, interventions, and outcomes of the fall‐risk‐reduction program and the administration of the fall‐risk assessment tool since these training efforts predicted injurious fall rates. Finally, this finding is consistent with continual training and a focus on learning from events as work practices that support high reliability.62
Second, our results indicate that decreasing the risk of repeat falls may require coordinated processes conducted by coordinating, core, and contingency teams and monitoring to ensure each fall is followed by a postfall huddle. This second finding supports the implementation of an explicit program to train staff to effectively lead and participate in postfall huddles.
Third, our results indicate that training about the fall‐risk‐reduction program and training in safe transfers/mobility may increase the likelihood that staff will report all falls, including assisted falls. These training efforts may increase staff knowledge about the scope of the fall‐risk‐reduction program and their skill and confidence in mobilizing patients. Consistent with their knowledge of the physiological and biomechanical foundations of mobility, physical and/or occupational therapists can conduct training in safe transfers/mobility and function as integral members of fall‐risk‐reduction coordinating teams.
Fourth, we believe our results support the use of the MTS structure as a system intervention consistent with organizing for high reliability.62 High reliability theory indicates that organizations can operate in complex, hazardous environments for long periods without catastrophic errors if they are preoccupied with failure, reluctant to simplify, sensitive to operations, and committed to resilience.63 For example, the MTS structure supports preoccupation with failure and reluctance to simplify when coordinating team members conduct audits and provide feedback regarding interventions, core team members report adverse events, and contingency team members conduct postevent huddles. Similarly, coordinating and contingency teams support a reluctance to simplify when they include members from multiple disciplines and varying authority gradients who are knowledgeable about front‐line operations. The MTS structure as described in this study may provide health care organizations with the capacity to learn from experience and adapt to changing circumstances, which are defining properties of high reliability organizations.64
Lastly, we agree with Staggs and colleagues50 that the total fall rate should not be the primary outcome of interest in fall‐risk‐reduction quality improvement and research because it includes both system failures (unassisted falls) and system successes (assisted falls). Rather, unassisted, injurious, and repeat fall rates may be the most appropriate fall‐risk‐reduction outcomes of interest.
Our methods are consistent with best practices to evaluate CSIs.56 We assessed the extent of intervention implementation using a gap analysis, and we established a “causal chain”56 by demonstrating that changes in process measures can predict changes in outcome measures using Poisson rate models and nonparametric regression. These methods are consistent with Berwick's57 recommendation to use a wider range of evaluation methodologies than the randomized controlled trial to evaluate multicomponent social interventions in health care. Our results are consistent with our prospective use of impact and process theories to plan and evaluate the study. Because MTSs are optimal for solving complex sociotechnical problems,65 the MTS structure appeared to improve organizational capacity to implement and coordinate fall‐risk‐reduction processes, which predicted fall‐related outcomes. We found that coordinating team rather than core team (ie, bedside) process measures predicted total, unassisted, and injurious fall rates. This finding is consistent with “systems thinking,” which emphasizes that interactions between system elements (ie, coordination of core and contingency team processes by the coordinating team) are more important than individual elements in determining system performance.66 Consistent with Rogers’59 five‐stage organization innovation process theory, we found that hospitals varied in their ability to implement the coordination processes. As compared to the other 11 teams, the five most effective coordinating teams more fully implemented the intervention: They participated in the most study activities; more frequently conducted postfall huddles; and rated themselves as effective in implementing challenging restructuring and routinizing processes. The latter include integrating evidence from multiple disciplines, linking targeted interventions to fall‐risk factors, conducting audits, collecting and analyzing program outcomes data, modifying polices/procedures based on outcomes, and communicating with front‐line staff and senior leaders about the program.
4.1. Limitations and future research
This study has limitations. First, our one‐group pretest‐posttest design cannot establish causality, and it contains threats to internal validity including history, maturation, and regression to the mean.67 We sought to limit the impact of these threats by using evaluation methods appropriate for CSIs. Second, consistent with real‐world quality improvement and the demonstration nature of the study, process and outcome measures were voluntarily reported by study hospitals. Third, we made multiple comparisons among these measures. We did not use the conservative Bonferroni method to adjust for these comparisons due to the exploratory nature of this demonstration study.68, 69 The Bonferroni method would render nearly all results insignificant; it would obscure results that vary by extent of implementation, are consistent with Donabedian's framework,56 and thus appropriate for future research.69 Fourth, the resource‐intense participatory nature of this study required limiting the sample size to 16 hospitals and may confound our ability to conclude “what works.” Specifically, MTS research in the real world will likely involve modest sample sizes due to difficulty accessing and following these teams over time.70 Finally, given that standard definitions of a fall and fall‐related injury were used by just three hospitals at baseline, falls occurring during this period may have been under‐reported, which is consistent with the observed increases in fall rates from baseline to the end‐of‐study period among hospitals in the low and moderate coordination‐effectiveness levels (Table 1).
Future research is needed to determine the optimal structure and preparation of coordinating teams that lead patient safety MTSs. It is likely that the structure and development of these teams affects their performance.71 In fact, we found that a coordinating team's reflexivity—their ability to reflect upon their goals and adapt their strategies to changing circumstances72was negatively associated with total and unassisted fall rates.73 Second, we need to understand the barriers to implementing the restructuring and routinizing processes that teams found challenging (eg, integrating evidence from multiple disciplines, auditing interventions, analyzing data, conducting RCAs). Finally, we need to know how to adapt this CSI to fit the context of larger hospitals and if use of the online toolkit55 can achieve similar outcomes without extensive support from researchers. We must replicate this study as a quality improvement collaborative in a new sample of hospitals without the extensive support offered in the participatory research framework.
5. CONCLUSIONS
Multiteam systems that effectively coordinate processes across diverse professionals and teams may improve the capacity of hospitals to manage the complexity of the patient, environmental, and system factors that result in falls. Implementing an MTS structure is a CSI that may be difficult for hospitals with limited resources to implement without external support (eg, expertise in participatory research or implementation science). However, many patient safety problems are too complex for individuals or individual teams to solve, thus justifying the effort required to implement MTSs. Risks may be mitigated and lives saved if we allocate resources to understanding the social component of patient safety problems and their solutions.65 To do so, we should train health professions students and practitioners to function effectively in teams and MTSs as a means to organize for safety62 and avoid a reductionistic focus on a single structure, process, or outcome when addressing patient safety problems.
DISCLOSURES
None.
DISCLAIMERS
None.
Supporting information
ACKNOWLEDGMENTS
Joint Acknowledgment/Disclosure Statement: We acknowledge the contribution of Sallie J. Weaver, PhD for technical support in interpreting findings in the context of multiteam system coordination, the contribution of Mary Wood for administrative support in collecting data, and the contribution of Frances Higgins for technical support in developing the online toolkit. This study was supported by grant numbers R18 HS021429 and R03 HS024630 from the Agency for Healthcare Research and Quality. The content is solely the responsibility of the authors and does not necessarily represent the official views of the Agency for Healthcare Research and Quality. This study was also supported by grant number 20871‐Y3 from the Nebraska Department of Health and Human Services. Earlier, partial versions of this analysis were presented at the: 2017 AcademyHealth Annual Research Meeting, 2016 APTA NEXT Conference and Exposition, 2016 Science of Team Science Conference, 2015 AHRQ Research Conference, 2015 International Improvement Science and Research Symposium, 2015 American College of Medical Quality Meeting, and 2015 Rural Health Care Leadership Conference.
Jones KJ, Skinner A, Venema D, et al. Evaluating the use of multiteam systems to manage the complexity of inpatient falls in rural hospitals. Health Serv Res. 2019;54:994‐1006. 10.1111/1475-6773.13186
REFERENCES
- 1. Oliver D, Healey F, Haines TP. Preventing falls and fall‐related injuries in hospitals. Clin Geriatr Med. 2010;26(4):645‐692. [DOI] [PubMed] [Google Scholar]
- 2. Weiss AJ, Elixhauser A, eds. Overview of Hospital Stays in the United States, 2012. Rockville, MD: Agency for Healthcare Research and Quality; October 2014 HCUP Statistical Brief; No. 180. http://www.hcup-us.ahrq.gov/reports/statbriefs/sb180-Hospitalizations-United-States-2012.pdf [PubMed] [Google Scholar]
- 3. Bouldin EL, Andresen EM, Dunton NE, et al. Falls among adult patients hospitalized in the United States: prevalence and trends. J Patient Saf. 2013;9(1):13‐17. [DOI] [PMC free article] [PubMed] [Google Scholar]
- 4. Agency for Healthcare Research and Quality . 2013 annual hospital‐acquired condition rate and estimates of cost savings and deaths averted from 2010 to 2013. AHRQ Publication No. 16‐0006‐EF. Rockville, MD: Agency for Healthcare Research and Quality; 2015. http://www.ahrq.gov/professionals/quality-patient-safety/pfp/index.html. Accessed April 5, 2018.
- 5. Deshpande N, Metter EJ, Lauretani F, Bandinelli S, Guralnik J, Ferrucci L. Activity restriction induced by fear of falling and objective and subjective measures of physical function: a prospective cohort study. J Am Geriatr Soc. 2008;56(4):615‐620. [DOI] [PMC free article] [PubMed] [Google Scholar]
- 6. Centers for Medicare and Medicaid Services . Hospital‐acquired conditions. CMS.gov Web site. https://www.cms.gov/Medicare/Medicare-Fee-for-Service-Payment/HospitalAcqCond/Hospital-Acquired_Conditions.html. Updated 2015. Accessed September 28, 2017.
- 7. Agency for Healthcare Research and Quality . AHRQ national scorecard on rates of hospital‐acquired conditions. U.S. Department of Health & Human Services, Agency for Healthcare Research and Quality Web site. https://www.ahrq.gov/professionals/quality-patient-safety/pfp/index.html. Published December 2016. Updated 2016. Accessed April 14, 2018.
- 8. Barker AL, Morello RT, Wolfe R, et al. 6‐PACK programme to decrease fall injuries in acute hospitals: cluster randomised controlled trial. BMJ. 2016;352:h6781. [DOI] [PMC free article] [PubMed] [Google Scholar]
- 9. Healey F. Preventing falls in hospitals. BMJ. 2016;532:i251. [DOI] [PubMed] [Google Scholar]
- 10. American Geriatrics Society, British Geriatrics Society, American Academy of Orthopaedic Surgeons Panel on Falls Prevention. Guideline for the prevention of falls in older persons. American Geriatrics Society, British Geriatrics Society, American Academy of Orthopaedic Surgeons Panel on Falls Prevention . Guideline for the prevention of falls in older persons. American Geriatrics Society, British Geriatrics Society, and American Academy of Orthopaedic Surgeons Panel on Falls Prevention. J Am Geriatr Soc. 2001;49(5):664‐672. [PubMed] [Google Scholar]
- 11. Evans D, Hodgkinson B, Lambert L, Wood J. Fall risk factors in the hospital setting: a systematic review. IJNP. 2001;7:38‐45. [DOI] [PubMed] [Google Scholar]
- 12. Oliver D, Daly F, Martin FC, McMurdo ME. Risk factors and risk assessment tools for falls in hospital in‐patients: a systematic review. Age Ageing. 2004;33(2):122‐130. [DOI] [PubMed] [Google Scholar]
- 13. Tzeng HM, Yin CY. The extrinsic risk factors for inpatient falls in hospital patient rooms. J Nurs Care Qual. 2008;23(3):233‐241. [DOI] [PubMed] [Google Scholar]
- 14. Miake‐Lye IM, Hempel S, Ganz DA, Shekelle PG. Inpatient fall prevention programs as a patient safety strategy: a systematic review. Ann Intern Med. 2013;158(5 Pt 2):390‐396. [DOI] [PubMed] [Google Scholar]
- 15. Aydin C, Donaldson N, Aronow HU, Fridman M, Brown DS. Improving hospital patient falls: leveraging staffing characteristics and processes of care. J Nurs Adm. 2015;45(5):254‐262. [DOI] [PubMed] [Google Scholar]
- 16. Kalisch BJ, Lee KH. The impact of teamwork on missed nursing care. Nurs Outlook. 2010;58(5):233‐241. [DOI] [PubMed] [Google Scholar]
- 17. Jones KJ, Venema DM, Nailon R, Skinner AM, High R, Kennel V. Shifting the paradigm: an assessment of the quality of fall risk reduction in Nebraska hospitals. J Rural Health. 2015;31(2):135‐145. [DOI] [PubMed] [Google Scholar]
- 18. Brown DS, Donaldson N, Burnes Bolton L, Aydin CE. Nursing‐sensitive benchmarks for hospitals to gauge high‐reliability performance. J Healthc Qual. 2010;32(6):9‐17. [DOI] [PubMed] [Google Scholar]
- 19. Donabedian A. An Introduction to Quality Assurance in Health Care. New York, NY: Oxford University Press; 2003. [Google Scholar]
- 20. Umscheid CA, Brennan PJ. Incentivizing “structures” over “outcomes” to bridge the knowing‐doing gap. JAMA Intern Med. 2015;175(3):354‐355. [DOI] [PubMed] [Google Scholar]
- 21. Sahota O, Drummond A, Kendrick D, et al. REFINE (REducing falls in in‐patieNt elderly) using bed and bedside chair pressure sensors linked to radio‐pagers in acute hospital care: a randomised controlled trial. Age Ageing. 2014;43(2):247‐253. [DOI] [PMC free article] [PubMed] [Google Scholar]
- 22. Shorr RI, Chandler AM, Mion LC, et al. Effects of an intervention to increase bed alarm use to prevent falls in hospitalized patients: a cluster randomized trial. Ann Intern Med. 2012;157(10):692‐699. [DOI] [PMC free article] [PubMed] [Google Scholar]
- 23. Haines TP, Bell RA, Varghese PN. Pragmatic, cluster randomized trial of a policy to introduce low‐low beds to hospital wards for the prevention of falls and fall injuries. J Am Geriatr Soc. 2010;58(3):435‐441. [DOI] [PubMed] [Google Scholar]
- 24. Haines TP, Hill AM, Hill KD, et al. Patient education to prevent falls among older hospital inpatients: a randomized controlled trial. Arch Intern Med. 2011;171(6):516‐524. [DOI] [PubMed] [Google Scholar]
- 25. Hempel S, Newberry S, Wang Z, et al. Hospital fall prevention: a systematic review of implementation, components, adherence, and effectiveness. J Am Geriatr Soc. 2013;61(4):483‐494. [DOI] [PMC free article] [PubMed] [Google Scholar]
- 26. Kohn L, Corrigan J, Donaldson M, eds. To err is Human: Building a Safer Health System. Washington, DC: National Academy Press; 2000. [PubMed] [Google Scholar]
- 27. Gowdy M, Godfrey S. Using tools to assess and prevent inpatient falls. Jt Comm J Qual Saf. 2003;29(7):363‐368. [DOI] [PubMed] [Google Scholar]
- 28. Szumlas S, Groszek J, Kitt S, Payson C, Stack K. Take a second glance: a novel approach to inpatient fall prevention. Jt Comm J Qual Saf. 2004;30(6):295‐302. [DOI] [PubMed] [Google Scholar]
- 29. von Renteln‐Kruse W, Krause T. Incidence of in‐hospital falls in geriatric patients before and after the introduction of an interdisciplinary team‐based fall‐prevention intervention. J Am Geriatr Soc. 2007;55(12):2068‐2074. [DOI] [PubMed] [Google Scholar]
- 30. Barker A, Kamar J, Morton A, Berlowitz D. Bridging the gap between research and practice: review of a targeted hospital inpatient fall prevention programme. Qual Saf Health Care. 2009;18(6):467‐472. [DOI] [PubMed] [Google Scholar]
- 31. Jackson SS. Fall prevention takes ‘constant attention’, comprehensive interventions. Hosp Peer Rev. 2010;35(3):25‐29. [PubMed] [Google Scholar]
- 32. Cameron ID, Gillespie LD, Robertson MC, et al. Interventions for preventing falls in older people in care facilities and hospitals. Cochrane Database Syst Rev. 2012;12:CD005465. [DOI] [PubMed] [Google Scholar]
- 33. Salas E, Dickinson TL, Converse SA. Toward an understanding of team performance and training In: Swezey RW, Salas E, eds. Teams: Their Training and Performance. Norwood, NJ: Ablex; 1992:3‐29. [Google Scholar]
- 34. DeChurch LA, Zaccaro SJ. Perspective: teams won't solve this problem. Hum Factors. 2010;52(2):329‐334. [DOI] [PubMed] [Google Scholar]
- 35. Marks MA, DeChurch LA, Mathieu JE, Panzer FJ, Alonso A. Teamwork in multiteam systems. J Appl Psychol. 2005;90(5):964‐971. [DOI] [PubMed] [Google Scholar]
- 36. DeChurch LA, Mathieu JE. Thinking in terms of multiteam systems In: Salas E, Goodwin GF, Burke CS, eds. Team Effectiveness in Complex Organizations: Cross‐Disciplinary Perspectives and Approaches. New York: Taylor & Francis Group; 2009:267‐292. [Google Scholar]
- 37. Okhuysen GA, Bechky BA. Coordination in organizations: an integrative perspective. The Academy of Management Annals. 2009;3(1):463‐502. [Google Scholar]
- 38. Agency for Healthcare Research and Quality . TeamSTEPPS fundamentals course: Module 2. evidence‐base: Team structure. https://www.ahrq.gov/teamstepps/instructor/fundamentals/module2/ebteamstruct.html. Updated 2014. Accessed April 14, 2018.
- 39. DeChurch LA, Marks MA. Leadership in multiteam systems. J Appl Psychol. 2006;91(2):311‐329. [DOI] [PubMed] [Google Scholar]
- 40. Murase T, Carter DR, DeChurch LA, Marks MA. Mind the gap: the role of leadership in multiteam system collective cognition. The Leadership Quarterly. 2014;25:972‐986. [Google Scholar]
- 41. Bell BS, Kozlowski SWJ. A typology of virtual teams: implications for effective leadership. Group and Organization Management. 2002;27:14‐49. [Google Scholar]
- 42. Ellis S, Mendel R, Nir M. Learning from successful and failed experience: the moderating role of kind of after‐event review. J Appl Psychol. 2006;91(3):669‐680. [DOI] [PubMed] [Google Scholar]
- 43. Ellis S, Davidi I. After‐event reviews: drawing lessons from successful and failed experience. J Appl Psychol. 2005;90(5):857‐871. [DOI] [PubMed] [Google Scholar]
- 44. Patient Safety Advisory Group . Preventing falls and fall‐related injuries in health care facilities. Sentinel Event Alert 2015(55). https://www.jointcommission.org/assets/1/6/SEA_55_Falls_4_26_16.pdf. Accessed March 9, 2017. [PubMed]
- 45. Wallerstein N, Duran B. The conceptual, historical, and practice roots of community based participatory research and related participatory traditions In: Minkler M, Wallerstein N, eds. Community‐Based Participatory Research for Health. San Francisco, CA: Jossey‐Bass; 2003:27‐52. [Google Scholar]
- 46. Nebraska Department of Health and Human Services . State of Nebraska roster of hospitals. Public Health Facilities & Services Rosters Web site. http://dhhs.ne.gov/publichealth/Documents/Hospital%20Roster.pdf. Published March 15, 2018. Updated 2018. Accessed April 14, 2018.
- 47. Helfrich CD, Weiner BJ, McKinney MM, Minasian L. Determinants of implementation effectiveness: adapting a framework for complex innovations. Med Care Res Rev. 2007;64(3):279‐303. [DOI] [PubMed] [Google Scholar]
- 48. Pannick S, Sevdalis N, Athanasiou T. Beyond clinical engagement: a pragmatic model for quality improvement interventions, aligning clinical and managerial priorities. BMJ Qual Saf. 2016;25(9):716‐725. [DOI] [PMC free article] [PubMed] [Google Scholar]
- 49. Agency for Healthcare Research and Quality . Supporting documents ‐ common formats ‐ hospital version 1.2. PSO Privacy Protection Center Web site. https://www.psoppc.org/psoppc_web/publicpages/supportingDocsV1.2. Accessed April 14, 2018.
- 50. Staggs VS, Mion LC, Shorr RI. Assisted and unassisted falls: different events, different outcomes, different implications for quality of hospital care. Jt Comm J Qual Patient Saf. 2014;40(8):358‐364. [DOI] [PMC free article] [PubMed] [Google Scholar]
- 51. Drolet A, DeJuilio P, Harkless S, et al. Move to improve: the feasibility of using an early mobility protocol to increase ambulation in the intensive and intermediate care settings. Phys Ther. 2013;93(2):197‐207. [DOI] [PubMed] [Google Scholar]
- 52. Growdon ME, Shorr RI, Inouye SK. The tension between promoting mobility and preventing falls in the hospital. JAMA Intern Med. 2017;177(6):759‐760. [DOI] [PMC free article] [PubMed] [Google Scholar]
- 53. Fairchild SL, Kuchler O'Shea R, Washington RD. Transfer activities In: Principles and Techniques of Patient Care, 6th edn St. Louis, MO: Elsevier; 2018:169‐210. [Google Scholar]
- 54. Fairchild SL, Kuchler O'Shea R, Washington RD. Assistive devices, patterns, and activities In: Principles and Techniques of Patient Care, 6th edn St. Louis, MO: Elsevier; 2018:211‐260. [Google Scholar]
- 55. Jones KJ, Venema DM, Nailon R, et al. CAPTURE falls: Collaboration and proactive teamwork used to reduce falls. http://www.unmc.edu/patient-safety/capturefalls/. Updated 2018. Accessed April 14, 2018.
- 56. Ovretveit J. Evaluating complex social interventions In: Evaluating Improvement and Implementation for Health. Maidenhead: Open University Press; 2014:158‐175. [Google Scholar]
- 57. Berwick DM. The science of improvement. JAMA. 2008;299(10):1182‐1184. [DOI] [PubMed] [Google Scholar]
- 58. Grol RP, Bosch MC, Hulscher ME, Eccles MP, Wensing M. Planning and studying improvement in patient care: the use of theoretical perspectives. Milbank Q. 2007;85(1):93‐138. [DOI] [PMC free article] [PubMed] [Google Scholar]
- 59. Rogers E. Diffusion of Innovations, 5th edn New York, NY: Free Press; 2003. [Google Scholar]
- 60. Kirk RE. Practical significance: a concept whose time has come. Educ Psychol Measur. 1996;56(5):746‐759. [Google Scholar]
- 61. Staggs VS, Davidson J, Dunton N, Crosser B. Challenges in defining and categorizing falls on diverse unit types: lessons from expansion of the NDNQI falls indicator. J Nurs Care Qual. 2015;30(2):106‐112. [DOI] [PMC free article] [PubMed] [Google Scholar]
- 62. Sutcliffe KM, Paine L, Pronovost PJ. Re‐examining high reliability: actively organising for safety. BMJ Qual Saf. 2017;26(3):248‐251. [DOI] [PubMed] [Google Scholar]
- 63. Weick KESK. Managing the Unexpected: Assuring High Performance in an age of Complexity. San Francisco, CA: Josey‐Bass; 2001. [Google Scholar]
- 64. Reason J. Engineering a safety culture In: Managing the Risks of Organizational Accidents. Aldershot: Ashgate Publishing Limited; 1997:191‐222. [Google Scholar]
- 65. Lacerenza CN, Rico R, Salas E, Shuffler ML. The future of multiteam systems: implications for research and practice In: Shuffler ML, Rico R, Salas E, eds. Pushing the Boundaries: Multiteam Systems in Research and Practice. Bingley: Emerald Group Publishing Limited; 2014:223‐240. [Google Scholar]
- 66. Mingers J, White L. A review of the recent contribution of systems thinking to operational research and management science. Eur J Oper Res. 2010;207:1147‐1161. [Google Scholar]
- 67. Campbell D, Stanley J. Experimental and Quasi‐Experimental Designs for Research. Boston, MA: Houghton Mifflin Company; 1963. [Google Scholar]
- 68. Altman DG. Practical Statistics for Medical Research. London: Chapman & Hall; 1999. [Google Scholar]
- 69. Westfall PH, Tobias RD, Wolfinger RD. Multiple Comparisons and Multiple Tests Using SAS, 2nd edn Cary, NC: SAS Institute, Inc.; 2011. [Google Scholar]
- 70. Burke CS. A look into the challenging world of MTS data collection In: Shuffler ML, Rico R, Salas E, eds. Pushing the Boundaries: Multiteam Systems in Research and Practice. Bingley: Emerald Group Publishing Limited; 2014:17‐32. [Google Scholar]
- 71. Shuffler ML, Rico R, Salas E. Pushing the boundaries of multiteam systems in research and practices: an introduction In: Shuffler ML, Rico R, Salas E, eds. Pushing the Boundaries: Multiteam Systems in Research and Practice. Bingley, UK: Emerald Group Publishing Limited; 2014:3‐16. [Google Scholar]
- 72. West M, Anderson N. Innovation in top management teams. J Appl Psychol. 1996;81(6):680‐693. [Google Scholar]
- 73. Reiter‐Palmon R, Kennel V, Allen J, Jones KJ. Good catch!: Using interdisciplinary teams and team reflexivity to improve patient safety. Group Org Manag. 2018;43:414‐439. [Google Scholar]
- 74. United States Census Bureau . Quick facts. United States Census Bureau Web site. http://www.census.gov/quickfacts/table/AGE135214/31,00. Accessed November 15, 2017.
Associated Data
This section collects any data citations, data availability statements, or supplementary materials included in this article.
Supplementary Materials