Abstract
Small-bowel obstruction (SBO) is a common and important disease, for which machine learning tools have yet to be developed. Image annotation is a critical first step for development of such tools. This study assesses whether image annotation by eye tracking is sufficiently accurate and precise to serve as a first step in the development of machine learning tools for detection of SBO on CT. Seven subjects diagnosed with SBO by CT were included in the study. For each subject, an obstructed segment of bowel was chosen. Three observers annotated the centerline of the segment by manual fiducial placement and by visual fiducial placement using a Tobii 4c eye tracker. Each annotation was repeated three times. The distance between centerlines was calculated after alignment using dynamic time warping (DTW) and statistically compared to clinical thresholds for diagnosis of SBO. Intra-observer DTW distance between manual and visual centerlines was calculated as a measure of accuracy. These distances were 1.1 ± 0.2, 1.3 ± 0.4, and 1.8 ± 0.2 cm for the three observers and were less than 1.5 cm for two of three observers (P < 0.01). Intra- and inter-observer DTW distances between centerlines placed with each method were calculated as measures of precision. These distances were 0.6 ± 0.1 and 0.8 ± 0.2 cm for manual centerlines, 1.1 ± 0.4 and 1.9 ± 0.6 cm for visual centerlines, and were less than 3.0 cm in all cases (P < 0.01). Results suggest that eye tracking–based annotation is sufficiently accurate and precise for small-bowel centerline annotation for use in machine learning–based applications.
Keywords: Eye tracking, Machine learning, Small bowel, Centerline
Introduction
The small bowel is the site of a wide range of acute and chronic diseases that are diagnosed by cross-sectional abdominal imaging. Small-bowel obstruction (SBO) is a common cause of acute abdominal pain and is the etiology identified in up to 20% of surgical admissions for that chief complaint [27, 32]. SBO is often evaluated with CT to help triage patients to management with either decompression with a nasogastric tube or surgical intervention. CT findings have been shown to predict the need for surgery more accurately than either clinical or laboratory parameters [31]. Prompt diagnosis of the cause and severity of SBO is essential, as delays in surgical intervention dramatically increase mortality to as high as 25% if ischemia is present [3, 27]. Many other important diseases also affect the small bowel. Crohn’s disease causes lifelong complications for afflicted patients, and along with ulcerative colitis affects approximately 1.3% of the entire US population [9]. MR enterography is a useful complement to ileocolonoscopy in its management [2, 5, 30].
On cross-sectional imaging, these diseases of the small bowel manifest as changes in its caliber, wall thickness, and enhancement characteristics, as well as changes of the adjacent mesentery. The location of findings along the linear course of the small bowel is important in evaluation as well. For instance, a transition point is the location along the linear course of the bowel at which its caliber narrows, and must be identified to determine the cause of an SBO. Two adjacent transition points suggest closed-loop SBO, a severe variant which can lead to ischemia and require surgical management. In the context of inflammatory bowel disease, correlation with endoscopy is only possible if the linear location of abnormalities is determined.
Automated methods to determine the course and characterize the appearance of the small bowel would thus have wide ranging benefits in cross-sectional abdominal imaging of SBO and other diseases. Such methods have been developed to facilitate analysis of other organ systems [7, 10, 12–14, 17–19, 23, 24, 37, 38, 40]. However, the small bowel is unique relative to the systems in which these methods have been successfully applied. Since it is a hollow viscus rather than a solid organ, its contents can vary due to ingested food, bowel preparation, or disease states. Since it is attached via a flexible mesentery, its course can vary dramatically due to positioning, peristaltic motion, congenital variants, and surgical alteration. Thus, at present, few published methods address these challenges in small bowel [33, 34, 42]. New automated methods that address these unique challenges will be required to facilitate prompt and accurate diagnosis of diseases like SBO.
Fortunately, new technologies may make it possible to address these challenges successfully [6, 38]. Machine learning has advanced rapidly in the last decade. In particular, convolutional neural networks (CNNs) running on powerful graphics processing units (GPUs) have proved superior to traditional methods of image analysis in several contexts [15, 16]. CNNs have been applied to both image classification and segmentation [28]. However, the vast amounts of annotated data required to successfully train CNNs poses a great limitation for their usage, due to the time consuming nature of these annotations.
Eye tracking systems provide a potential solution for more facile image annotation, as has been suggested in the context of annotation for object detection within two-dimensional images [26]. During interpretation of cross-sectional imaging, the radiologist uses a mouse to adjust the position within the volume and to adjust the window and level settings of the display. During image annotation, the analyst uses a mouse to contour regions of interest in the volume, but must concurrently make the same adjustments as during image interpretation. Using the same interface device for both tasks may limit the efficiency with which annotation can be performed. Using a separate interface device such as an eye tracker to record locations of interest on the screen may relieve this limitation, if the information it generates is of acceptable accuracy and precision. Regardless of whether eye trackers improve efficiency, the supplemental information which they provide may be of use in addition to manual annotations. For example, eye trackers have previously been found useful in radiology for research regarding pulmonary nodule assessment [8, 29, 35].
In this study, we investigate the use of eye trackers for annotation of centerlines of segments of obstructed small bowel on CT. We assess the accuracy of visually placed centerlines by comparison to manually placed centerlines using a dynamic time warping (DTW) algorithm. We assess the precision of visually placed centerlines on the basis of intra- and inter-observer variability over repeated annotations. As a benchmark for adequacy, we compare measures of accuracy and precision to clinical thresholds for the radius and diameter of obstructed small bowel respectively.
Materials and Methods
Subject Population
In this HIPAA compliant, IRB-approved study, images from seven subjects, 4 males and 3 females, with small-bowel obstruction diagnosed by CT were retrospectively included. Subjects ranged from 31 to 79 years old (mean 54 years). CT images were acquired using a 64 or 320 slice scanner, with 3.75 mm reconstructed slice thickness and fields of view ranging from 35–40 cm. Only axial CT images were used in the subsequent analysis. Each CT image was also modified to include a square region measuring 10 × 10 pixels with attenuation value of 1000 Hounsfield units (HU) centered 15 pixels from each corner as a reference marker.
Eye Tracking
The Tobii 4C Eye Tracker (Tobii Tech, Sweden) was used for this study, with license for analytical use. Eye trackers were mounted on each observer’s personal laptop and desktop computers, using 15.6-, 24-, and 29-in. screens. Each observer sat with their eyes positioned approximately 2 ft from the monitor. Room lights were left on and were not dimmed during annotation. Calibration of the eye trackers was performed with the standard routine available through the Tobii device driver, using one central point, then three peripheral points, and then another set of three peripheral points.
A custom 3D Slicer module was developed to interface with the eye tracker using the Tobii Research Software Development Kit Python API. The module recorded points on the screen at which the observer was looking while scrolling through a cross-sectional imaging volume. Each gaze point recorded by the module was used to instantiate a fiducial point in 3D Slicer, by transforming the screen coordinates of the gaze point to the coordinate system of the CT scan based on the geometry of the computer window and of the imaging slice. Fiducial locations were exported into a text file for further analysis.
The Tobii 4C eye tracker records gaze points at a rate of 90 Hz; however, the version of the module used in this study was only able to record at a rate of 10 Hz due to limitations related to multi-threading in Python. Subsequent versions of the module have relieved these limitations to enable recording at the full 90 Hz, but were not available at the time of this study.
Although accuracy and precision of angular eyetracking measurements is available through the Tobii eye tracking software and Tobii product literature, recapitulating these measurements was not within the scope of this study, since accuracy and precision in the imaging domain are more relevant to utility in the context of image annotation. The exact size of the CT images on the screen during image annotation was variable, since observers were allowed to magnify the images as needed for optimal visualization, and for that reason was not recorded.
Image Annotation
A single continuous segment of obstructed small bowel in each CT was chosen for analysis based on its subjective prominence by a radiologist with 6 years of experience. Using 3D Slicer and a standard computer mouse, this radiologist manually placed fiducial points to designate the beginning and end of each segment and subsequently placed a series of fiducial points along the approximate centerline of the entire segment. Two other observers studied this centerline, and afterwards, manually placed fiducials points along the centerline of the segment as well. These two observers were not blinded to the expert annotation due to their level of training, since the purpose of this study was to assess variance arising from technique rather than from interpretation (Fig. 1).
Fig. 1.
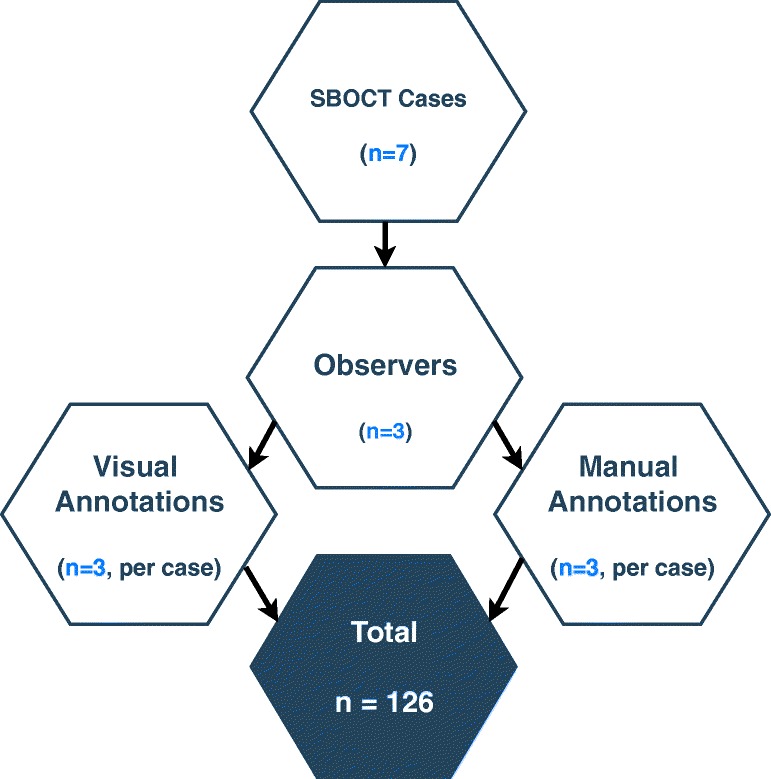
Diagramatic representation of the number of centerline annotations performed
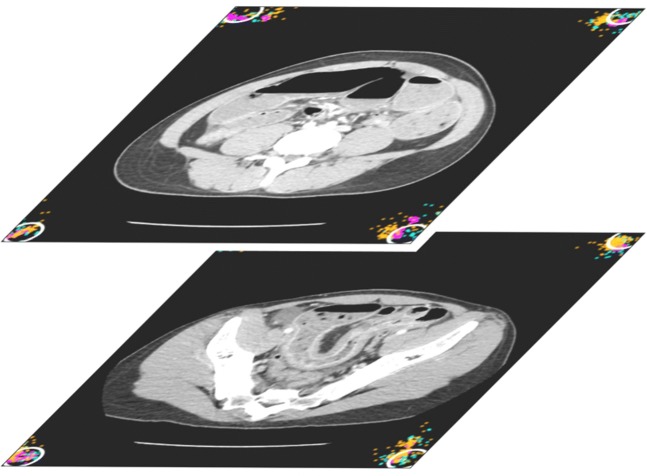
Next, using the custom 3D Slicer module and eye tracker, all three observers were instructed to look at the center of the bowel while scrolling from the beginning to the end of the segment. Fiducial points were placed by the module at locations corresponding to gaze points recorded by the eye tracker during this visual task. In addition, at the beginning and end of the segment, each observer was instructed to look at the reference markers in each of the four corners of the image. Using the same custom 3D Slicer module, gaze points were recorded during this visual task as well and were used to instantiate fiducial points at each of the eight corners of the volume. Each observer repeated manual and visual annotations three times, for a total of 126 annotations across 7 subjects, 3 observers, 2 methods, and 3 repetitions as shown in Fig. 2.
Fig. 2.
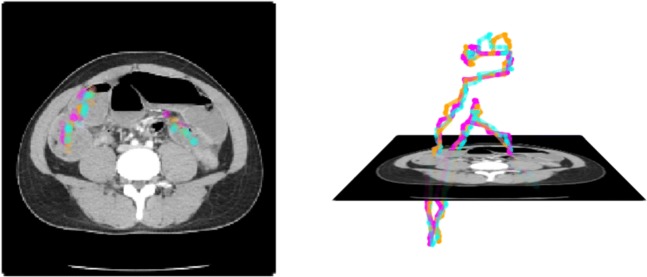
Representative image of visually placed centerline in an obstructed small-bowel segment. Different colors represent different observers
The average lengths of all annotated segments were 82.4 ± 22.4 cm. The average distance between adjacent centerline points was 1.43 ± 0.37 cm for manual annotations, and 0.59 ± 0.18 cm for visual annotations. Finally, the average number of placed centerline points was 42 ± 13 for manual annotations and 199 ± 65 for visual annotations (Fig. 3).
Fig. 3.
Representative image of visually placed corner points in the beginning and end slice. Different colors represent different observers. White circles represent a 1.5 cm boundary around the center of the marker
Dynamic Time Warping
Dynamic time warping (DTW) is an algorithm for aligning two sequences with unequal numbers of ordered elements [1, 36], for instance, two trajectories containing different numbers of points along a small-bowel centerline as in this application. Since there are a large number of potential pairings between all points of each trajectory, DTW applies two constraints to determine the alignment [20]. First, the order of points in each pairing is non-decreasing, in keeping with the notion that two trajectories are time series, and that progress along one should reflect progress along another. Second, the total cost of all pairings is minimized. In this application, the cost of each individual pairing is defined to be the Euclidean distance between pairs of points. Minimizing the total cost ensures that the pairings represent the closest possible pairings of points subject to the first constraint. The average cost over all pairs of points can then be interpreted as the distance between trajectories.
The details of our implementation of the DTW algorithm are as follows. In an analogous formulation to Berndt et. al. [4], we define two three-dimensional trajectories S and T with m and n points, as shown in Eq. 1.
| 1 |
The cost is defined as the three-dimensional Euclidean distances between points, as in Eq. 2.
| 2 |
The DTW algorithm constructs a m × n matrix DTW through dynamic programming as shown in Algorithm 1. A step between an element of the matrix and an adjacent prior element represents a pairing of points on each trajectory. For each element, steps from three prior adjacent elements must be considered. Of these three possibilities, the step with the minimum sum of the cost of the prior element and cost of the step from that prior element is chosen. This minimum summed cost is recorded as DTW[i,j], and the step is recorded as part of a path through the matrix to that element. Thus, each element DTW[i,j] represents the minimal total cost of the pairings of subsets of each trajectory S1...i and T1...j. After the entire matrix is constructed, the value of DTW[m,n] represents the minimum total cost of pairings between the entire trajectories S and T, and the path through the matrix represents the pairings themselves.
Using this algorithm, DTW distances between pairs of centerlines were calculated for each subject as shown in Fig. 4. Average DTW distances were used as a metric of similarity between manually and visually annotated centerlines for assessment of accuracy, and between repetitions of annotations for assessment of precision.
Fig. 4.
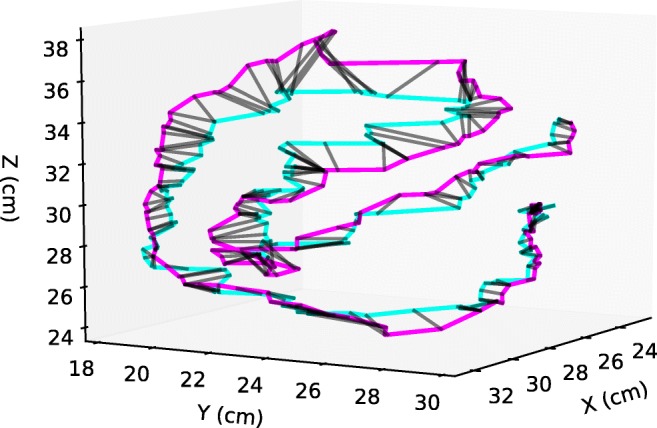
Example of a DTW alignment between two visual annotations of a small bowel segment done by separate observers. The black lines match the corresponding points in each trajectory according to the DTW algorithm
Centerline and Corner Point Filtering
Since small-bowel centerlines and corner points were recorded in the same visual annotation session, they were first filtered to allow for separate analysis. Points were considered corner points if they met two criteria. First, they were in the same axial slice as the designated beginning or end of the bowel segment, but were closer to the reference markers within that slice. This criteria corresponds to the instructions given to observers during visual annotation. Second, they were within 3.3 cm of the reference markers. This criteria excludes a small number of stray points were felt to represent unintentionally recorded saccades between corners. The percentage of such points removed from the analysis across all cases and observers was 2.3 ± 3.1%, with a maximum of 6.7%. The distribution of distances between filtered corner points and reference markers is shown in Fig. 7. Since this distribution does not show any abrupt cut-off, we felt these criteria captured most gazes that were intended to be directed towards the reference markers. The remainder of the points were considered small-bowel centerline points.
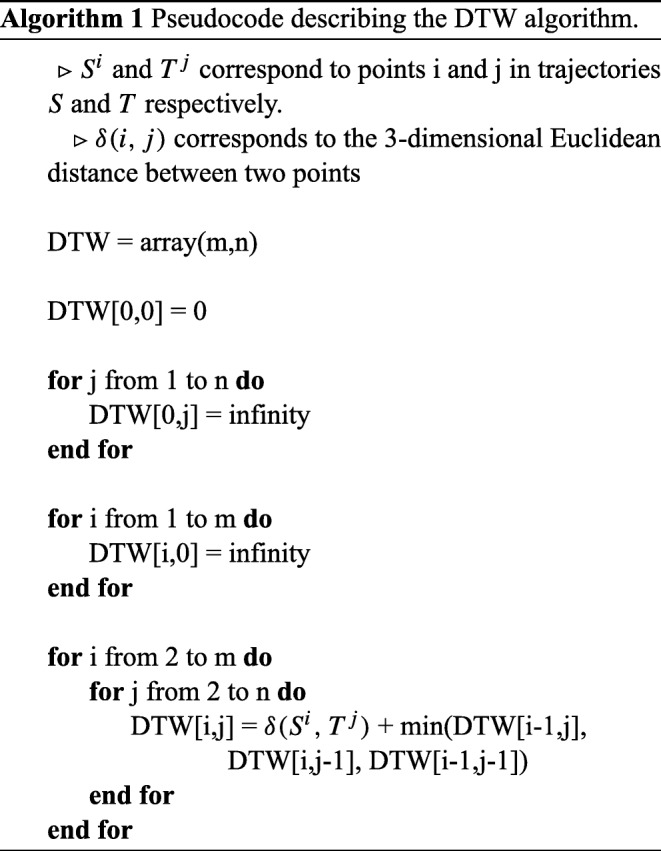
Fig. 7.
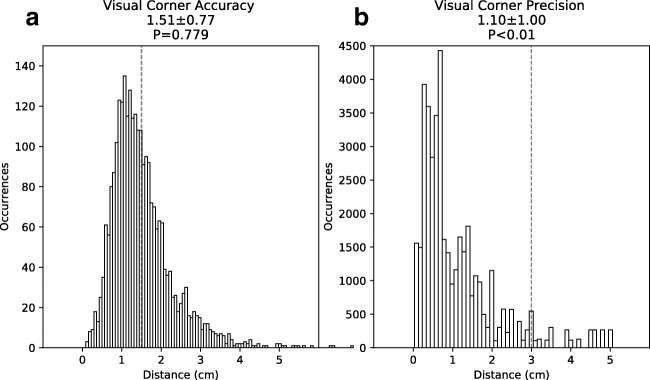
Histogram representation of the accuracy and precision analysis of the visually annotated corner points. Panel a represents the distribution of the radial distances between visually annotated corner points and the corner markers. Dashed red line represents 1.5 cm. Panel b represents the distribution of distances between visually annotated corner markers in the first and last CT slice of the small-bowel segments. Dashed line represents 3.0 cm
Centerline Analysis
To assess the accuracy of the visual annotations, the average DTW distance was computed between visual and manual annotations for all repetitions for a given subject. This generated a total of 9 distances per subject for each observer, and a total of 189 distances across all subjects and observers.
To assess the precision of both manual and visual annotations, intra- and inter-observer variability was assessed. For intra-observer variability, the average DTW distance was calculated between repetitions performed for a given subject by a single observer. This was done separately for annotations from manual and visual annotations. This generated 3 distances per subject for each observer, and a total of 63 distances per method across all subjects and observers. For inter-observer variability, the average DTW distance was calculated between repetitions performed by all observers for a given subject. This generated 18 distances per subject, and a total of 126 distances per method over all subjects.
Corner Point Analysis
Corner points were placed to evaluate visual annotations in the context of a fixed rather than an interpreted structure. To assess accuracy, the two-dimensional Euclidean distance between each corner point and its corresponding reference marker was calculated for all subjects and observers. To assess precision, the two-dimensional distance between each corner point in the beginning slice and the projection of the corresponding corner point from the end slice was calculated for all subjects and observers.
Statistical Analysis
To determine whether visual annotation would be sufficient in the clinical context of small-bowel obstruction, DTW distances were compared to one of two fixed thresholds, 1.5 cm for accuracy and 3.0 cm for precision. These thresholds were chosen based on the caliber at which small bowel is considered dilated. This caliber varies according to clinical practice, but a threshold of 3-cm diameter is commonly used [11]. Thus, a centerline placed within a 1.5 cm radius of the true centerline would be expected to be intraluminal. Likewise, two centerlines placed within 3.0 cm of each other both would also be expected to be intraluminal.
Each of the sets of DTW distances in the above sections were statistically compared to these fixed thresholds for accuracy or precision using a one-sample one-tailed t test, with the null hypothesis that means were above the fixed thresholds. For centerline accuracy analysis, four t tests were performed, one for each of the three observers, and one for all observers in aggregate. For centerline precision analysis, four t tests were performed, for manual and visual methods, and for intra- and inter-observer comparisons. For corner point analysis, two t tests were performed, one for accuracy and one for precision.
Euclidean distances often follow a chi-squared rather than normal distribution. However, the robustness of the t test allows for deviations from normality to be acceptable as long as the number of samples is sufficiently large. This is the case because it is the mean of the random samples of the population that must be normally distributed, not the population itself. For a large number of samples, the central limit theorem ensures this is the case [41].
Results
Centerline Analysis
To assess accuracy, DTW distances between manual and visual annotations of small-bowel centerlines were calculated and are shown in Fig. 5. For each observer individually, DTW distances were 1.1 ± 0.2 cm, 1.3 ± 0.4 cm, and 1.8 ± 0.2 cm and were less than 1.5 cm for two of three observers (P < 0.01). For all observers in aggregate, DTW distances were 1.40 ± 0.43 cm, which was also less than 1.5 cm (P < 0.01).
Fig. 5.
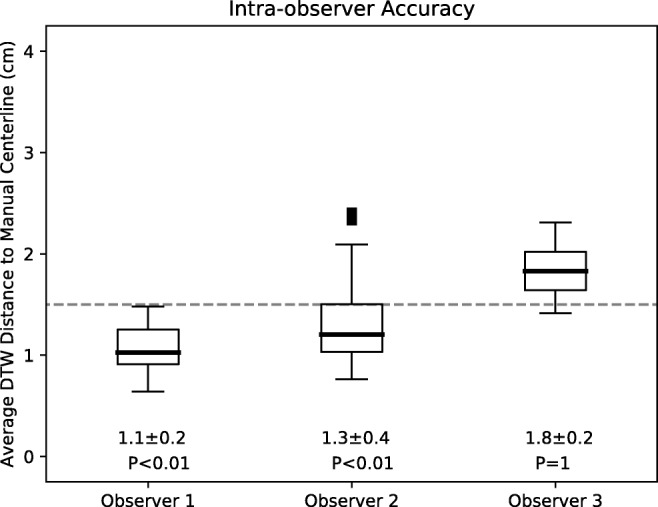
Accuracy as represented by the average DTW distance of the visually annotated centerlines to the manually annotated centerlines. Each boxplot represents all annotations done by a single observer. The dashed line represents the 1.5 cm distance specified as acceptable for accuracy. Mean ± standard deviations as well as P values shown below. P values correspond to statistical difference between data and the 1.5 cm distance
To assess precision, intra- and inter-observer DTW distances among repetitions of manual and visual annotations of small-bowel centerlines were calculated and are shown in Fig. 6. Intra-observer DTW distances for manual and visual annotations were 0.6 ± 0.1 cm and 1.1 ± 0.4 cm, respectively. Inter-observer DTW distances for manual and visual annotations were 0.8 ± 0.2 cm and 1.9 ± 0.9 cm, respectively. All of these distances were significantly lower than 3.0 cm (P < 0.01).
Fig. 6.
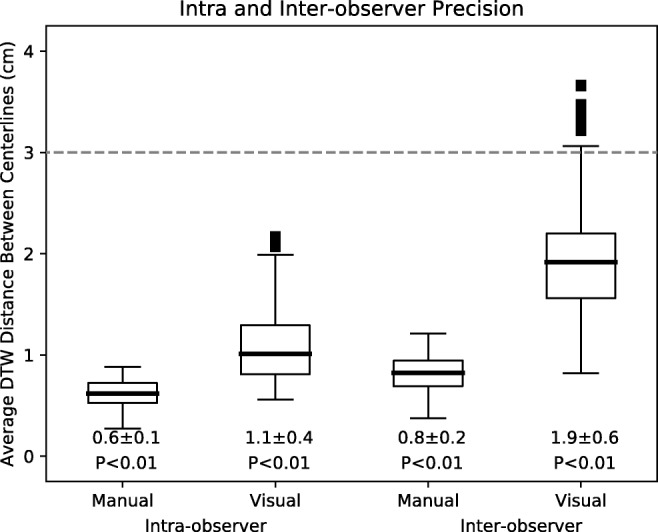
Intra- and inter-observer variability for manual and visual centerline annotations as a metric for precision. Each boxplot represents data from all cases and observers for the two annotation types. The dashed line represents the 3.0 cm distance specified as acceptable for precision. Mean ± standard deviations as well as p-values shown below. P values correspond to statistical difference between data and the 3.0 cm distance
Corner Point Analysis
To assess accuracy, 2D Euclidean distances between visually annotated corner points and reference markers were calculated and are shown in Fig. 7a. These distances were 1.51 ± 0.77 cm. Although the peak of this distribution was below 1.5 cm, its mean was not significantly below 1.5 cm (P > 0.05).
To assess precision, 2D Euclidean distances between corresponding projected corner points from the beginning and end slice were calculated and are shown in Fig. 7b. These distances were 1.10 ± 1.00 cm, which were significantly below 3.0 cm (P < 0.01).
Discussion
Machine learning tools require annotated data for training and validation. Manual annotation of medical images can be a time-consuming process. The inefficiency of manual annotation is partly due to the use of the same device for both annotation and for image adjustments that must be done concurrently with annotation. Eye trackers are an alternative to the standard computer mouse. They provide information about the position on the screen at which a user is looking. Since this information is derived from the user’s eye rather than hand, the mouse can be used for other tasks concurrently. In this study, we developed a custom 3D Slicer module that to facilitate this novel division of labor between eye and hand. The module uses an eye tracker to perform visual annotations, while allowing the mouse to be used for manual image adjustments such as repositioning within the imaging volume. We investigated the performance of this system in the clinical context of small-bowel obstruction, a common and important disease.
The results of this study suggest that visual annotation of the small-bowel centerline is sufficiently accurate and precise relative to clinical thresholds for diagnosis of obstruction. Visually placed centerlines were within 1.5 cm of manually placed centerlines for all observers in aggregate, and for two of three observers individually. Since 1.5 cm is the approximate radius of obstructed bowel, we reason that this level of accuracy is sufficient for both centerlines to be intraluminal. Likewise, visually placed centerlines were well within 3.0 cm of each other when repeated placement was performed. Since the variability of visual placement was greater than that of manual placement, the imprecision likely reflects both the performance of the eye tracker as well as differing interpretations of the location of the centerline. Nonetheless, since 3.0 cm is the approximate diameter of obstructed bowel, we reason that this level of precision is still sufficient for all centerlines to be intraluminal.
We also investigated the performance of visual annotation of reference markers placed at the corners of the imaging volume. We found that visual placement of corner points was precise to well within 3.0 cm, but was not accurate to within the specified threshold of 1.5 cm. Since the position of the reference markers was not a matter of interpretation, the inaccuracy likely reflects inadequate calibration of the eye tracker. Accuracy was noted to vary between reference markers in different corners of the volume (results not shown), which also suggests inadequate calibration. Nonetheless, the high degree of precision suggests that improved calibration and thus improved accuracy, may be possible in the future.
Radial distance between centerlines is the quantity that is most relevant to determining whether both are intraluminal. DTW distance incorporates both axial and radial offsets, since it is a sum of Euclidean distances between points without regard to the orientation of the centerline. For that reason, DTW distance is an upper bound on the radial offset, since any axial offset will also be included in the measurement. Thus, if the average DTW distance is less than the specified thresholds of 1.5 cm and 3 cm, the average radial distance would be expected to satisfy those thresholds as well. We considered using other metrics, based on distances between line segments or continuous representations, rather than distances between points, to better capture radial distance only. However, other representations require parameterization or processing that adds complexity, and at some point require discretization even if only in an integral. For this reason, we selected DTW distance as it was the simplest metric that still provided useful information about radial distance.
This study has several limitations. First, many technical factors varied among observers during visual annotations, including the computer monitor used, the screen size of the 3D Slicer application, and the level of magnification of the displayed CT images. We did not investigate the effects of these factors on accuracy and precision, but expect that they could affect both. Second, we did not investigate the observer-specific performance seen for many measurements, which may arise from the observers’ varying level of training in radiology, but also could potentially arise from their use of eyeglasses, facial features, or other factors. Third, we did not record the time required for either manual or visual annotation. Although we suspect visual annotation may prove more efficient, we did not directly evaluate that claim in this study. Fourth, the exclusion of non-dilated segments limits the applicability of the results to normal caliber bowel and populations without bowel obstruction. Finally, the small size of the dataset included in this study limits the applicability of the results to larger studies, in which additional factors such as observer fatigue may also be sources of error.
We plan to pursue several future directions motivated by the findings of this study. First, to address the inaccuracy observed in the results, other calibration techniques will be investigated. One such technique would be to use a grid of points across the screen rather than just the few that are shown during the off-the-shelf calibration routine. Such a technique may leverage the precision to improve the accuracy of the results. Second, to address the question of whether visual annotation is more efficient than manual annotation, we will develop an improved module to record the time taken for each annotation alongside the annotation itself. Third, we will investigate whether eye trackers can be used to annotate other linear or branching structures in the human body, such as blood vessels or bile ducts [21, 22], or other volumetric structures like organs or lesions [25, 39]. Finally, we will investigate how to incorporate these visual annotations into training data for development of machine learning tools. One such approach would be to label the region around each centerline as belonging to bowel, and use those labels to train machine learning tools to perform segmentation of the bowel. The development of such tools relies on large volumes of training data, the creation of which may be accelerated by visual annotation technique described here.
Conclusion
Small-bowel obstruction is a common and important disease. Development of machine learning tools for detection and characterization of small-bowel obstruction will require a large volume of annotated data. Using a Tobii eye tracker and custom 3D Slicer module, we found that visual annotations of the small-bowel centerline were of sufficient accuracy and precision relative to clinically derived thresholds for obstruction. These promising results suggest that visual annotation may help to generate the large volumes of training data needed for machine learning tools in the context of small-bowel obstruction.
Funding information
Dr. Kang Wang was supported in part by the NIH grant T32EB005970.
Footnotes
Publisher’s Note
Springer Nature remains neutral with regard to jurisdictional claims in published maps and institutional affiliations.
Contributor Information
Alfredo Lucas, Phone: 954-451-6781, Email: allucas@ucsd.edu.
Kang Wang, Phone: 619-543-6641, Email: kaw016@ucsd.edu.
Cynthia Santillan, Phone: 619-543-6641, Email: csantillan@mail.ucsd.edu.
Albert Hsiao, Phone: 619-543-6641, Email: a3hsiao@mail.ucsd.edu.
Claude B. Sirlin, Phone: 619-543-6641, Email: csirlin@ucsd.edu
Paul M. Murphy, Phone: 619-543-6641, Email: pmmurphy@ucsd.edu
References
- 1.Alajlan N. HopDSW: An approximate dynamic space warping algorithm for fast shape matching and retrieval. Journal of King Saud University - Computer and Information Sciences. 2011;23(1):7–14. doi: 10.1016/j.jksuci.2010.01.001. [DOI] [Google Scholar]
- 2.Allen BC, Leyendecker JR. MR enterography for assessment and management of small bowel Crohn disease. Radiol Clin N Am. 2014;52(4):799–810. doi: 10.1016/j.rcl.2014.02.001. [DOI] [PubMed] [Google Scholar]
- 3.Aquina CT, Becerra AZ, Probst CP, Xu Z, Hensley BJ, Iannuzzi JC, Noyes K, Monson JRT, Fleming FJ. Patients with adhesive small bowel obstruction should be primarily managed by a surgical team. Ann Surg. 2016;264(3):437–447. doi: 10.1097/SLA.0000000000001861. [DOI] [PubMed] [Google Scholar]
- 4.Berndt DJ, Clifford J: Using dynamic time warping to find patterns in time series.. In: Proceedings of the 3rd international conference on knowledge discovery and data mining, AAAIWS’94. AAAI Press, Seattle, 1994, pp 359–370. http://dl.acm.org/citation.cfm?id=3000850.3000887
- 5.Bruining DH, Zimmermann EM, Loftus EV, Sandborn WJ, Sauer CG, Strong SA. Society of Abdominal Radiology Crohn’s Disease-Focused Panel: Consensus Recommendations for Evaluation, Interpretation, and Utilization of Computed Tomography and Magnetic Resonance Enterography in Patients With Small Bowel Crohn’s Disease. Radiology. 2018;286(3):776–799. doi: 10.1148/radiol.2018171737. [DOI] [PubMed] [Google Scholar]
- 6.Chartrand G, Cheng PM, Vorontsov E, Drozdzal M, Turcotte S, Pal CJ, Kadoury S, Tang A. Deep learning: A primer for radiologists. RadioGraphics. 2017;37(7):2113–2131. doi: 10.1148/rg.2017170077. [DOI] [PubMed] [Google Scholar]
- 7.Dale AM, Fischl B, Sereno MI. Cortical surface-based analysis. I. Segmentation and surface reconstruction. NeuroImage. 1999;9(2):179–194. doi: 10.1006/nimg.1998.0395. [DOI] [PubMed] [Google Scholar]
- 8.Ebner L, Tall M, Choudhury KR, Ly DL, Roos JE, Napel S, Rubin GD. Variations in the functional visual field for detection of lung nodules on chest computed tomography: Impact of nodule size, distance, and local lung complexity. Med Phys. 2017;44(7):3483–3490. doi: 10.1002/mp.12277. [DOI] [PubMed] [Google Scholar]
- 9.Feuerstein JD, Cheifetz AS. Crohn disease: Epidemiology, diagnosis, and management. Mayo Clin Proc. 2017;92(7):1088–1103. doi: 10.1016/j.mayocp.2017.04.010. [DOI] [PubMed] [Google Scholar]
- 10.Fischl B, Salat DH, Busa E, Albert M, Dieterich M, Haselgrove C, van der Kouwe A, Killiany R, Kennedy D, Klaveness S, Montillo A, Makris N, Rosen B, Dale AM. Whole brain segmentation: automated labeling of neuroanatomical structures in the human brain. Neuron. 2002;33(3):341–355. doi: 10.1016/S0896-6273(02)00569-X. [DOI] [PubMed] [Google Scholar]
- 11.Frager D, Medwid SW, Baer JW, Mollinelli B, Friedman M. CT of small-bowel obstruction: value in establishing the diagnosis and determining the degree and cause. AJR Am J Roentgenol. 1994;162(1):37–41. doi: 10.2214/ajr.162.1.8273686. [DOI] [PubMed] [Google Scholar]
- 12.Frangi AF, Niessen WJ, Vincken KL, Viergever MA: Multiscale vessel enhancement filtering.. In: Medical Image Computing and Computer-Assisted Intervention — MICCAI’98, pp 130–137, 1998
- 13.Frimmel H, Näppi J, Yoshida H. Fast and robust computation of colon centerline in CT colonography. Med Phys. 2004;31(11):3046–3056. doi: 10.1118/1.1790111. [DOI] [PubMed] [Google Scholar]
- 14.Frimmel H, Näppi J, Yoshida H. Centerline-based colon segmentation for CT colonography. Med Phys. 2005;32(8):2665–2672. doi: 10.1118/1.1990288. [DOI] [PubMed] [Google Scholar]
- 15.Krizhevsky A, Sutskever I, Hinton GE (2012) ImageNet classification with deep convolutional neural networks. Advances In Neural Information Processing Systems, 1–9
- 16.Lecun Y, Bottou L, Bengio Y, Haffner P. Gradient-based learning applied to document recognition. Proc IEEE. 1998;86(11):2278–2324. doi: 10.1109/5.726791. [DOI] [Google Scholar]
- 17.Li Q, Sone S, Doi K. Selective enhancement filters for nodules, vessels, and airway walls in two- and three-dimensional CT scans. Med Phys. 2003;30(8):2040–2051. doi: 10.1118/1.1581411. [DOI] [PubMed] [Google Scholar]
- 18.Litjens G, Toth R, van de Ven W, Hoeks C, Kerkstra S, van Ginneken B, Vincent G, Guillard G, Birbeck N, Zhang J, Strand R, Malmberg F, Ou Y, Davatzikos C, Kirschner M, Jung F, Yuan J, Qiu W, Gao Q, Edwards PE, Maan B, van der Heijden F, Ghose S, Mitra J, Dowling J, Barratt D, Huisman H, Madabhushi A. Evaluation of prostate segmentation algorithms for MRI: The PROMISE12 challenge. Med Image Anal. 2014;18(2):359–373. doi: 10.1016/j.media.2013.12.002. [DOI] [PMC free article] [PubMed] [Google Scholar]
- 19.Lu L, Zhang D, Li L, Zhao J. Fully automated colon segmentation for the computation of complete colon centerline in virtual colonoscopy. IEEE Trans Biomed Eng. 2012;59(4):996–1004. doi: 10.1109/TBME.2011.2182051. [DOI] [PubMed] [Google Scholar]
- 20.Magdy N, Sakr MA, Mostafa T, El-Bahnasy K (2015) Review on trajectory similarity measures. In: 2015 IEEE 7th international conference on intelligent computing and information systems (ICICIS), pp 613–619. 10.1109/IntelCIS.2015.7397286
- 21.Maiora J, Ayerdi B, Graña M. Random forest active learning for AAA thrombus segmentation in computed tomography angiography images. Neurocomputing. 2014;126:71–77. doi: 10.1016/j.neucom.2013.01.051. [DOI] [Google Scholar]
- 22.Maiora J, Graña M (2012) Abdominal CTA image analisys through active learning and decision random forests: Aplication to AAA segmentation. In: The 2012 international joint conference on neural networks (IJCNN), pp 1–7. 10.1109/IJCNN.2012.6252801
- 23.Metz CT, Schaap M, Weustink AC, Mollet NR, Van Walsum T, Niessen WJ. Coronary centerline extraction from CT coronary angiography images using a minimum cost path approach. Med Phys. 2009;36(12):5568–5579. doi: 10.1118/1.3254077. [DOI] [PubMed] [Google Scholar]
- 24.Milletari F, Navab N, Ahmadi SA (2016) V-Net: Fully convolutional neural networks for volumetric medical image segmentation, 1–11. arXiv:1606.04797
- 25.Mittal D, Kumar V, Saxena SC, Khandelwal N, Kalra N. Neural network based focal liver lesion diagnosis using ultrasound images. Comput Med Imaging Graph. 2011;35(4):315–323. doi: 10.1016/j.compmedimag.2011.01.007. [DOI] [PubMed] [Google Scholar]
- 26.Papadopoulos DP, Clarke ADF, Keller F, Ferrari V: Training object class detectors from eye tracking data.. In: Computer Vision – ECCV 2014, Lecture Notes in Computer Science. Springer, Cham, 2014, pp 361–376, 10.1007/978-3-319-10602-1_24. https://link.springer.com/chapter/10.1007/978-3-319-10602-1_24
- 27.Paulson EK, Thompson WM. Review of small-bowel obstruction: the diagnosis and when to worry. Radiology. 2015;275(2):332–342. doi: 10.1148/radiol.15131519. [DOI] [PubMed] [Google Scholar]
- 28.Ronneberger O, Fischer P, Brox T (2015) U-Net: Convolutional networks for biomedical image segmentation, 1–8. arXiv:1505.04597
- 29.Rubin GD, Roos JE, Tall M, Harrawood B, Bag S, Ly DL, Seaman DM, Hurwitz LM, Napel S, Roy Choudhury K. Characterizing search, recognition, and decision in the detection of lung nodules on CT scans: Elucidation with eye tracking. Radiology. 2015;274(1):276–286. doi: 10.1148/radiol.14132918. [DOI] [PubMed] [Google Scholar]
- 30.Santillan CS. MR imaging techniques of the bowel. Magn Reson Imaging Clin N Am. 2014;22(1):1–11. doi: 10.1016/j.mric.2013.07.004. [DOI] [PubMed] [Google Scholar]
- 31.Scrima A, Lubner MG, King S, Pankratz J, Kennedy G, Pickhardt PJ. Value of MDCT and clinical and laboratory data for predicting the need for surgical intervention in suspected small-bowel obstruction. AJR Am J Roentgenol. 2017;208(4):785–793. doi: 10.2214/AJR.16.16946. [DOI] [PubMed] [Google Scholar]
- 32.Silva AC, Pimenta M, Guimarães LS. Small bowel obstruction: what to look for Radiographics: A review publication of the radiological. Society of North America, Inc. 2009;29(2):423–439. doi: 10.1148/rg.292085514. [DOI] [PubMed] [Google Scholar]
- 33.Spuhler C (2006) Interactive centerline finding in complex tubular structures (16697)
- 34.Spuhler C, Harders M, Szekely G. Fast and robust extraction of centerlines in 3d tubular structures using a scattered-snakelet approach. SPIE Medical Imaging. 2006;6144:614442–614442–8. [Google Scholar]
- 35.Tall M, Choudhury KR, Napel S, Roos JE, Rubin GD. Accuracy of a remote eye tracker for radiologic observer studies: Effects of calibration and recording environment. Acad Radiol. 2012;19(2):196–202. doi: 10.1016/j.acra.2011.10.011. [DOI] [PubMed] [Google Scholar]
- 36.Vaughan N, Gabrys B. Comparing and combining time series trajectories using dynamic time warping. Proc Comput Sci. 2016;96:465–474. doi: 10.1016/j.procs.2016.08.106. [DOI] [Google Scholar]
- 37.Vincent G, Guillard G, Bowes M (2012) Fully automatic segmentation of the prostate using active appearance models, Medical image computing and computer-assisted intervention – MICCAI 2012. http://promise12.grand-challenge.org/Results/displayFile?resultId=20120629193617_302_Imorphics_Results&;type=Public&;file=Imorphics.pdf
- 38.Wang S, Summers RM. Machine learning and radiology. Med Image Anal. 2012;16(5):933–951. doi: 10.1016/j.media.2012.02.005. [DOI] [PMC free article] [PubMed] [Google Scholar]
- 39.Yasaka K, Akai H, Abe O, Kiryu S. Deep learning with convolutional neural network for differentiation of liver masses at dynamic contrast-enhanced CT: A preliminary study. Radiology. 2017;286(3):887–896. doi: 10.1148/radiol.2017170706. [DOI] [PubMed] [Google Scholar]
- 40.Yu L, Yang X, Chen H, Qin J, Heng PA (2017) Volumetric convnets with mixed residual connections for automated prostate segmentation from 3d mr images, 31st AAAI conference on artificial intelligence, pp 66–72
- 41.Zar JH (2014) Biostatistical analysis, 5. ed., pearson new internat. ed edn. Always learning. Pearson Education Limited, Harlow. OCLC: 862984228
- 42.Zhang W, Liu J, Yao J, Louie A, Nguyen TB, Wank S, Nowinski WL, Summers RM. Mesenteric vasculature-guided small bowel segmentation on 3d CT. IEEE Trans Med Imaging. 2013;32(11):2006–2021. doi: 10.1109/TMI.2013.2271487. [DOI] [PMC free article] [PubMed] [Google Scholar]


