Abstract.
Structured light imaging (SLI) with high spatial frequency (HSF) illumination provides a method to amplify native tissue scatter contrast and better differentiate superficial tissues. This was investigated for margin analysis in breast-conserving surgery (BCS) and imaging gross clinical tissues from 70 BCS patients, and the SLI distinguishability was examined for six malignancy subtypes relative to three benign/normal breast tissue subtypes. Optical scattering images recovered were analyzed with five different color space representations of multispectral demodulated reflectance. Excluding rare combinations of invasive lobular carcinoma and fibrocystic disease, SLI was able to classify all subtypes of breast malignancy from surrounding benign tissues () based on scatter and color parameters. For color analysis, HSF illumination of the sample generated more statistically significant discrimination than regular uniform illumination. Pathological information about lesion subtype from a presurgical biopsy can inform the search for malignancy on the surfaces of specimens during BCS, motivating the focus on pairwise classification analysis. This SLI modality is of particular interest for its potential to differentiate tissue classes across a wide field-of-view () and for its ability to acquire images of macroscopic tissues rapidly but with microscopic-level sensitivity to structural and morphological tissue constituents.
Keywords: structured light, spatial frequency domain imaging, breast-conserving surgery, tissue optics, colorimetry
1. Introduction
Breast-conserving surgery (BCS) involves removing the mass of tumor along with a surrounding layer of healthy tissue margin. BCS has been shown to be as effective as a full mastectomy for treating early-stage cancers, provided that the margins are clear of malignancy.1 US consensus guidelines suggest that “tumor on ink” must not be present for invasive cancers. In other words, no invasive cancer cells should be found on the surface of the excised lump. For ductal carcinoma in situ (DCIS), a 2-mm zone of malignancy-free tissue should exist on all sides of a resected specimen for its margins to be considered clear, with DCIS distances less than 2 mm but not “on ink” reserved for clinical judgment.2,3 Better methods for intraoperative margin assessment are of growing interest because 15%–35% of patients require a second surgery due to positive margins resulting from their initial BCS procedure.4–8 Fast, effective detection of involved margins at the time of the first operation would save costs and reduce morbidity associated with a second procedure. The current standard-of-care histological processing for breast specimen margin assessment involves hematoxylin and eosin (H&E) staining followed by microscopic examination by a pathologist. Unfortunately, the process is lengthy and suffers from sampling limitations. A number of technological solutions have been posed and tested for intraoperative inspection of resected breast specimens, but most lack the speed and wide-field needed to interrogate an entire lump.4
Detection of diseased tissue on the margin of a resected specimen requires sensitivity to the cellular, molecular, and/or structural features associated with the disease process. Unfortunately, technology assessment studies often involve a limited number of samples and usually divide them into single malignant and normal tissue classes.4 Typically, adipose and healthy fibroglandular tissues are grouped in the normal category along with other relevant subtypes of benign conditions, such as fibrocystic disease (FCD) or fibroadenoma. Although normal tissue variation in the breast is relatively low, healthy tissue subtypes occur within the breast, and combining them into a single category may dilute method accuracy and its clinical potential. Accordingly, this study evaluates optical color parameters by imaging a range of healthy, benign, and malignant tissue subtypes.
Several malignancies can arise in breast tissue, including invasive ductal carcinoma (IDC) of low, intermediate, and high grades or IDC of tubular origin, invasive lobular carcinoma (ILC), DCIS, lobular carcinoma in situ, mucinous carcinoma, and phyllodes tumor. Since the biology and pathology of malignant and benign subtypes of breast disease are different, the optical and color properties of these pathologies may also be different. Diversity leads to a wide range of breast cancer presentations, which complicates the tissue classification task. Pertinent clinical information could make intraoperative tissue classification simpler: presurgical biopsy diagnoses are known prior to surgical intervention. Thus, an efficient model for tissue subtype classification might use tissue optical and color properties combined with a priori information about the cancer. This classification approach might improve diagnostic accuracy by reducing the number of malignancy classifications being tested based on the clinical context.
Spatial frequency domain imaging (SFDI), also known as structured light imaging (SLI), delivers different spatial frequencies of light to illuminate the sample actively and records resulting in reflectance images. Reflectance data are demodulated and compared to a light transport model to obtain optical properties.9,10 The choice of spatial frequency can be exploited to select imaging depth.10 While SLI has been evaluated previously for margin status detection in BCS,11 the present study considers the largest dataset of breast tissue specimens imaged with SLI and offers the most extensive categorization of benign and malignant breast tissue subtypes. At high spatial frequency (HSF), the measured reflectance is largely due to scattering because of penetration depth limitations. Optical property quantification involves significant computation and modeling, making the process relatively slow and susceptible to additional sources of error.10 Color image analysis was tested here as a surrogate for scatter imaging. The color analysis was performed in five different color spaces and results were compared. The intensity of SLI data at each color was related to scatter of light at the corresponding wavelength without additional blurring resulting from modeling.
2. Materials and Methods
2.1. Instrumentation
A novel multimodal system that combines multispectral SLI with microcomputed tomography () was deployed. Its performance was quantified experimentally, as described in detail previously.12 The SLI system demonstrated a maximum spatial resolution of at the highest illumination spatial frequency () of and at the shortest source wavelength () of 490 nm. Optical scattering properties were recovered accurately with ratios of as low as 0.8. The optical system showed maximum contrast between adipose and an ILC lesion at with illumination and showed maximum contrast between FCD and the ILC again at with illumination. To create a flat imaging surface, a custom tissue holder was laser-cut from optically clear acrylic. The system imaged tissue specimens with four illumination spatial frequencies (, 0.15, 0.60, and ) at four source wavelengths (, 550, 600, 700 nm).12 It acquired a lateral cone beam μCT scan. The analysis presented here is focused solely on the SLI data.13
2.2. Study Protocol
The study was approved by the Dartmouth Hitchcock Medical Center (DHMC) Institutional Review Board for the protection of human subjects, and all procedures followed the approved protocol. Procurement of tissue specimens involved patients undergoing consented and elective breast surgeries at DHMC. Imaging occurred during normal pathology processing and did not interfere with or limit standard of care workflow. After the resected breast tissue was inked in the OR, it was brought to the Department of Pathology. Here, the specimen was “bread-loafed,” and a fresh tissue slice was imaged immediately with the SLI system, which was located in the surgical specimen grossing laboratory. “Bread-loafing” involves cutting a fresh specimen into roughly 5-mm thick slices along a single axis. Imaging of the slice required . Boundaries between pathologic diagnoses were determined by a board-certified pathologist according to “gold standard” histological processing and H&E staining. Imaged tissues were placed in cassettes, which were individually read by the pathologist, and regions of interest (RoIs) were drawn on the stained tissues. Image data from cassettes were combined in a PowerPoint slide and coregistered manually to SLI data to create corresponding optical image RoIs for analysis. BCS specimens () were coregistered to annotated histopathology, and qualitative morphological differences not considered in previous studies of resected specimens from BCS procedures were evaluated. A summary of enrolled tissues and associated subtype diagnoses is shown in Table 1. In the set of 70 specimens, 51 malignant RoIs and 69 benign RoIs were assessed. SLI data were digitally segmented and labeled for automated classification. Tissue diagnoses found in fewer than specimens and RoIs smaller than 256 pixels were excluded from the final analysis because of undersampling concerns. Fibroadenoma was also excluded since determining margin status in these cases is not relevant due to them being benign legions.14
Table 1.
Enrollment table of RoIs () identified from specimens () stratified by benign () and malignant () pathologies. RoIs column shows the number of samples with a region of that diagnosis in it and the Area/RoI column displays the average size of a region of that diagnosis in this study. Excluded cases (): phyllodes (), myofibroblastic (), norm , invasive carcinoma tubular (), invasive carcinoma metaplastic (). Excluded RoIs (): IDC low grade (), IDC intermediate grade (), ILC cases (), DCIS cases (). Excluded case due to optical property fitting hitting bounds: adipose (), IDC low grade ().
| RoIs | Area/RoI () | ||
|---|---|---|---|
| Malignant | 51 | 73.2 | |
| IDc low grade | 9 | 33.5 | |
| IDc Int. grade | 15 | 45.7 | |
| IDc high grade | 10 | 110.2 | |
| ILc | 8 | 103.9 | |
| DCIS | 5 | 80.3 | |
| Mucinous Ca | 4 | 102.9 | |
| Benign | 69 | 67.7 | |
| FCD | 7 | 138.2 | |
| Fibroadenoma | 4 | 177.1 | |
| Connective | 22 | 32.8 | |
| Adipose | 36 | 63.1 | |
| Total | 120 | 70.0 |
2.3. Optical Properties
Optical properties were calculated for 120 RoIs spanning 10 breast tissue pathologies based on a subdiffusive SFDI (sd-SFDI) model described in detail previously.9,12,15,16 This dataset represents one of the most complete descriptions of optical properties of breast tissue morphologies reported to date. For each RoI, the reduced scattering coefficient (), the absorption coefficient (), and the anisotropic scatter phase function parameter () were found at each wavelength based on the sd-SFDI model. Between each benign and malignant pathology, the most discriminant optical property was determined through a Mann–Whitney U test. The Mann–Whitney U test was chosen due to the small sample sizes for statistics and to avoid assume normal distributions. Receiver operating characteristics (ROC) analysis was performed and area under the curve (AUC) was used to codify the relative importance of each parameter.
2.4. Color Analysis
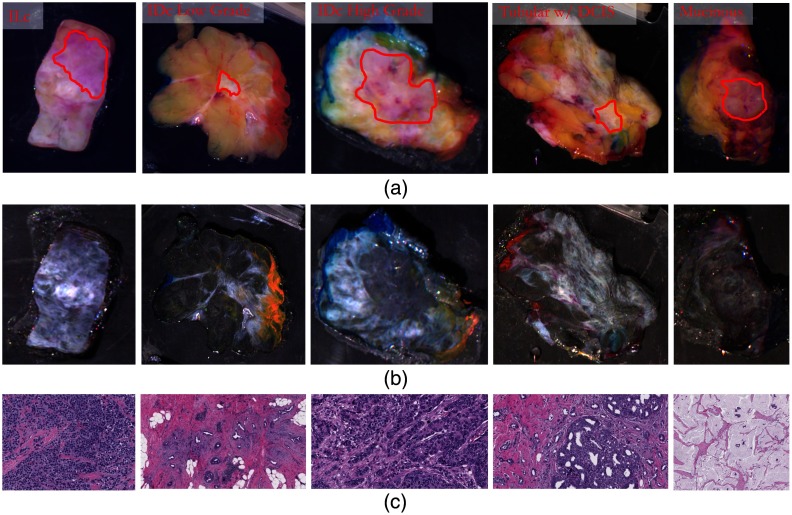
Red, green, and blue (RGB) color images were reconstructed using SLI data obtained at , 550, 600, 650, and 700 nm with a 15-nm bandwidth based on the weighting values provided by the International Commission on Illumination (CIE) 1931 2 deg Standard Observer model.12,17 Two color images, one with diffuse illumination () and one with HSF (), were created for each sample. The images of diffuse illumination were formed from the DC offset of the HSF images.10 A summary of this data is shown in Fig. 1. Color images at both diffuse (top row) and HSF (bottom row) illuminations are shown for representative cases of common malignant tumor subtypes (lesions outlined in red). These reconstructions of color images were compared to the RGB values obtained by an industrial color camera (Blackfly S 2.3 MP Color, FLIR Systems Inc., Wilsonville, Oregon) of a color card with known RGB values (24ColorCard, CameraTrax.com). It is important to note that different wavelengths of light will penetrate different depths into tissue so this combined image will not equally interrogate the same volume of tissue at each color channel. The light is also intentionally limited in its penetration depth with the HSF image. This should be considered when comparing the diffuse images to their HSF counterparts. This effect can be considered unavoidable due to the final goal of this application being imaging of surgical specimens which are thick.
Fig. 1.
Representative color images of five common malignant diagnoses, which were reconstructed using (a) diffuse () illumination (lesion boundaries outlined in red) and (b) HSF () visible wavelengths. (c) Representative digitized H&E sections from each specimen lesion.
Average intensity of each color channel was found for each subtype of benign and malignant pathology. Each color channel (RGB) were analyzed independently to find the most differentiable between each pair of benign and malignant tissue. These RGB images were converted to other color spaces to perform similar analyses: CIE xyz, CIE , hue saturation value (HSV), and grayscale. The CIE color space links color information to human perception of color using tristimulus values.18 This color space was chosen since a large part of tissue grossing is visual and mimicking human perception was wanted. The CIE channels correspond to lightness and green–red and blue–yellow color components. The CIE color space is designed to be uniform perceptually to human color vision and is considered device-independent which is why this color space was chosen.18 The HSV color space describes colors (hue) in terms of grayness (saturation) and brightness (value). This color space was chosen since the color aspect of it was separated from the grayness and brightness, so it could be seen if the color was the relevant parameter. Grayscale measures intensity independence of color values. Grayscale images had a single channel rather than the three that the other color space contained.19
3. Results
3.1. Optical Properties
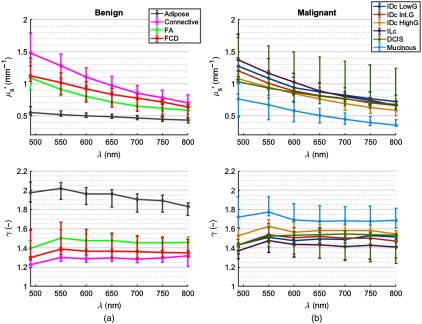
The top row of Fig. 2 shows versus wavelength for each pathologic subtype category. Points represent average RoI values, and error bars indicate standard deviations. The bottom row shows versus wavelength for each diagnosis. Benign diagnoses exhibit significant variation in these property parameters, suggesting that grouping all benign diagnoses together is unfavorable for discriminating between pathology subtypes. Similar characteristics are observed in the optical properties of malignant subtypes. Previous work has shown that has less diagnostic discriminatory power than scattering parameters.11 The data for this study have shown similar results in that and were more discriminatory. The focus on the rest of this manuscript will be on those.
Fig. 2.
Calculated optical scatter properties for (a) benign and (b) malignant pathologies, where each data point represents the mean of all lesions (error bars represent the 25th and 75th percentiles).
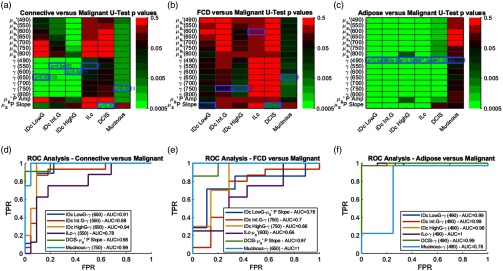
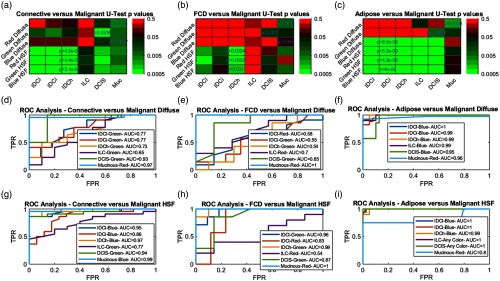
A Mann–Whitney U test calculated -values to describe statistical significance between optical properties of each benign and malignant diagnostic pair. Figure 3 shows a heat map of significance for optical property discrimination of each benign and malignant classification pair.
Fig. 3.
The -value heat maps of optical property discrimination of (a) connective, (b) FCD, and (c) adipose from each malignant pathology. The most discriminatory property for each benign-malignant pair is highlighted in light blue. The -values were quantified using a Mann–Whitney test. Numbers in parentheses are illumination wavelength in nm. Corresponding ROC curves for the most discriminant optical property in (a)–(c) are presented in (d)–(f) with axes of true-positive rate (TPR) and false-positive rate (FPR).
3.2. Color Analysis
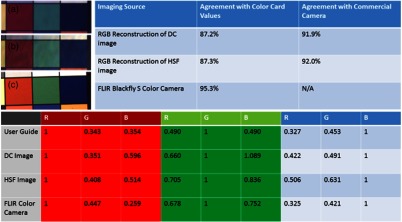
Figure 4 shows the comparison of the RGB values obtained from the reconstructions of SLI data to the given values from the color card’s user guide and a commercial color camera. The top left of the figure shows the (a) diffuse reconstruction, (b) the HSF reconstruction, and (c) an image from the color camera for three squares that represented red, green, and blue. The bottom of the figure shows values for R, G, and B normalized to the primary color channel of that square for each image. The top right of Fig. 4 shows the agreement percent between images. The RGB reconstructions had about an 87% agreement with the given values for both the diffuse image and the HSF image. The commercial camera had about a 95% agreement. The reconstructions did show a roughly 92% agreement with the commercial camera. This shows that the reconstructions are not as accurate as a true color camera but the purpose of using color reconstructions for this study was to be intuitive for the surgical staff rather than true color values. Consistent values were more important than exact values for this study.
Fig. 4.
RGB value comparison between SLI reconstructions, a commercial camera, and the given values from a color card. Top left: Images from (a) diffuse reconstruction of SLI data, (b) HSF reconstruction of SLI data, and (c) color image from commercial camera. Bottom: RGB values normalized to the most pertinent color channel value (RGB). Top right: Percent agreement between the given values of color card and the measured values for the images and percent agreement with the measured values from the commercial camera.
Table 2 summarizes color space channel differentiation of each benign and malignant diagnosis () based on a Mann–Whitney U test. In most cases, results are similar regardless of the color space, which is expected given that the underlying data are the same, only the focus of the color channels change. However, for more challenging cases, such as differentiating ILC from connective tissue or distinguishing FCD from most malignancies, certain color spaces exhibit advantages. RGB and CIE appear to be promising color spaces because they focus on color separation. This observation suggests that color has additional discriminatory power beyond intensity contrast.
Table 2.
Chart indicating color space differentiation between malignant and benign diagnoses with . The top half of the chart refers to color spaces RGB, CIE , CIE , and HSV. The “diffuse” or “” after the color space abbreviation refers to either diffuse or HSF images. The lower half of the chart refers to grayscale values either diffuse or at HSF.
| Color | Adipose | Connective | FCD |
|---|---|---|---|
| IDCI | All | All | All HSF |
| IDCi | All | All | , , |
| IDCh | All | All | All HSF |
| ILC | All | RGBh, XYZh, HSVh | None |
| DCIs | All | All | All but HSV diffuse |
| Mucinous |
All diffuse, RGBh |
All |
All |
| Gray |
Adipose |
Connective |
FCD |
| IDCI | HSF | Both | HSF |
| IDCi | HSF | Both | HSF |
| IDCh | HSF | Both | HSF |
| ILC | Both | HSF | Neither |
| DCIs | HSF | Both | Both |
| Mucinous | Diffuse | Both | Both |
To test the hypothesis, RGB images were converted to grayscale intensities and compared to the results from different color spaces. Grayscale results were similar to those from color: at least one channel provided a statistically significant difference between each malignancy and all benign tissues with the exception of ILC and FCD—a combination that neither color channel nor grayscale values were able to differentiate with statistical significance. Grayscale values were influenced less by whether low spatial frequency (diffuse) or HSF were used compared to their color counterparts.
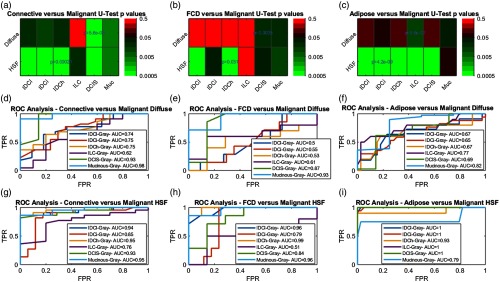
Figure 5 presents more detailed results from the color analysis in RGB space. The top row contains -value heat maps in which green tiles depict statistical significance, whereas red tiles are not statistically significant for (a) connective tissue, (b) FCD, and (c) adipose tissue versus malignant subtypes. Bottom two rows show binary classification ROC curves for diffuse and HSF imagery, respectively. Apart from FCD versus ILC, statistically different color space channels exist for every benign-malignant subtype pair. With only two exceptions (i.e., adipose tissue versus mucinous cancer and FCD versus ILC), benign-malignant pairs were more differentiated under HSF illumination relative to diffuse illumination. These results suggest that color analysis is similar or even more effective than optical property parameters at differentiating between benign-malignant diagnosis pairs.
Fig. 5.
Color value discrimination of connective, FCD, and adipose from malignant pathology was determined with a Mann–Whitney test. The most significant -values are displayed in (a), (b), and (c), respectively. (d)–(i) Corresponding ROC curves plotted with AUC corresponding to the most discriminant color value displayed. ROC curves in (d)–(f) are based on results from diffuse imaging whereas (g)–(i) are based on results at HSF.
Figure 6 shows the same type of information for grayscale imagery. Similarly to the color analysis, the grayscale results are better for HSF images relative to diffuse data, but they are worse overall than the corresponding color discrimination analysis.
Fig. 6.
Same as in Fig. 5 for grayscale intensity. Green areas of heat maps are significantly differentiable (), whereas red values are not statistically significant.
4. Discussion
Approximately 15%–35% of breast conserving surgeries require re-excision due to malignant cells found at or near the margins of the originally resected specimen. The high rate of re-excision increases patient anxiety, causes additional risk associated with a second surgery, and increases healthcare costs. Current standard of care involves time-intensive postoperative margin assessment by permanent histology. SLI is a relatively low-cost, yet fast, imaging modality with wide field-of-view; hence, it appears to be ideal for intraoperative margin assessment in BCS. Specimen imaging could be performed immediately after excision and within seconds to minutes, depending on the desired number of spatial frequencies and wavelengths. Methods exist to accelerate data collection further. The standard surgical practice involves inking of margins to maintain anatomical orientation. Unfortunately, surgical inks absorb optical light and impact SLI data significantly.20 To avoid this complication, inking must be performed with agents that are less absorbing at desired wavelengths, or SLI must occur prior to specimen inking. In the latter case, maintaining anatomical orientation during SLI acquisition is possible, for example, using a specimen holder similar to the one developed for this study but with unique fiducial markers.
Although other studies have considered structured light for its potential to detect positive margins during BCS, this study appears to evaluate SLI with the largest set of fresh specimens and most in-depth categorization of benign and malignant tissue subtypes used to date. Combining SLI color and optical scatter analysis with a priori information about the type of tumor present would integrate seamlessly with standard clinical workflow, because patients undergo needle-core biopsy as a part of preoperative standard of care. This paper demonstrates the importance of subtype tissue classification, especially for malignancy, since image property parameters varied significantly with subtype categories. Separation of results into single malignant or benign categories dilutes the diagnostic accuracy of the findings reported here.
SLI is a potentially promising intraoperative image-based solution for positive margin detection during BCS. It offers rapid, wide field-of-view acquisition of quantitative images of tissue surfaces. At least one of the optical properties recovered from a subdiffusive model of light attenuation separated each malignant diagnosis (i.e., IDC low, intermediate or high grade, ILC, DCIS, or mucinous carcinoma) from the benign pathologies expected in these specimens (i.e., adipose tissue, connective tissue, and FCD) with statistical significance () in all cases (except FCD versus ILC). The subdiffusive optical properties emphasize the scattering aspects of light transport, which was found to be the most differentiating, suggesting that a large fraction of what makes malignancy distinguishable from healthy tissue resides in how light is scattered by tissue.
Color image analysis provided similar statistics in that every malignancy was able to be differentiated from all benign pathologies (except for FCD versus ILC). The color analysis was performed on images reconstructed using monochromatic data from five wavelengths spanning blue to near infrared through the CIE 2 deg Standard Observer Model. RoIs in HSF images were far more differentiable from surrounding benign tissue, which indicates the potential utility of HSF imaging in BCS. Further analysis compared results in different color spaces. The RGB and CIE color spaces were found to be the best. These color spaces emphasize color separation, which is an intuitive result since a large part of tissue grossing in pathology is based on observed color. The same analysis was also applied to grayscale images. ROC outcomes indicate that color images were better statistically for differentiation than their grayscale counterparts. Overall, color images at HSF were best for this purpose. Color analysis at HSF yielded similar results to optical property analysis, which is largely due to the shallow depth of light penetration under HSF illumination. The reduced path length leads to these color images being strongly weighted to light scattering with very few scattering events.9 Color images are far less quantitative and more hardware-dependent than optical properties, however. This was shown in comparison to the commercial camera. Additional corrections to make these metrics more hardware-independent are an important future step. The benefits of color analysis relative to optical property analysis appear to be the avoidance of blurring effects and speed of acquisition.
All analyses associated with the study indicate the necessity of separating malignancies by subtype. Some tumor types present nearly opposing signals compared to healthy tissue; some malignancies had positive contrast with healthy tissue while others generated negative contrast. These trends are problematic for classification performed only in terms of benign versus malignant categories.
Both optical property and color analyses were performed at the pixel level without a spatial context of any kind. Consequently, important textural information is omitted, which is considered in part II of this paper.21 Textural information is known to be important in mammography. Its benefits occur at the pixel level because smaller regions can be included and allow the image analysis to retain its original spatial resolution.
Another drawback of the study is that neither the optical property nor color analysis distinguished FCD and ILC statistically. ILC is a relatively uncommon form of malignancy representing about 15% of breast cancer diagnoses.22 FCD is not present in every BCS case; thus, the presence of both FCD and ILC in a breast cancer patient is relatively rare.
The study involved SLI data of bread-loafed breast tissue specimens. The next stage of evaluation will focus on SLI data collection on intact breast specimens, which must be considered for SLI to become a valuable tool for intraoperative margin assessment during BCS.
5. Conclusions
During a BCS procedure, tumor subtype is confirmed preoperatively through needle core biopsy; hence, future diagnostic classification algorithms may assume that a specific and known tumor subtype is of interest. This study determined the color and/or optical scatter properties that facilitate optimal classification. Results from a large set of patients ( patients with malignant RoIs and benign RoIs) show that the most distinguishing characteristics of diagnosis vary in both scatter properties and in color analysis depending on malignancy type and subtype. The study has also shown that normal tissues should be separated when creating classifications for identifying malignancies in a sample. The potential of SLI, particularly at higher spatial frequencies, for lowering the positive margin rates intraoperatively during BCS is evident. Optical properties distinguished regions of malignancy from benign tissue with high statistical significance in all cases except when rare combinations of FCD and ILC occurred. The color analysis showed a similar promise. HSFs were found to be far more diagnostic than low spatial frequencies, and color and grayscale intensity were important as well. Overall, SLI shows promise for lowering positive margin rates in BCS based on its ability to differentiate subtypes of malignancy and benign tissues quickly and with high statistical significance. Color analysis trades-off biological information for speed and detail in its determination of region diagnosis.
Acknowledgments
This work has been funded by the National Cancer Institute within the U.S. National Institutes of Health under Grant Nos. R01 CA192803 and F31 CA196308.
Biography
Biographies of the authors are not available.
Disclosures
The authors declare no conflicts of interests.
References
- 1.Fisher B., et al. , “Twenty-year follow-up of a randomized trial comparing total mastectomy, lumpectomy, and lumpectomy plus irradiation for the treatment of invasive breast cancer,” N. Engl. J. Med. 347(16), 1233–1241 (2002). 10.1056/NEJMoa022152 [DOI] [PubMed] [Google Scholar]
- 2.Moran M. S., et al. , “Society of Surgical Oncology-American Society for Radiation Oncology consensus guideline on margins for breast-conserving surgery with whole-breast irradiation in stages I and II invasive breast cancer,” Ann. Surg. Oncol. 21(3), 704–716 (2014). 10.1245/s10434-014-3481-4 [DOI] [PubMed] [Google Scholar]
- 3.Morrow M., et al. , “Society of Surgical Oncology-American Society for Radiation Oncology-American Society of Clinical Oncology consensus guideline on margins for breast-conserving surgery with whole-breast irradiation in ductal carcinoma in situ,” Ann. Surg. Oncol. 23(12), 3801–3810 (2016). 10.1245/s10434-016-5449-z [DOI] [PMC free article] [PubMed] [Google Scholar]
- 4.Maloney B. W., et al. , “Review of methods for intraoperative margin detection for breast conserving surgery,” J. Biomed. Opt. 23(10), 1–19 (2018). 10.1117/1.JBO.23.10.100901 [DOI] [PMC free article] [PubMed] [Google Scholar]
- 5.Fleming F. J., et al. , “Intraoperative margin assessment and re-excision rate in breast conserving surgery,” Eur. J. Surg. Oncol. 30(3), 233–237 (2004). 10.1016/j.ejso.2003.11.008 [DOI] [PubMed] [Google Scholar]
- 6.Balch G. C., et al. , “Accuracy of intraoperative gross examination of surgical margin status in women undergoing partial mastectomy for breast malignancy,” Am. Surg. 71(1), 22–27; discussion 27–28 (2005). [PubMed] [Google Scholar]
- 7.Lovrics P. J., et al. , “The relationship between surgical factors and margin status after breast-conservation surgery for early stage breast cancer,” Am. J. Surg. 197(6), 740–746 (2009). 10.1016/j.amjsurg.2008.03.007 [DOI] [PubMed] [Google Scholar]
- 8.Lovrics P. J., et al. , “Technical factors, surgeon case volume and positive margin rates after breast conservation surgery for early-stage breast cancer,” Can. J. Surg. 53(5), 305–312 (2010). [PMC free article] [PubMed] [Google Scholar]
- 9.Kanick S. C., et al. , “Sub-diffusive scattering parameter maps recovered using wide-field high-frequency structured light imaging,” Biomed. Opt. Express 5(10), 3376–3390 (2014). 10.1364/BOE.5.003376 [DOI] [PMC free article] [PubMed] [Google Scholar]
- 10.Cuccia D. J., et al. , “Quantitation and mapping of tissue optical properties using modulated imaging,” J. Biomed. Opt. 14(2), 024012 (2009). 10.1117/1.3088140 [DOI] [PMC free article] [PubMed] [Google Scholar]
- 11.Laughney A. M., et al. , “Spectral discrimination of breast pathologies in situ using spatial frequency domain imaging,” Breast Cancer Res. 15(4), R61 (2013). 10.1186/bcr3455 [DOI] [PMC free article] [PubMed] [Google Scholar]
- 12.McClatchy D. M., III, et al. , “Calibration and analysis of a multimodal micro-CT and structured light imaging system for the evaluation of excised breast tissue,” Phys. Med. Biol. 62(23), 8983–9000 (2017). 10.1088/1361-6560/aa94b6 [DOI] [PMC free article] [PubMed] [Google Scholar]
- 13.McClatchy D. M., III, et al. , “Micro-computed tomography enables rapid surgical margin assessment during breast conserving surgery (BCS): correlation of whole BCS micro-CT readings to final histopathology,” Breast Cancer Res. Treat. 172(3), 587–595 (2018). 10.1007/s10549-018-4951-3 [DOI] [PMC free article] [PubMed] [Google Scholar]
- 14.Greenberg R., Skornick Y., Kaplan O., “Management of breast fibroadenomas,” J. Gen. Intern. Med. 13(9), 640–645 (1998). 10.1046/j.1525-1497.1998.cr188.x [DOI] [PMC free article] [PubMed] [Google Scholar]
- 15.McClatchy D. M., III, et al. , “Monochromatic subdiffusive spatial frequency domain imaging provides in-situ sensitivity to intratumoral morphological heterogeneity in a murine model,” J Biophotonics 10(2), 211–216 (2017). 10.1002/jbio.201600181 [DOI] [PMC free article] [PubMed] [Google Scholar]
- 16.McClatchy D. M., III, et al. , “Wide-field quantitative imaging of tissue microstructure using sub-diffuse spatial frequency domain imaging,” Optica 3(6), 613–621 (2016). 10.1364/OPTICA.3.000613 [DOI] [PMC free article] [PubMed] [Google Scholar]
- 17.Judd D. B., “The 1931 I. C. I. standard observer and coordinate system for colorimetry,” J. Opt. Soc. Am. 23(10), 359–374 (1933). 10.1364/JOSA.23.000359 [DOI] [Google Scholar]
- 18.Schanda J., Colorimetry: Understanding the CIE System, John Wiley & Sons, Hoboken, New Jersey: (2007). [Google Scholar]
- 19.Gonzalez R. C., Woods R. E., Eddins S. L., Digital Image Processing Using MATLAB, 2nd ed., Gatesmark Pub, Knoxville, Tennessee, xviii, p. 826 (2009). [Google Scholar]
- 20.McClatchy D. M., III, et al. , “Molecular dyes used for surgical specimen margin orientation allow for intraoperative optical assessment during breast conserving surgery,” J. Biomed. Opt. 20(4), 040504 (2015). 10.1117/1.JBO.20.4.040504 [DOI] [PMC free article] [PubMed] [Google Scholar]
- 21.Streeter S. S., et al. , “Structured light imaging for breast conserving surgery, part II: texture analysis,” J. Biomed. Opt. 24(9), accepted (2019). [DOI] [PMC free article] [PubMed] [Google Scholar]
- 22.Li C. I., Uribe D. J., Daling J. R., “Clinical characteristics of different histologic types of breast cancer,” Br. J. Cancer 93(9), 1046–1052 (2005). 10.1038/sj.bjc.6602787 [DOI] [PMC free article] [PubMed] [Google Scholar]


