To improve care coordination and cost‐effectiveness of cancer care, payers and physicians are transitioning from traditional fee‐for‐service payment systems to value‐based and bundled‐care models in oncology. This article provides estimates of the incremental cost of disease progression in patients with cancer and compares costs among patients with and without evidence of disease progression. Quantifying the financial impact of progression of disease can inform decisions about participating in or setting up episode/bundled payment programs.
Keywords: Breast cancer, Lung cancer, Colorectal cancer, Progression, Costs
Abstract
Introduction.
To reduce health care costs and improve care, payers and physician groups are piloting value‐based and episodic or bundled‐care payment models in oncology. Disease progression and associated costs may affect these models, particularly if such programs do not account for disease severity and progression risk across patient populations. This study estimated the incremental cost of disease progression in patients diagnosed with metastatic breast cancer (mBC), colorectal cancer (mCRC) and lung cancer (mLC) and compared costs among patients with and without progression.
Methods.
This was a retrospective study using U.S. administrative claims data from commercial and Medicare Advantage health care enrollees with evidence of mBC, mCRC, and mLC and systemic antineoplastic agent use from July 1, 2006, to August 31, 2014. Outcome measures included disease progression, 12‐month health care costs, and 3‐year cumulative predictive health care costs.
Results.
Of 5,709 patients with mBC, 3,707 patients with mCRC, and 5,201 patients with mLC, 56.8% of patients with mBC, 58.1% of those with mCRC, and 80.3% of those with mLC patients had evidence of disease progression over 12 months. Among patients with mBC and mCRC, adjusted and unadjusted health care costs were significantly higher among progressors versus nonprogressors. Per‐patient‐per‐month costs, which accounted for variable follow‐up time, were almost twice as high among progressors versus nonprogressors in patients with mBC, mCRC, and mLC. In each of the three cancer types, delays in progression were associated with lower health care costs.
Conclusion.
Progression of mLC, mBC, and mCRC was associated with higher health care costs over a 12‐month period. Delayed cancer progression was associated with substantial cost reductions in patients with each of the three cancer types.
Implications for Practice.
Data on the rates and incremental health care costs of disease progression in patients with solid tumor cancers are lacking. This study estimated the incremental costs of disease progression in patients diagnosed with lung cancer, breast cancer, and colorectal cancer and compared health care costs in patients with and without evidence of disease progression in a real‐world population. The data obtained in our study quantify the economic value of delaying or preventing disease progression and may inform payers and physician groups about value‐based payment programs.
Introduction
By 2020, an estimated 1 in 19 Americans will have or have had cancer [1]. Lung cancer (LC), breast cancer (BC), and colorectal cancer (CRC) are the three most common cancer types, accounting for 36% of all new cancer cases in the U.S. [2]. Between 2010 and 2020, the number of new cancer cases in the U.S. is expected to increase 24% in men and 21% in women; however, mortality rates are expected to decrease, in part because of screening or earlier diagnosis and access to more effective treatment and care [3].
Cancer treatment and care is the fastest‐growing health care sector [4]. In 2010, the cost of cancer care was highest for female BC ($16.5 billion), followed by CRC ($14.14 billion) and LC ($12.12 billion) [5]. With the increasing prevalence of cancer survivors, costs are projected to increase 27% by 2020. According to 2020 estimates, among all cancer types, CRC is expected to have the highest initial phase of care costs, LC is expected to have the highest last‐year‐of‐life phase of care costs, and female BC is expected to have the highest costs in the continuing phase of care [5].
To reduce costs and improve care, payers and providers are implementing value and quality‐based models to replace fee‐for‐service payment systems [6], [7], [8]. In these models, physicians are incentivized to reduce negative outcomes, including hospital admissions and mortality (pay‐for‐performance model) or are provided a fixed amount of money for a defined time period to treat each patient (bundle or episode payment model). The Centers for Medicare and Medicaid Services, in partnership with 17 commercial payers, has created the Oncology Care Model (OCM) to provide episode payments and performance‐based incentives for physicians treating Medicare patients with chemotherapy [8]. This program allows for improvements in patient management and treatment coordination while incentivizing lower costs. The impact of these payment models may vary for patients with different solid tumor malignancies given the range of disease severity; LC has a higher mortality rate than CRC or BC, but each disease has improving outcomes, with patients requiring longer treatment periods. Cancer progression and associated costs may also affect bundled payment programs, particularly if the programs do not account for disease severity, progression risk, and the costs associated with progression. Payers and providers need to understand both the true disease burden in patients covered under episode or bundled payment programs and the variability of this burden across patients with different clinical characteristics, including the impact of disease progression.
The current literature lacks information on the rates and incremental health care costs of disease progression in patients with solid tumor cancers. These data would inform payers and providers of the economic value of delaying or preventing disease progression and may inform payers and physician groups on appropriate reimbursement in new value‐based payment programs. The objectives of this study were to estimate the incremental cost of disease progression in patients diagnosed with metastatic BC (mBC), CRC (mCRC), or LC (mLC) and to compare costs among patients with and without evidence of disease progression in a real‐world population.
Materials and Methods
Data Sources
Data from this retrospective study were from the Optum Research Database (ORD), which includes enrollment information and medical and pharmacy claims for approximately 14 million enrollees with commercial coverage and 3 million enrollees with Medicare Advantage with Part D coverage annually. The ORD is geographically diverse and representative of the U.S. commercially insured population. Medical claims included diagnosis and procedure codes from the International Classification of Diseases, 9th Revision (ICD‐9), Clinical Modification; Current Procedural Terminology (CPT), version 4 procedure codes; Health Care Common Procedure Coding System (HCPCS) codes; revenue codes; and site of service codes. Outpatient pharmacy claims included National Drug Codes for dispensed medications, quantity dispensed, dose, and number of days’ supply. Claims data from the ORD were linked to mortality data derived from the Social Security Administration database. No identifiable protected health information was extracted or accessed during the course of the study, and the study did not require institutional review board approval or waiver of authorization.
Study Sample Selection
The study population consisted of commercial and Medicare Advantage health plan enrollees with at least two nondiagnostic medical claims at least 30 days apart in any position on the claim for BC (174.xx), CRC (153.xx, 154.0x, 154.1x, or 154.8x), or LC (162.xx) from July 1, 2006 through August 31, 2014. Additionally, patients were required to have at least two nondiagnostic medical claims at least 30 days apart in any position on the claim for metastatic disease; the date of the first claim for metastatic disease was designated as the metastasis date. To meet inclusion criteria for the study, patients must have had at least one claim for any systemic antineoplastic agent from January 1, 2007 to August 31, 2014, on or after the metastasis date. The date of the first medication claim after the metastasis date was considered the index date. Patients were also required to be at least 18 years of age as of the index date and to have continuous enrollment in the health plan with medical and pharmacy benefits at least 6 months prior to the index date and at least 6 months after the index date, except in the case of death. Continuous enrollment was also required during the time period from the metastasis date to the index date. Patients with evidence of additional cancers (at least two nondiagnostic medical claims for a cancer diagnosis other than the index diagnosis at least 30 days apart with the same three‐digit ICD‐9 code in any position on the claim) or evidence of metastatic disease in the 6 months prior to the metastasis date were excluded from the study analysis. The period of 6 months prior to the index date was defined as the baseline period, and the follow‐up period was defined as the time period after the index date to the earliest of death, discontinuation of the health plan, or the end of the study period (August 31, 2014). The analyses focus on the subpopulation of patients who met the additional criterion of continuous enrollment for at least 12 months (unless they died); for this subset of patients, the 12‐month period after the index date was used to measure outcomes. For the larger group of patients with at least 6 months of continuous enrollment, the follow‐up period was variable (up to 36 months).
Measures
Demographic and Patient Characteristics.
Characteristics assessed during the baseline period included age at the index date, sex, geographic region, insurance type, and comorbidity based on the Quan‐Charlson comorbidity index [9] and Clinical Classifications Software from the Agency for Healthcare Research and Quality (AHRQ) [9], [10]. Patient characteristics are presented for the 12‐month patient subpopulation.
Outcomes.
Outcomes measured in the follow‐up period included disease progression and health care costs. Disease progression was defined as the start of a second line of therapy, receipt of hospice care, or death. The first line of therapy began on the date of the first infusion or fill of a systemic antineoplastic agent after the index date and included all cancer agents filled or infused within the first 45 days. The second line of therapy was considered to have started with the addition or substitution of a new agent or on the date of the first infusion or fill of any systemic antineoplastic agent after a treatment gap of at least 60 days after the runout date of all agents in the first line. Note that discontinuation of a single drug from a multidrug regimen did not result in ending a line of therapy. The runout date for infused or injected drugs was considered the last date of administration plus 29 days, and the runout date for pharmacy‐filled agents was the fill date plus one less than the number of days the medication was supplied. Hospice care was defined as a claim for hospice care identified based on CPT procedure codes, HCPCS codes, site of service codes, revenue codes, provider specialty codes, or patient discharge status related to hospice care. Among the subset of patients with at least 12 months of follow‐up, time from index date until progression was calculated and used to stratify patients into two cohorts: patients who progressed within 12 months after the index date and patients who had not progressed within that time period. For the analyses of patients with at least 6 months of follow‐up, the month of progression (after the index date) was identified, and patients were stratified by whether they had progressed by the month of analysis.
Health care costs were calculated as combined health plan‐paid and patient‐paid amounts adjusted to 2014 U.S. dollars using the annual medical care component of the Consumer Price Index [11] to account for inflation. Total health care costs were subdivided into hospital outpatient costs, inpatient costs, emergency services costs, office and clinic visit costs, pharmacy costs, and other costs. Two main cost outcomes were captured. First, costs were captured during the first 12 months of follow‐up among patients with at least 12 months of follow‐up or less because of death. Because of variable follow‐up as a result of mortality, 12‐month costs were also calculated as per patient per month (PPPM). Second, among patients with at least 6 months of follow‐up, monthly costs were captured from the index date through the entire follow‐up time the patient accrued up to 36 months. A month was defined as 30 days, and costs were calculated for every 30‐day period (i.e., index date to index date plus 29, index date plus 30 to index date plus 59) during which the patient was continuously enrolled. Costs were still captured during a given month if a patient had less than 30 days because of death.
Statistical Analysis
All study variables were analyzed descriptively and stratified by cancer type. Bivariate comparisons were analyzed by Student's t tests for continuous variables and by chi‐square tests for categorical variables to compare patients whose cancer progressed with those whose cancer did not progress among the 12‐month subpopulation. Twelve‐month costs and associated PPPM costs were calculated among patients with evidence of disease progression over the first 12 months and compared with those with no evidence of progression over the first 12 months.
To control for possible confounding of the relationship between 12‐month health care costs and disease progression, 12‐month health care costs were analyzed with a generalized linear model (gamma distribution and log link) adjusting for the following baseline characteristics: age, gender, geographic region, insurance type, total health care costs (quartiles), Quan‐Charlson comorbidity score, receipt of radiation therapy, and AHRQ comorbidity flags.
To assess cumulative costs among patients with at least 6 months of follow‐up, monthly costs were analyzed at the patient‐month level using a generalized linear model (gamma distribution with log link) with robust standard errors to account for correlation of monthly costs within a patient. Weights defined as the inverse of the Kaplan‐Meier probability of enrollment through a given month were used to account for censoring, which included disenrollment from the health plan or death that occurred during the study period [12]. The same set of covariates were used here as in the 12‐month cost model to account for potential confounding, with the addition of covariates that captured how costs changed over time after the index date. In addition, the effects of progression were captured by including measures to indicate the relationship of the month of analysis relative to the point of progression (e.g., month of progression, whether the month was prior to or after progression). The predicted monthly costs generated in the model were summed to create predicted cumulative costs.
Results
Study Sample and Disease Progression
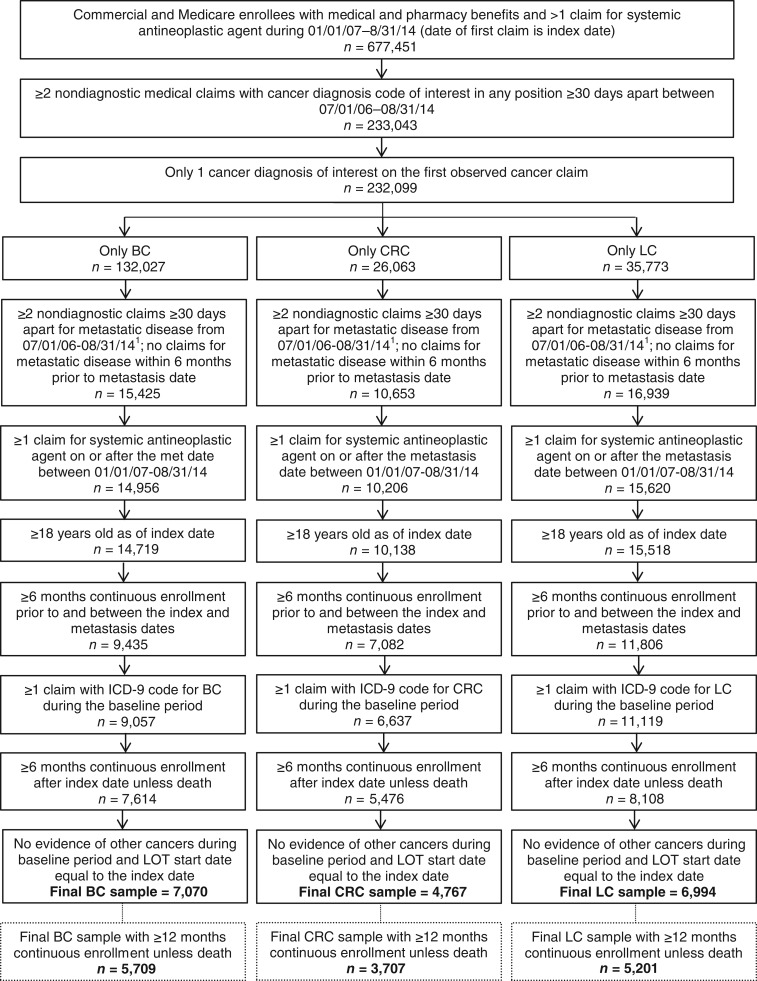
After applying inclusion and exclusion criteria, 5,709 patients with evidence of mBC, 3,707 patients with evidence of mCRC, and 7,601 patients with evidence of mLC were included in the study (Fig. 1). Over the course of the first 12 months of follow‐up (among patients with at least 12 months of follow‐up), disease progression occurred in 56.8% (3,245/5,709) of patients with mBC, in 58.1% (2,155/3,707) of patients with mCRC, and in 80.3% (4,177/5,201) of patients with mLC. Among those who progressed, the percentage of patients who used hospice care or died within the first 12 months was highest among patients with mLC (53.6% died; 39.2% used hospice) compared with patients with mBC (13.4% died; 23.0% used hospice) or mCRC (17.8% died; 29.8% used hospice).
Figure 1.
Patient selection. 1Date of the first claim for metastasis is the metastasis date.
Abbreviations: BC, breast cancer; CRC, colorectal cancer; ICD‐9, International Classification of Diseases, 9th Revision; LC, lung cancer; LOT, line of therapy.
Baseline Characteristics
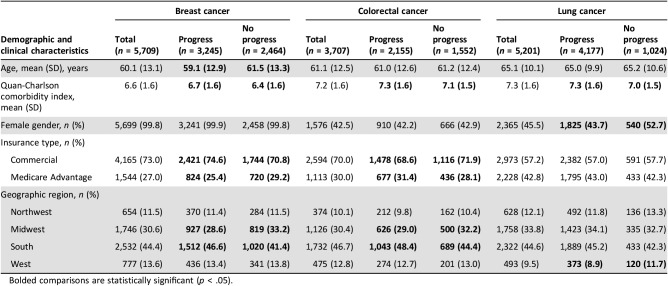
Baseline patient demographic and clinical characteristics are shown in Table 1. Mean age was 60.1, 61.1, and 65.1 years in patients with mBC, mCRC, and mLC, respectively. Patients with mBC who progressed were younger than those with no progression (p < .001). Among all cancer types, patients who progressed had higher comorbidity index scores than patients who did not progress (p < .001). The Quan‐Charlson comorbidity index score was approximately 7 for the overall population. The majority of the mCRC and mLC study populations were male (57.5% among mCRC, 54.5% among mLC) and almost all patients with mBC were female (99.8%). Among patients with mLC, a larger proportion of male patients were observed among the progressors compared with nonprogressors (56.3% vs. 47.3%, p < .001). More patients had commercial insurance than Medicare Advantage coverage across all three cancer types. Patients with mBC with commercial insurance were more likely to progress than those with Medicare Advantage coverage (p = .001), whereas patients with mCRC with Medicare Advantage insurance were more likely to progress than patients with commercial insurance (p = .029).
Table 1. Baseline patient demographic and clinical characteristics.
Bolded comparisons are statistically significant (p < .05).
Health Care Costs
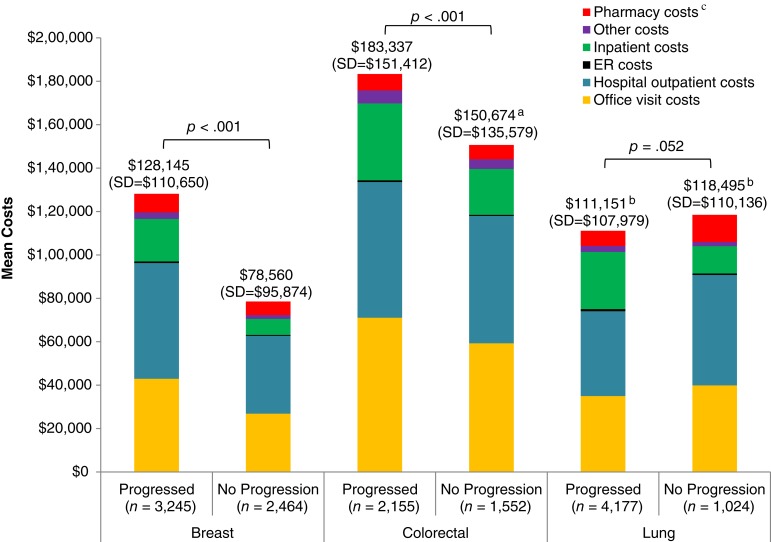
Among patients with mBC, average costs for health care services over 12 months were higher among progressors than nonprogressors ($128,145 vs. $78,560, p < .001; Fig. 2). This was true among all sites of service, including office visits ($42,968 vs. $26,853, p < .001), hospital outpatient visits ($53,304 vs. $35,897, p < .001), emergency room (ER) visits ($716 vs. 418, p < .001), inpatient stays ($19,623 vs. $7,400, p < .001), pharmacy costs ($8,510 vs. $6,284, p < .001), and other costs ($3,024 vs. $1,708, p < .001). Patient‐paid amounts represented 3.6% and 4.7% of total health care costs among progressors and nonprogressors, respectively. Hospital outpatient visits were the largest cost driver among patients with mBC, accounting for 42% of total costs among progressors and 46% among nonprogressors. Costs for systemic antineoplastic agents were higher among progressors than nonprogressors (p < .001) and accounted for approximately 21% and 22% of total costs, respectively.
Figure 2.
Unadjusted 12‐month health care costs among patients with metastatic breast, colorectal, and lung cancer by site of service.
aTotal is higher than sum of components because of rounding.
bTotal is lower than sum of components because of rounding.
cPharmacy costs include costs for outpatient pharmacy fills.
Abbreviation: ER, emergency room.
Patients with mCRC had the highest 12‐month health care costs, with a mean cost of $183,337 among progressors and $150,674 among nonprogressors (p < .001). Compared with nonprogressors, progressors with mCRC had significantly higher costs for office visits ($71,074 vs. $59,288, p < .001), ER visits ($803 vs. $476, p < .001), inpatient stays ($35,406 vs. $21,156, p < .001), pharmacy costs ($7,517 vs. $6,611, p = .019), and other costs ($6,035 vs. $4,418, p < .001). Patient‐paid amounts were approximately 2.7% and 3.0% of total health care costs among progressors and nonprogressors, respectively. The largest cost driver was office visit costs, accounting for 39% of total costs among both progressors and nonprogressors. Costs associated with systemic antineoplastic agents were higher among progressors versus nonprogressors (p < .001) and accounted for 29% of total costs among progressors and 30% among nonprogressors.
The 12‐month health care costs were similar among patients with mLC with and without disease progression ($111,151 vs. $118,495, p = .052). mLC progressors had significantly higher costs compared with nonprogressors for ER visits ($1,006 vs. $677, p < .001), inpatient stays ($26,316 vs. $12,596, p < .001), and other costs ($2,790 vs. $1,948, p = .002). mLC nonprogressors had significantly higher costs compared with progressors for office visits ($39,894 vs. $34,980, p = .018), outpatient visits ($50,879 vs. $39,067, p < .001), and pharmacy costs ($12,503 vs. $6,993, p < .001). Patient‐paid amounts accounted for 3.8% and 4.2% of the total costs among progressors and nonprogressors, respectively. Hospital outpatient costs were the major cost driver among mLC patients, accounting for 35% and 43% of total costs among progressors and nonprogressors, respectively. Mean costs associated with systemic antineoplastic agent use were higher among nonprogressors versus progressors (p < .001) and accounted for 19% of the total costs among progressors and 26% of the total costs among nonprogressors.
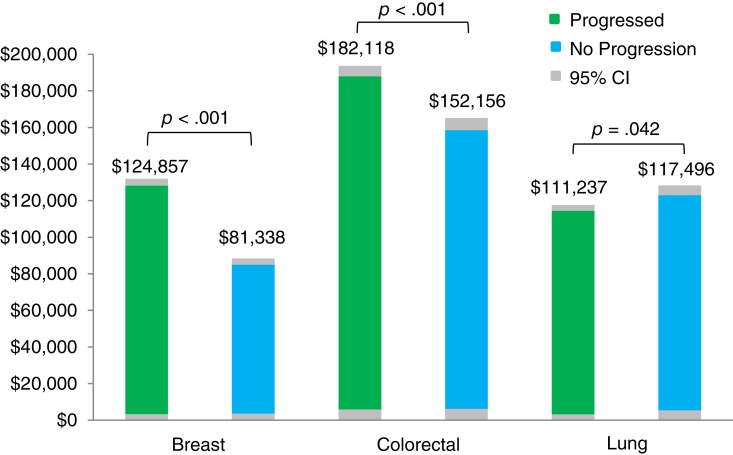
After adjustments for demographics, pretreatment comorbidity, baseline health care costs, and baseline receipt of radiation therapy, follow‐up 12‐month health care costs were 53.5% higher (p < .001) in progressors versus nonprogressors with mBC, 19.7% higher (p < .001) for progressors versus nonprogressors with mCRC, and 5.3% lower (p = .042) for progressors versus nonprogressors with mLC (Fig. 3). Effect measure modification by age was noted among patients with mCRC and mLC (supplemental online Figs. 1 and 2). In patients with mCRC, the cost differential between progressors and nonprogressors decreased as the age category increased; mCRC progressors aged no more than 64 years had higher costs compared with nonprogressors, whereas patients with mCRC aged at least 65 years had similar costs among progressors and nonprogressors. In patients with mLC, progressors aged at least 65 years had lower costs than nonprogressors, and patients aged no more than 64 years had similar costs among progressors and nonprogressors.
Figure 3.
Adjusted 12‐month health care costs among patients with metastatic breast, colorectal, and lung cancer.
Abbreviation: CI, confidence interval.
When accounting for variable follow‐up time among patients, PPPM health care costs were 1.5 to 2 times as high among those with disease progression versus those without progression in each of the three cancer types. The mean PPPM cost among mBC progressors was $13,361 compared with $6,547 among nonprogressors (p < .001). In patients with mCRC, mean PPPM costs were $19,080 among progressors versus $12,556 among nonprogressors (p < .001). Although both unadjusted and adjusted 12‐month costs among mLC progressors were not significantly different than those among nonprogressors, PPPM mean costs were significantly higher ($17,490 vs. $9,875, p < .001).
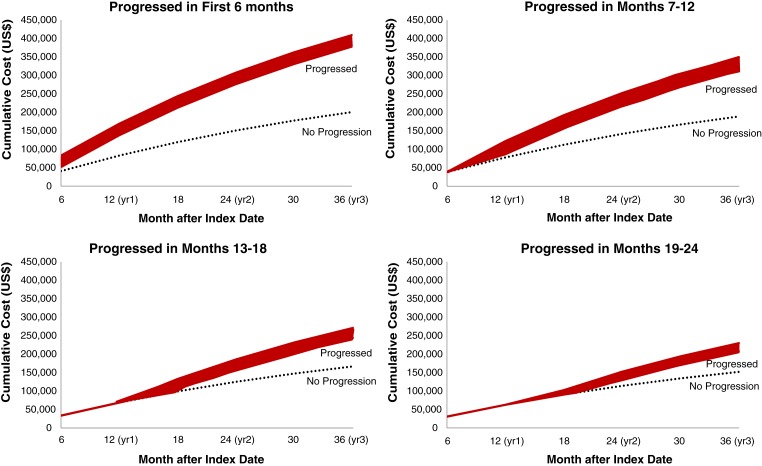
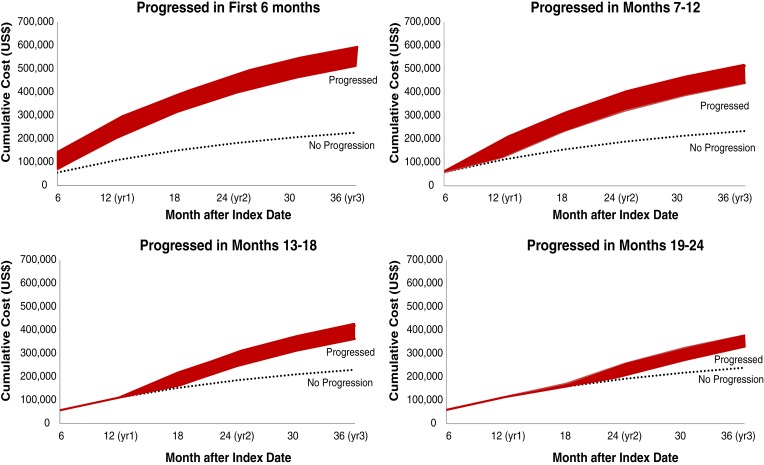
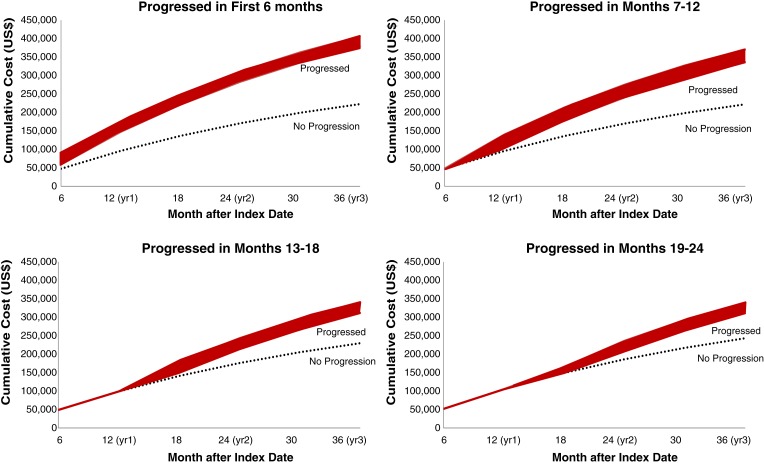
Figures 4, 5, and 6 show predicted cumulative health care costs based on month of disease progression in patients with mBC, mCRC, and mLC, respectively. A similar pattern was seen in each of the three cancer types; estimated health care costs were highest among patients who progressed earliest and decreased as disease progression was delayed.
Figure 4.
Cumulative predictive costs of breast cancer based on month of progression. Costs for progressed patients (red bar) represent a range of costs depending on whether patients progressed in the first month of the corresponding time period.
Figure 5.
Cumulative predictive costs of colorectal cancer based on month of progression. Costs for progressed patients (red bar) represent a range of costs depending on whether patients progressed in the first month of the corresponding time period.
Figure 6.
Cumulative predictive costs of breast cancer based on month of progression. Costs for progressed patients (red bar) represent a range of costs depending on whether patients progressed in the first month of the corresponding time period.
Discussion
This study of 5,709 patients with mBC, 3,707 patients with mCRC, and 5,201 patients with mLC quantifies the economic benefits associated with delayed progression of solid tumor cancers. For patients with either mBC or mCRC, both unadjusted and adjusted health care costs were significantly higher among patients with evidence of disease progression. PPPM costs were 1.5 to 2 times as high for progressors compared with nonprogressors with mBC, mCRC, and mLC, and importantly, the longer progression was delayed, the lower the overall health care costs.
mLC had the highest proportion of patients progressing within 12 months among the three cancer types (80.3%), but more than half of patients with mBC (56.8%) and mCRC (58.1%) also progressed. This speaks to the high unmet need that remains in mLC and, more broadly, metastatic solid tumor malignancies.
Disease progression had a significant impact on mBC costs. Compared with nonprogressors, progressors with mBC had 1.6 times higher health care costs during the 12‐month follow‐up period. In a study of patients with stage II and II BC, costs were 6.4 times higher in the period after progression compared with the preprogression period over 12 months [13]. Ray et al. concluded that longer follow‐up was associated with higher cumulative costs but lower monthly costs; thus, delaying progression may help slow the rate of increasing long‐term costs in patients with mBC [14].
The largest cost drivers in patients with mBC in our study were outpatient hospital visits and office visits, representing almost 80% of total health care costs. In a study of mBC patients by Vera‐Llonch et al, outpatient services (including office visits) were also the major cost driver, representing 29% of health care costs [15]. The Vera‐Llonch study did not include the cost of chemotherapy (or nonchemotherapy) medications in the total costs for outpatient visits, which may partially explain the lower overall proportion of costs attributable to outpatient services. The study noted that chemotherapy costs represented 25% of total costs and that 83% were administered during an outpatient or office visit [15]. The proportion of health care costs because of systemic antineoplastic agents was similar in our study (21%) and the Vera‐Llonch study [15]; however, it was much higher than that from the previously reported range of 3.3% to 15% [10], [16]. These studies, however, were conducted in the years 2000 and 2004 before newer and more expensive therapeutic agents had become available, thus potentially explaining the discrepant findings.
Progressors with mCRC incurred 1.2 times higher costs than nonprogressors over 12 months. In a previous study, 12‐month costs in CRC patients significantly increased by line of therapy from $70,500 for first‐line, $100,100 for second‐line, and up to $152,900 for third‐line therapy and greater [17].
The major cost drivers in patients with mCRC were hospital outpatient and office visits, accounting for a combined total of 73% and 78% of total costs among progressors and nonprogressors, respectively. Seal et al. reported that the major cost driver in patients with mCRC was outpatient visits, which included surgery and office visits, hospital outpatient visits, and ER visits, representing 42% of 12‐month total costs [17]. Two additional studies in patients with mCRC reported the major cost drivers to be inpatient hospitalizations, followed closely by outpatient care that included visits for chemotherapy administration [18], [19]. It has been suggested that the disease phase of mCRC may affect what drives costs; in one study, inpatient stays were the major cost driver at time of diagnosis and at end of life, whereas outpatient costs dominated the period of time during which patients received therapy [20]. The proportions of costs because of chemotherapy (13%) and biologic therapy (15%) in our study were similar to percentages previously reported (16% and 18%, respectively) [20].
Total costs over 12 months for patients with mLC did not differ significantly based on whether or not patients experienced disease progression. This likely reflects the high mortality rate in mLC; more than half of the patients with mLC with progression died over the course of 12 months and thus were no longer accruing costs. Providing further support for this assumption, PPPM costs accounting for mortality and variable follow‐up were almost twice as high in mLC progressors as in nonprogressors. Hospital outpatient visits were the major cost driver, representing 35% and 43% of total health care costs among progressors and nonprogressors, respectively. Vera‐Llonch et al. also reported the major cost driver to be outpatient services, accounting for 34% of total health care costs among patients with mLC [21]. In a separate study of patients with mLC, costs by site of care were dependent upon progression status. The major cost driver was inpatient visits for patients who experienced progression and outpatient services for nonprogressing patients [8]. Although they were not the major cost driver in our study, inpatient costs were more than double in progressors compared with nonprogressors.
The effect of age on 12‐month health care costs differed between progressors and nonprogressors in patients with mCRC and mLC, with the oldest patients who progressed (aged at least 75 years) incurring approximately half of the youngest progressors (aged 18–44 years). This is likely due to the more aggressive and expensive treatment options available to younger patients, as opposed to more conservative or palliative care in elderly patients with more comorbidity who may not tolerate intensified regimens [22], [23].
These study results suggest that delaying progression may result in substantially lower costs in each of these three metastatic solid tumor malignancies. The difference in cumulative predictive costs over the course of 3 years among patients who progressed versus those with no progression varied markedly by time period transpired prior to progression. Patients with mBC who progressed in the first month had costs 104.1% higher than nonprogressors, compared with 36.4% higher costs in those who progressed in month 24 versus nonprogressors. Patients with mCRC who progressed in the first month had 158.8% higher costs than nonprogressors, compared with 38.0% higher costs in patients who progressed in month 24 versus nonprogressors. Similarly, patients with mLC who progressed in the first month had costs 82.1% higher than nonprogressors, compared with 28.0% higher costs in patients who progressed in month 24 versus nonprogressors. A possible explanation for the higher costs in early versus late progressors is that patients who experience early relapse may be more likely to receive intensified therapies, targeted therapies, or require more lines of therapy, thus incurring higher costs of treatment. Early progression may also represent more intractable or severe disease compared with progression in patients who appear to have responded to early therapy.
As the transition to value‐based care models continues, the results of this study can be used to improve cost projections for mBC, mCRC, and mLC by considering both the cost of therapy and the subsequent costs of progression. Value‐based models may be able to offer different reimbursement rates depending on patients’ course of disease. New treatments that delay disease progression in solid tumor cancers could have a significant benefit on the economic burden of cancer care: the high cost of treatment may be partially or completely offset by the cost savings of delaying progression.
Limitations
Claims data provide a powerful method to examine costs in a real‐world setting, offering a large number of patients with diverse medical histories; however, several limitations inherent to claims‐based analyses should be considered when interpreting results of this study. The date of disease progression is not captured in the claims data, and the algorithm used to identify progression may have misclassified patients. Additionally, a change in treatment regimen could have been due to reasons other than disease progression, such as intolerance. Treatment received by patients enrolled in clinical trials may not have generated insurance claims and therefore were not included in the analyses. Certain clinical parameters that could have affected study outcomes, such as disease severity, are not readily available in claims data. Given the long duration of the study period, common treatment practice may have changed over the course of the study and may differ from current treatment practice. Lastly, data from this study come from a managed care population, and results may not be representative of all patients.
Conclusion
Progression of mBC, mCRC, and mLC was associated with higher health care costs over a 12‐month period. Compared with progression early in the disease course, cancer progression later in the course of the disease was associated with substantially lower health care costs in patients with each of the three cancer types. New treatments that delay disease progression in patients with metastatic solid tumor cancer may reduce the economic burden of metastatic solid tumors.
See http://www.TheOncologist.com for supplemental material available online.
Acknowledgments
Medical writing services were provided by Deja Scott‐Shemon, an employee of Optum.
Editor's Note: See the companion article, “Cost of Disease Progression in Patients with Chronic Lymphocytic Leukemia, Acute Myeloid Leukemia, and Non‐Hodgkin's Lymphoma,” by Carolina Reyes, Nicole M. Engel‐Nitz, Stacey DaCosta Byfield et al., on page 1219 of this issue.
Author Contributions
Conception/design: Carolina Reyes, Nicole M. Engel‐Nitz, Stacey DaCosta Byfield, Arliene Ravelo, Sarika Ogale, May Chen, Matthew Matasar
Provision of study material or patients: Nicole M. Engel‐Nitz, Stacey DaCosta Byfield, Tim Bancroft, Amy Anderson
Collection and/or assembly of data: Nicole M. Engel‐Nitz, Stacey DaCosta Byfield, Tim Bancroft, Amy Anderson
Data analysis and interpretation: Carolina Reyes, Nicole M. Engel‐Nitz, Stacey DaCosta Byfield, Arliene Ravelo, Sarika Ogale, Tim Bancroft, Amy Anderson, May Chen, Matthew Matasar
Manuscript writing: Carolina Reyes, Nicole M. Engel‐Nitz, Stacey DaCosta Byfield, Arliene Ravelo, Sarika Ogale, Tim Bancroft, Amy Anderson, May Chen, Matthew Matasar
Final approval of manuscript: Carolina Reyes, Nicole M. Engel‐Nitz, Stacey DaCosta Byfield, Arliene Ravelo, Sarika Ogale, Tim Bancroft, Amy Anderson, May Chen, Matthew Matasar
Disclosures
Carolina Reyes: Genentech (E), Roche (OI); Nicole M. Engel‐Nitz: Optum (E); Stacey DaCosta Byfield: Optum (E); Arliene Ravelo: Genentech (E), Roche (OI); Sarika Ogale: Genentech (E), Roche (OI); Tim Bancroft: Optum (E); Amy Anderson: Optum (E); Matthew Matasar: Genentech (RF, H). The other author indicated no financial relationships.
(C/A) Consulting/advisory relationship; (RF) Research funding; (E) Employment; (ET) Expert testimony; (H) Honoraria received; (OI) Ownership interests; (IP) Intellectual property rights/inventor/patent holder; (SAB) Scientific advisory board
References
- 1.Warren JL, Mariotto AB, Meekins A et al. Current and future utilization of services from medical oncologists. J Clin Oncol 2008;26:3242–3247. [DOI] [PubMed] [Google Scholar]
- 2.National Cancer Institute . Surveillance, Epidemiology, and End Results Program. Cancer Stat Facts. Available at https://seer.cancer.gov/statfacts/. Accessed July 19, 2017.
- 3.Weir HK, Thompson TD, Soman A et al. The past, present, and future of cancer incidence in the United States: 1975 through 2020. Cancer 2015;121:1827–1837. [DOI] [PMC free article] [PubMed] [Google Scholar]
- 4.Newcomer LN. Innovative payment models and measurement for cancer therapy. J Oncol Pract 2014;10:187–189. [DOI] [PubMed] [Google Scholar]
- 5.Mariotto AB, Yabroff KR, Shao Y et al. Projections of the cost of cancer care in the United States: 2010‐2020. J Natl Cancer Inst 2011;103:117–128. [DOI] [PMC free article] [PubMed] [Google Scholar]
- 6.Newcomer LN, Gould B, Page RD et al. Changing physician incentives for affordable, quality cancer care: Results of an episode payment model. J Oncol Pract 2014;10:322–326. [DOI] [PubMed] [Google Scholar]
- 7.American Society of Clinical Oncology . Patient‐Centered Oncology Payment. Alexandria, VA: American Society of Clinical Oncology; 2015. Available at http://www.chqpr.org/downloads/ASCO_Patient‐centered_Oncology_Payment.pdf. Accessed May 10, 2017. [Google Scholar]
- 8.Fox KM, Brooks JM, Kim J. Metastatic non‐small cell lung cancer: Costs associated with disease progression. Am J Manag Care 2008;14:565–571. [PubMed] [Google Scholar]
- 9.Quan H, Li B, Couris CM et al. Updating and validating the Charlson comorbidity index and score for risk adjustment in hospital discharge abstracts using data from 6 countries. Am J Epidemiol 2011;173:676–682. [DOI] [PubMed] [Google Scholar]
- 10.Berkowitz N, Gupta S, Silberman G. Estimates of the lifetime direct costs of treatment for metastatic breast cancer. Value Health 2000;3:23–30. [DOI] [PubMed] [Google Scholar]
- 11.U.S. Department of Labor, Bureau of Labor Statistics . U.S. medical care, series SUUR0000SAM. 2012. Consumer Price Index website. Available at http://data.bls.gov/cgi-bin/surveymost?su. Accessed January 20, 2016.
- 12.Lin DY. Linear regression analysis of censored medical costs. Biostatistics 2000;1:35–47. [DOI] [PubMed] [Google Scholar]
- 13.Lamerato L, Havstad S, Gandhi S et al. Economic burden associated with breast cancer recurrence: Findings from a retrospective analysis of health system data. Cancer 2006;106:1875–1882. [DOI] [PubMed] [Google Scholar]
- 14.Ray S, Bonthapally V, McMorrow D et al. Patterns of treatment, healthcare utilization and costs by lines of therapy in metastatic breast cancer in a large insured us population. J Comp Eff Res 2013;2:195–206. [DOI] [PubMed] [Google Scholar]
- 15.Vera‐Llonch M, Weycker D, Glass A et al. Healthcare costs in women with metastatic breast cancer receiving chemotherapy as their principal treatment modality. BMC Cancer 2011;11:250. [DOI] [PMC free article] [PubMed] [Google Scholar]
- 16.Rao S, Kubisiak J, Gilden D. Cost of illness associated with metastatic breast cancer. Breast Cancer Res Treat 2004;83:25–32. [DOI] [PubMed] [Google Scholar]
- 17.Seal BS, Sullivan SD, Ramsey S et al. Medical costs associated with use of systemic therapy in adults with colorectal cancer. J Manag Care Pharm 2013;19:461–467. [DOI] [PMC free article] [PubMed] [Google Scholar]
- 18.Paramore LC, Thomas SK, Knopf KB et al. Estimating costs of care for patients with newly diagnosed metastatic colorectal cancer. Clin Colorectal Cancer 2006;6:52–58. [DOI] [PubMed] [Google Scholar]
- 19.Song X, Zhao Z, Barber B et al. Cost of illness in patients with metastatic colorectal cancer. J Med Econ 2011;14:1–9. [DOI] [PubMed] [Google Scholar]
- 20.Song X, Zhao Z, Barber B et al. Characterizing medical care by disease phase in metastatic colorectal cancer. J Oncol Pract 2011;7(suppl 3):25s–30s. [DOI] [PMC free article] [PubMed] [Google Scholar]
- 21.Vera‐Llonch M, Weycker D, Glass A et al. Healthcare costs in patients with metastatic lung cancer receiving chemotherapy. BMC Health Serv Res 2011;11:305. [DOI] [PMC free article] [PubMed] [Google Scholar]
- 22.Berger NA, Savvides P, Koroukian SM et al. Cancer in the elderly. Trans Am Clin Climatol Assoc 2006;117:147–155; discussion 155–146. [PMC free article] [PubMed] [Google Scholar]
- 23.Hurria A, Lichtman SM. Pharmacokinetics of chemotherapy in the older patient. Cancer Control 2007;14:32–43. [DOI] [PubMed] [Google Scholar]


