Purpose
The relaxivities of 3 macrocyclic gadolinium-based contrast agents (GBCAs) were determined in human plasma and blood under standardized and clinically relevant laboratory conditions.
Methods
The T1 relaxivity, r1, was determined in human plasma at 1.5, 3, and 7 T, and in human blood at 3 T at 37°C in phantoms containing 4 different concentrations of the macrocyclic GBCAs gadobutrol, gadoteridol, and gadoterate. An inversion recovery turbo spin echo sequence was used to generate images with several inversion times. The T1-times were obtained by fitting the signal intensities to the signal equation. r1 was obtained by a 1/y-weighted regression of the T1-rates over the concentration of the GBCAs.
Results
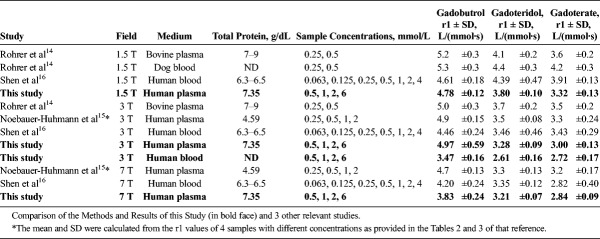
For gadobutrol, the obtained r1 [L/(mmol·s)] in human plasma at 1.5 T, 3 T, and 7 T, and in human blood at 3 T was 4.78 ± 0.12, 4.97 ± 0.59, 3.83 ± 0.24, and 3.47 ± 0.16. For gadoteridol, r1 was 3.80 ± 0.10, 3.28 ± 0.09, 3.21 ± 0.07, and 2.61 ± 0.16, and for gadoterate, 3.32 ± 0.13, 3.00 ± 0.13, 2.84 ± 0.09, and 2.72 ± 0.17.
Conclusions
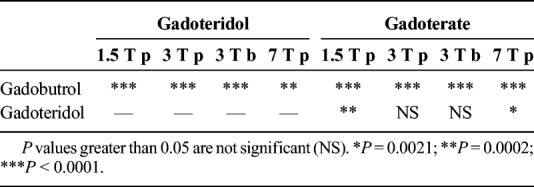
The relaxivity of gadobutrol is significantly higher than that of gadoteridol and gadoterate at all magnetic field strengths and in plasma as well as in blood, whereas that of gadoteridol was higher than gadoterate only in plasma at 1.5 and 7 T. This is in accordance with results from 3 previous studies obtained in different media.
Key Words: gadolinium-based contrast agents, GBCA, macrocyclic complexes, relaxivity, T1 relaxation times
Gadolinium-based contrast agents (GBCAs) for magnetic resonance (MR) imaging are in clinical use since 1988. Although they are considered having a high safety margin,1,2 concerns about their tolerability were raised recently.3 The observation of increased signal intensity (SI) on nonenhanced images in focal brain areas after repeated administration of GBCAs in patients with normal kidney function triggered intense research to better understand the underlying mechanisms. In the majority of clinical studies, this was observed only after the administration of linear GBCAs and not after macrocyclic agents.4–6 This finding was supported in many preclinical studies mainly in rats but also in pigs in several laboratories.7–9 Some preclinical studies addressed the chemical species of Gd that might be responsible for the observed hyperintensity in the dentate nucleus and found only traces of soluble species, most likely the intact GBCA for the macrocyclic agents but observed Gd-containing macromolecular structures and insoluble deposits after the administration of linear GBCAs.10–12
By the end of 2017, the Commission of the European Community decided to suspend the linear GBCAs from the market with the exception of gadobenate and gadoxetate for liver imaging.13 In Europe, only the 3 macrocyclic GBCAs gadobutrol, gadoteridol, and gadoterate can be used in all approved indications.
The efficacy of GBCAs to generate contrast is based on their local tissue concentration and on their relaxivities. Influences from potential binding to plasma proteins can be neglected for these macrocyclic GBCAs (according to their package inserts).
Several studies have been conducted in the past decades to compare the relaxivities of the 3 macrocyclic GBCAs in vitro mimicking the in vivo situation as closely as possible.14–19 The majority of the studies used MR imaging to measure T1 times, but nuclear magnetic relaxation dispersion, NMRD, a spectroscopic method, was also used, for instance by the group from Mons.17–19 However, the experimental settings such as the contrast agents used, solvents (most often water, not physiological media), or field strength in these studies were not always comparable with the current study, and values for T1 relaxivity were not always reported. The major difference between all studies was the medium in which the GBCAs were dissolved. So far, human and bovine blood plasma was used as well as human and canine blood. In addition, not all relevant magnetic field strengths were used in all studies.
The purpose of the present study was to reassess the relaxivities of the macrocyclic GBCAs under standardized and clinically relevant conditions.
MATERIALS AND METHODS
Contrast Agents
The following contrast agents were used: gadobutrol (Gadovist, Gadavist; Bayer Vital GmbH, Leverkusen, Germany), gadoteridol (Prohance; Bracco Imaging GmbH, Konstanz, Germany), and gadoterate (Dotarem; Guerbet GmbH, Sulzbach, Germany).
Media and Sample Preparation
Blood Samples
Heparinized human blood was obtained from one healthy volunteer after informed consent from the Medical University of Vienna, Austria. It was stored at +4°C, and all experiments were performed within 48 hours after taking the blood sample. To spike the blood with different concentrations of the 3 GBCAs, 1.9 mL of the pooled blood was mixed with 0.1 mL of an appropriate dilution of the GBCA in saline to obtain 0.5, 1, 2, and 6 mmol Gd/L in the final samples. This resulted in a 5% dilution of the blood.
Plasma Samples
Human blood plasma was obtained from heparinized blood from 3 male and 3 female healthy volunteers after informed consent collected at the Clinical Pharmacology Department of Bayer AG, Berlin, Germany. It was stored frozen at −20°C. Equal volumes from the volunteers were pooled just before the preparation of the samples. The protein content of the plasma was 7.35 g/dL. To spike the plasma with different concentrations of the 3 contrast agents, 5.7 mL of the pooled plasma was mixed with 0.3 mL of an appropriate dilution of the contrast agents to obtain 0.5, 1, 2, and 6 mmol Gd/L in the final samples. This resulted in a 5% dilution of the plasma. The plasma samples were split in 3 identical sets of 1.8 mL each and were stored at −20°C until the experiment took place. One set of samples was used for each measurement at one of the different field strength.
The Gd concentration of the individual samples were measured using inductively coupled optical emission spectrometry (ICP-OES, IRIS Advantage, Thermo), calibrated with dilutions of certified standard solutions. The concentrations deviated less than ±3% from the nominal value.
Relaxation Time Measurements
The measurements were performed in tightly closed plastic tubes that contained 1.8 mL of the respective samples. During the measurements, the tubes were kept at 37°C ± 1°C using a sample holder connected to a heat circulation with silicon oil. To be able to mix the samples between measurements without changing its position in the magnet, which was deemed necessary for the blood samples to avoid sedimentation, the whole sample holder could be manually rotated along its horizontal axis.
A 1.5 T Magnetom Avanto, a 3 T Magnetom Trio, and a 7 T whole-body investigational MR scanner (all Siemens Healthineers, Erlangen, Germany) were used. For the 1.5 T scanner, a matrix designed coil was used; for 3 T, a 16-channel head array coil was used (Invivo, Gainesville, FL); and for 7 T, a 32-channel head array coil (Siemens) was used.
The relaxation times were measured by imaging of groups of samples simultaneously using an inversion recovery turbo spin echo (IR-TSE) pulse sequences with variable inversion times, which allowed to record the relaxation curves in the range from at least 20% to 80% of the longitudinal magnetization. Inversion times of 0, 23, 50, 100, 250, 375, 500, 750, and 1500 milliseconds were used for all samples. The obtained T1-times were used for the final relaxivity calculation.
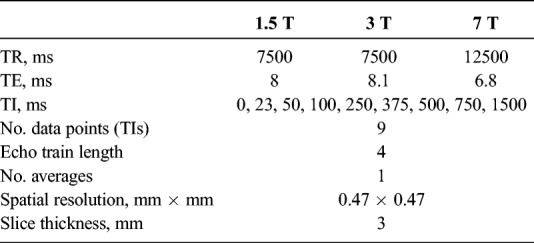
The other sequence parameters were set to identical values for the 3 different field strengths with only slight variations in echo time (TE) and repetition time (TR) (Table 1). The selected TRs were sufficiently long to allow full relaxation of the spins before the next excitation occurred (>5 × longest expected T1 time, which was approximately 0.55 second). The echo time was set as short as possible to fulfill the requirement TE << T2, resulting in slight variations between 6.1 milliseconds and 8.1 milliseconds due to sequence specific limitations.
TABLE 1.
Sequence Parameters of the IR-TSE Sequence, Used for the Determination of the Relaxivities
In all images, a rectangular region of interest (ROI) of constant size was placed in the center of the cross-sectional view of each tube to measure its SI avoiding artifacts at the borders. The ROI comprised 121 pixel per sample (Fig. 1).
FIGURE 1.
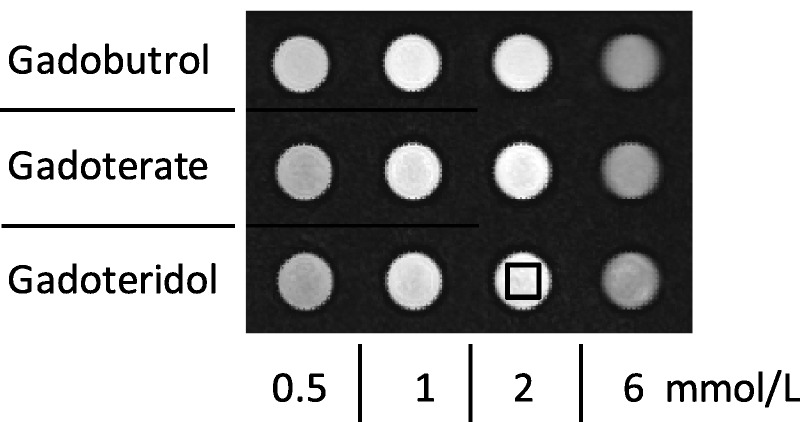
IR-TSE images with inversion time (TI) of 750 milliseconds at 3 T of a series of blood samples, illustrating the determination of the SI in the samples. The black box indicates the ROI that was used in each sample to determine the SI in the center of each vial.
Data Evaluation
T1 Time
For each sample, the T1 time was obtained by fitting the measured SI using the different TIs to the signal equation of the IR-TSE sequence,20 taking into account that the SI is always a positive value:
Formula.

where SI(TI) is the measured SI of the selected ROI at the respective inversion time TI, and SIinf the SI at full relaxation. TR and TE are the respective repetition and echo times of the IR-TSE sequence. TR was selected sufficiently long, so that TR >> T1, and the term  becomes very small and can be neglected. The term
  is essentially a constant scaling term for each sample with no influence on the shape of the curve, which is governed by T1 and becomes close to 1 with TE << T2. Under these conditions, Equation 1 can be reduced to Equation 2, which was used for the fitting of the data points.
Formula.

SIinf and T1 were allowed to vary during the fitting procedure, which provided the T1 time of the respective sample.
Relaxivity
T1-relaxivity (r1) is by definition the slope of the linear correlation between relaxation rate (1/T1) and the concentration of the GBCA, CGBCA:
Formula.

where T1 is the measured T1 time of the solution containing the respective GBCA, and T10 is the T1-time of the blank matrix (plasma or whole blood). The relaxivity was obtained by fitting the measured T1-rates to Equation 3 using a 1/y-weighted linear regression. The weighting was used because unweighted regression forces the fit through the data point of the highest concentration. This data point, however, is measured with the least accuracy, because the fit to Equation 2 is based on less TI-times than for the longer T1 times, due to its very short T1 time. The 1/y-weighted regression applies the same weight to all measured T1-times and is therefore a better representation of all measurements. T10 was not measured due to its very long T1-time, which did not fit to the used TI times. The fitting of the linear correlation between 1/T1 and CGBCA included T10 as a variable and was performed in a way that the same T10 was obtained for all 3 GBCAs.14 This is appropriate because all samples were prepared from the same medium. All calculations and data fitting were performed using Microsoft Excel and Prism 7.0 (GraphPad Software Inc, La Jolla, CA).
Statistical Tests
The significance of the differences between the relaxivities of 2 compounds was tested separately for each medium and field strength using the 1-way analysis of variance, followed by the Tukey test for multiple comparison between groups. The calculations were performed with Prism 7.0, using a significance level of 5%.
RESULTS
Figures 1 to 3 illustrate the steps that were necessary to determine the relaxation times in plasma and blood samples containing different concentrations of GBCAs. The SIs at the individual TI times were always in good agreement with the fitted relaxation curve. As expected from the full signal Equation 1 of the IR-TSE sequence, SIinf dropped with increasing GBCA concentration due to the faster T2 relaxation. The linear relationship between the concentration of the GBCA and the resulting relaxation rates was used to derive the T1-relaxivity of each macrocyclic GBCA, which are presented in Table 2.
FIGURE 3.
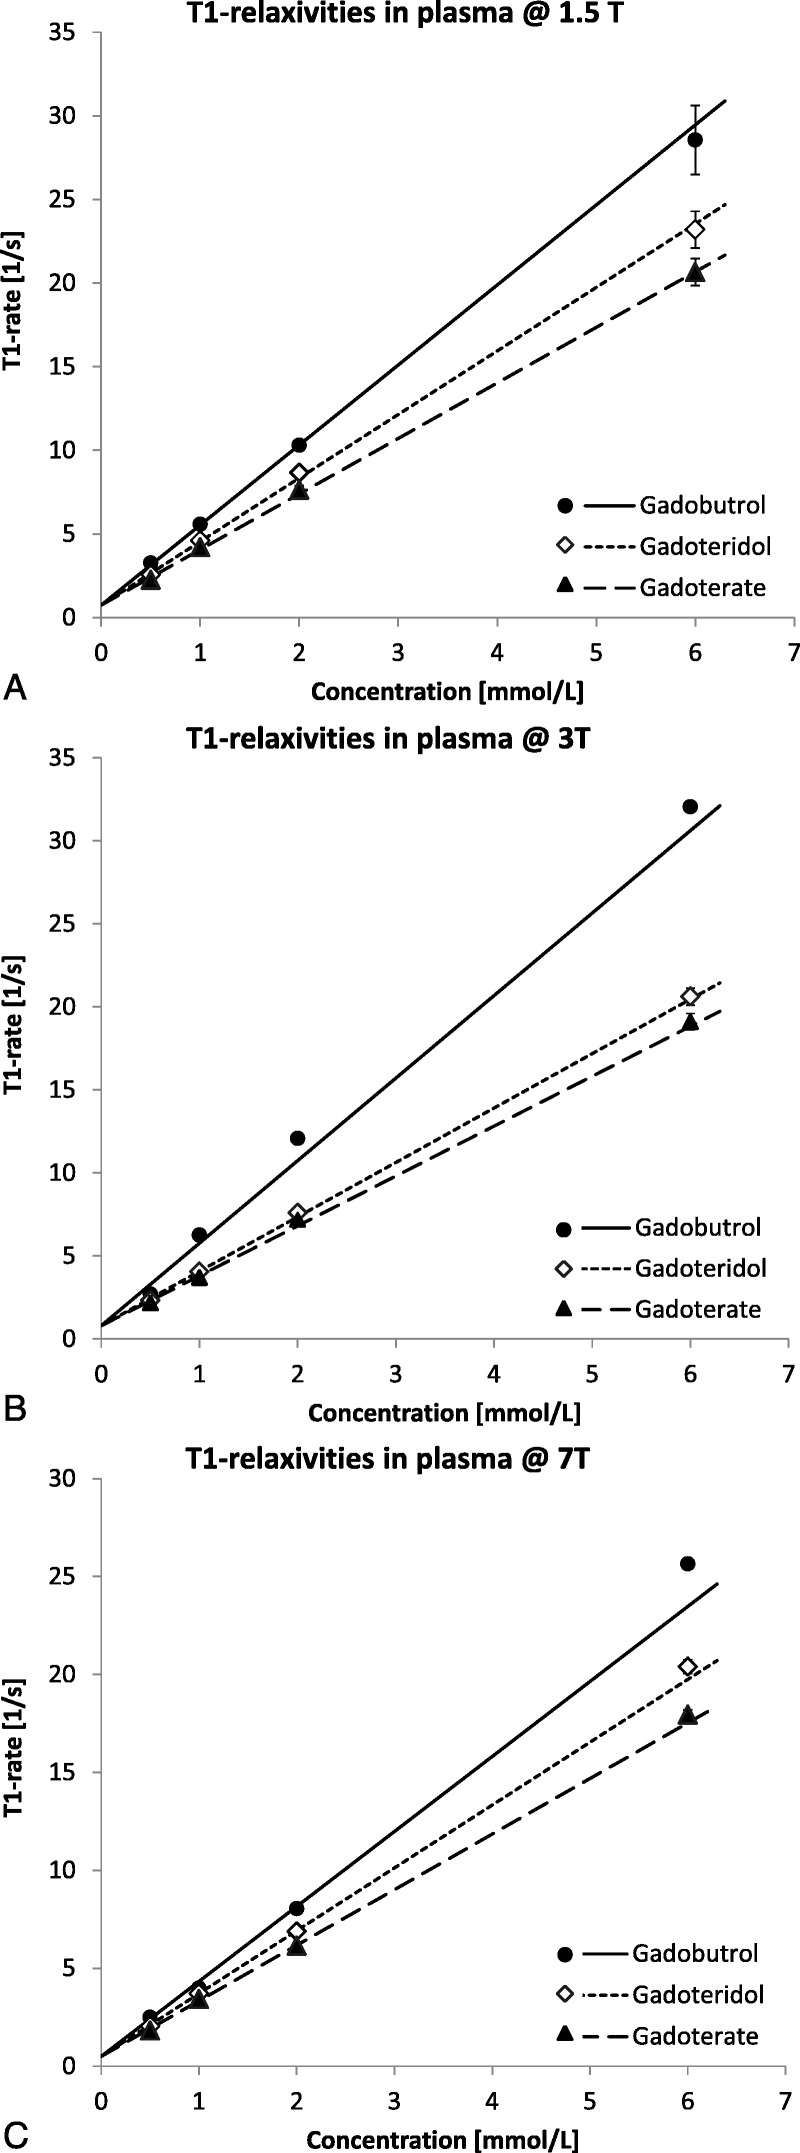
Linear relationship between the GBCA concentration in human blood plasma and the relaxation rates of the respective samples at 1.5, 3, and 7 T. The lines represent the fit of the data points to Equation 2 using 1/y-weighted linear regression that was forced through a joint value for T10 at each field strength. The error bars represent the standard error of the fitted T1 rates. In most cases, they are smaller than the symbols. The slopes yield the respective T1-relaxivities.
TABLE 2.
T1-Relaxivities, r1, of the Macrocyclic GBCAs
FIGURE 2.
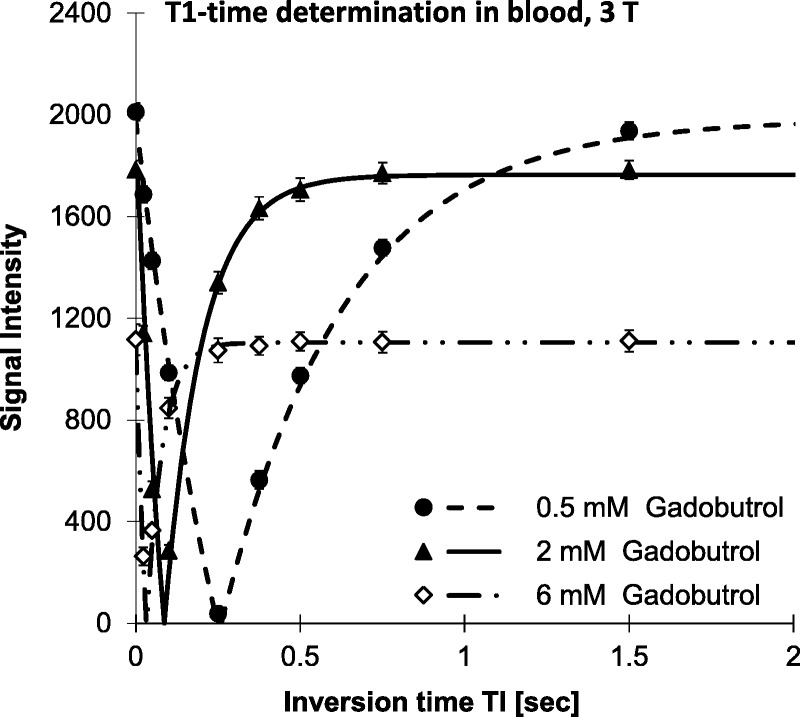
Plot of the relaxation curve of the signal intensities at 3 T in blood samples with different concentrations of gadobutrol using different inversion times (TI). The lines represent the fit of the measured signal intensities (SI) to Equation 1. The error bars represent the scatter of the SI within each ROI. This yields the T1-time of the respective sample.
DISCUSSION
T1 relaxivity is a measure of the efficacy of a contrast agent to shorten the T1 time of water protons in its surrounding. The higher the relaxivity, the lower the concentration of the agent that is required to achieve the same T1 shortening, which in turn results in a higher SI in the MR image. Because all 3 macrocyclic GBCAs share a very similar pharmacokinetic profile with passive distribution in the extracellular volume of the body and fast renal excretion, driven by glomerular filtration,21–23 the tissue concentration during steady state depends almost exclusively on the injected dose and the time after injection. When imaging the first pass of a fast bolus injection in angiography, the local concentration in the vessel may also strongly depend on the concentration of the administered contrast agent.24
Very early in the development of the first GBCAs, it had been demonstrated that relaxivity depends on a large number of parameters some of which are given by the body of the patient (temperature, viscosity of the tissue environment) or by the used imaging scanner (magnetic field strength), but most of them are defined by the GBCA itself.25
The major prerequisite for effective T1 shortening by a GBCA is the binding of water molecules to the Gd3+ ion in its first coordination sphere, their fast relaxation, and subsequent fast exchange with the bulk water.26 The structure of the ligand, occupying most of the first coordination sphere of the Gd3+ ion and thus shielding it from the surrounding matrix, strongly influences this process and thus the relaxivity. This is described in detail in the Solomon-Bloembergen-Morgan (SBM) theory.27 Some of the relevant parameters influencing relaxivity are, for example, the number (q) of water molecules bound in the first coordination sphere of the Gd3+ ion, the distance between the Gd3+ ion and the water protons (rGdH), and the residence lifetime of the bound water at the Gd3+ ion (τm). Also the number of water molecules bound in a second or outer hydration sphere28,29 has an influence on the relaxivity as well as the symmetry and molecular weight of the ligand and its tendency to bind to proteins in vivo and thus slowing down the local rotational motion. All these parameters were addressed in the past by many research groups to optimize the longitudinal relaxivity of gadolinium complexes.30,31
During this optimization process to design clinically suitable contrast agents, other aspects such as good water solubility, tolerability, and complex stability of the GBCA had to be taken into consideration.31 Therefore, for example, the number of inner sphere water molecules was in general limited to one. Due to their low dissociation rates (kinetic inertness), the investigated macrocyclic GBCAs all share a high complex stability under physiological conditions,32 which clearly differentiates them from the linear GBCAs.
The relaxivities of the macrocyclic GBCAs have been reported in the past in several in vitro studies (Table 2 and Fig. 4). The data from the Mons group17–19 were not included, although these studies also investigated the relaxation behavior of several GBCAs at different field strengths. They focused on the field dependence of the relaxivity and on individual SBM parameters and were performed with GBCAs dissolved in water or human serum albumin solutions. Nuclear magnetic relaxation dispersion, a spectroscopic method, required the fit of the measured data to the SBM equations, using several not very accurately known parameters. This introduces additional scatter in the derived r1 values. In addition, these data were obtained with one single concentration and did not provide any data on the precision of the measurement, and specific r1 values were not reported in all studies.
FIGURE 4.
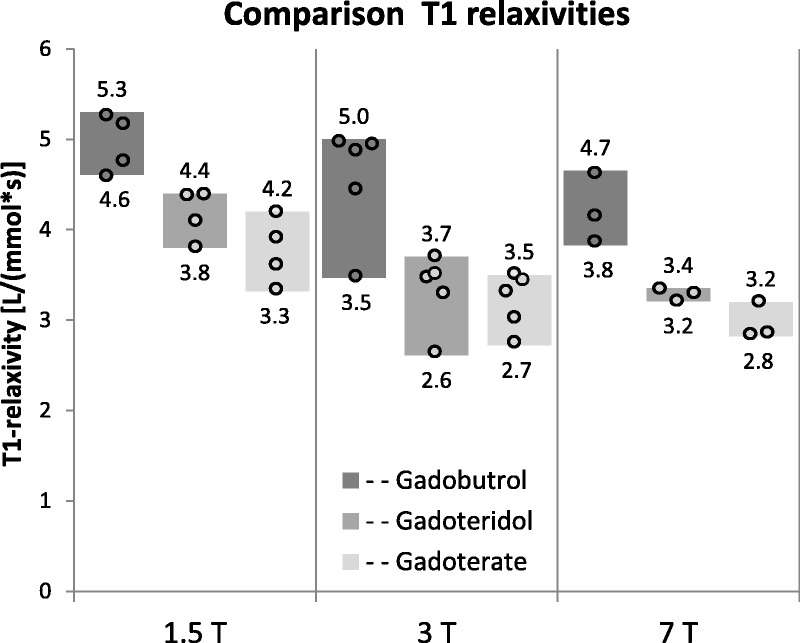
Plot of the T1-relaxivities of the 3 macrocyclic GBCAs at 1.5 T, 3 T, and 7 T obtained in this study and previous studies14–16 listed in Table 2. The bars represent the ranges between the lowest and highest reported value for each GBCA. Of note are the different media from different species that were used in the different studies.
The relaxivities of the 3 GBCAs decrease with increasing field strength by approximately −15% to −20% from 1.5 to 7 T. This fact is well known from numerous nuclear magnetic relaxation dispersion studies over a wide magnetic field range17–19,33 and was reproduced in this study, with one exception. We observed a slight increase of the relaxivity of gadobutrol from 1.5 to 3 T in human plasma, which was probably due to an unusual large uncertainty (±12%) in the measurement of r1 at 3 T. It is also known that the native T1 time of human tissue increases with increasing magnetic field.34 Taking both effects together, the efficiency of the GBCAs to shorten the T1-time and to create image contrast, however, remains almost unaffected by the magnetic field strength or even increases with increasing field.35,36
The results for each individual GBCA cannot be compared directly between all studies, because different media such as plasma or whole blood from humans but also from different animal species were used. Together with the general variability of such measurements, this resulted in slightly different relaxivities reported from the different laboratories. However, the species difference is the least serious one, because the macrocyclic agents do not interact with plasma proteins, which would be the major source for a species-dependence of the relaxivity.37 Differences in the viscosity of the medium result in longer rotational correlation times τR of the dissolved GBCAs. Therefore, the viscosity that is influenced by the lipid and protein concentration of the used plasma or the hematocrit of blood may influence the relaxivities, also between media from different human sources. Shen et al16 reported the total protein concentration (6.3–6.5 g/dL) and hematocrit (45 to 50%) of the used human blood. Noebauer-Huhmann et al15 reported a total protein concentration of 4.59 g/dL and Rohrer et al14 of 7 to 9 g/dL of the used plasma. In the current study, the used human plasma was obtained from 3 male and 3 female volunteers to obtain a representative plasma pool, which had a total protein concentration of 7.35 g/dL. The hematocrit and protein concentration of the human blood was not measured, and it was obtained from a single healthy volunteer that may have resulted in a nonrepresentative medium, which is certainly a limitation. The different studies used solvents with a wide range of protein content and may also have varied in other components, which is often the case in biological specimen. This is most likely one reason for the slight differences in the reported r1 values for each individual GBCA.
When comparing the results of the different studies, their precision, expressed as the standard deviation of the relaxivities, should be considered. Rohrer et al,14 who used only 2 different concentrations, reported the relaxivity in general with ±5% to ±7% relative standard deviation, with no major differences between the media or field strengths. Noebauer-Huhmann et al,15 who used 4 different concentrations, reported only the mean relaxivities but did not report standard deviations. They can be calculated from the individual relaxivities of the investigated samples presented in Tables 2 and 3 of that article. These standard deviations are shown in Table 2. The precision was in the range between ±2% and ±7%. Shen et al,16 who used 7 different concentrations, reported standard deviations from ±3% to ±14%. The 2 highest deviations were ±13% for gadoteridol at 3 T and ±14% for gadoterate at 7 T. The other measurements were below ±11%. In the present study, the relative standard deviations ranged from ±2% to ±12% with the highest deviation obtained for gadobutrol in human plasma at 3 T. In all other samples, the precision was better than ±7%. The 4 studies provided data with comparable precision.
TABLE 3.
Statistical Analysis of the Differences of the Relaxivities of the Macrocyclic GBCAs at All Field Strengths and Media (p = Human Plasma, b = Human Blood) Obtained in This Study
Overall and keeping all the addressed limitations in mind, the previous and the present studies provide a relatively narrow range for the T1 relaxivities of each of the 3 macrocyclic GBCAs at 3 different field strengths.
Although very similar in their chemical structures, significant differences in the relaxivities of the macrocyclic GBCAs were observed. Gadobutrol showed the highest T1 relaxivity, irrespective of the medium and field strengths, and this was statistically significant in the present study, whereas gadoteridol and gadoterate had overlapping ranges with a slightly higher relaxivity of gadoteridol when comparing the data in each individual study. Because all 3 GBCAs carry a single water molecule bound to gadolinium (q = 1), have very similar molecular weights and thus rotational correlation times (τR), and have very similar water exchange correlation times (τm),18 which are the parameters having the strongest influence on the relaxivity, the differences in relaxivity may be explained by differences in the second sphere water. The increasing number of free hydroxyl groups, not participating in the complexation of the Gd3+ ion, from gadoterate (0), gadoteridol (0) to gadobutrol (2) might provide a better environment to retain more water molecules through hydrogen bonding in the hydration shell in close proximity to the complexed gadolinium ion.28,29 Another possible explanation for the increased relaxivity of gadobutrol can be found in an intramolecular hydrogen bonding of the inner sphere water molecule with one of the hydroxyl oxygens in the butrol side chain. Such hydrogen bonding, which would not be possible for gadoterate and gadoteridol, could reduce the rotational motion of the inner sphere water molecule. This effect has been observed in similar Gd complexes and has led to an increase in relaxivity of a similar order of magnitude as it was observed for gadobutrol, when compared with gadoterate and gadoteridol in this study.38
Footnotes
Conflicts of interest and sources of funding: The authors P.S., I.M.N.-H., and S.T. declare no conflicts of interest. The authors M.R., T.F., G.J., J.E. and H.P. are employees of Bayer AG. This study was funded by the Vienna Science and Technology Fund (WWTF-LS11-018), Austrian Science Fund (FWF KLI541-B30), and Slovak Grant Agency (APVV-15-0029). Financial support to the Medical University of Vienna was also provided by Bayer AG.
REFERENCES
- 1.Endrikat J, Vogtlaender K, Dohanish S, et al. Safety of gadobutrol: results from 42 clinical phase II to IV studies and postmarketing surveillance after 29 million applications. Invest Radiol. 2016;51:537. [DOI] [PMC free article] [PubMed] [Google Scholar]
- 2.Matsumura T, Hayakawa M, Shimada F, et al. Safety of gadopentetate dimeglumine after 120 million administrations over 25 years of clinical use. Magn Reson Med Sci. 2013;12:297–304. [DOI] [PubMed] [Google Scholar]
- 3.Runge VM. Safety of the gadolinium-based contrast agents for magnetic resonance imaging, focusing in part on their accumulation in the brain and especially the dentate nucleus. Invest Radiol. 2016;51:273–279. [DOI] [PubMed] [Google Scholar]
- 4.Runge VM. Critical questions regarding gadolinium deposition in the brain and body after injections of the gadolinium-based contrast agents, safety, and clinical recommendations in consideration of the EMA's pharmacovigilance and risk assessment committee recommendation for suspension of the marketing authorizations for 4 linear agents. Invest Radiol. 2017;52:317–323. [DOI] [PubMed] [Google Scholar]
- 5.Radbruch A, Weberling LD, Kieslich PJ, et al. Gadolinium retention in the dentate nucleus and globus pallidus is dependent on the class of contrast agent. Radiology. 2015;275:783–791. [DOI] [PubMed] [Google Scholar]
- 6.Yoo RE, Sohn CH, Kang KM, et al. Evaluation of gadolinium retention after serial administrations of a macrocyclic gadolinium-based contrast agent (gadobutrol): a single-institution experience with 189 patients. Invest Radiol. 2018;53:20–25. [DOI] [PubMed] [Google Scholar]
- 7.Rasschaert M, Emerit A, Fretellier N, et al. Gadolinium retention, brain T1 hyperintensity, and endogenous metals: a comparative study of macrocyclic versus linear gadolinium chelates in renally sensitized rats. Invest Radiol. 2018;53:328. [DOI] [PMC free article] [PubMed] [Google Scholar]
- 8.Lohrke J, Frisk AL, Frenzel T, et al. Histology and gadolinium distribution in the rodent brain after the administration of cumulative high doses of linear and macrocyclic gadolinium-based contrast agents. Invest Radiol. 2017;52:324. [DOI] [PMC free article] [PubMed] [Google Scholar]
- 9.Boyken J, Frenzel T, Lohrke J, et al. Gadolinium accumulation in the deep cerebellar nuclei and globus pallidus after exposure to linear but not macrocyclic gadolinium-based contrast agents in a retrospective pig study with high similarity to clinical conditions. Invest Radiol. 2018;53:278. [DOI] [PMC free article] [PubMed] [Google Scholar]
- 10.Robert P, Fingerhut S, Factor C, et al. One-year retention of gadolinium in the brain: comparison of gadodiamide and gadoterate meglumine in a rodent model. Radiology. 2018;288:424–433. [DOI] [PubMed] [Google Scholar]
- 11.Gianolio E, Bardini P, Arena F, et al. Gadolinium retention in the rat brain: assessment of the amounts of insoluble gadolinium-containing species and intact gadolinium complexes after repeated administration of gadolinium-based contrast agents. Radiology. 2017;285:839–849. [DOI] [PubMed] [Google Scholar]
- 12.Frenzel T, Apte C, Jost G, et al. Quantification and assessment of the chemical form of residual gadolinium in the brain after repeated administration of gadolinium-based contrast agents: comparative study in rats. Invest Radiol. 2017;52:396. [DOI] [PMC free article] [PubMed] [Google Scholar]
- 13.EMA. EMA's final opinion confirms restrictions on use of linear gadolinium agents in body scans. 2017. Available at: https://www.ema.europa.eu/documents/referral/gadolinium-article-31-referral-emas-final-opinion-confirms-restrictions-use-linear-gadolinium-agents_en.pdf. Accessed January 2019.
- 14.Rohrer M, Bauer H, Mintorovitch J, et al. Comparison of magnetic properties of MRI contrast media solutions at different magnetic field strengths. Invest Radiol. 2005;40:715–724. [DOI] [PubMed] [Google Scholar]
- 15.Noebauer-Huhmann IM, Szomolanyi P, Juras V, et al. Gadolinium-based magnetic resonance contrast agents at 7 Tesla: in vitro T1 relaxivities in human blood plasma. Invest Radiol. 2010;45:554–558. [DOI] [PubMed] [Google Scholar]
- 16.Shen Y, Goerner FL, Snyder C, et al. T1 relaxivities of gadolinium-based magnetic resonance contrast agents in human whole blood at 1.5, 3, and 7 T. Invest Radiol. 2015;50:330–338. [DOI] [PubMed] [Google Scholar]
- 17.Rinck PA, Muller RN. Field strength and dose dependence of contrast enhancement by gadolinium-based MR contrast agents. Eur Radiol. 1999;9:998–1004. [DOI] [PubMed] [Google Scholar]
- 18.Laurent S, Elst LV, Muller RN. Comparative study of the physicochemical properties of six clinical low molecular weight gadolinium contrast agents. Contrast Media Mol Imaging. 2006;1:128–137. [DOI] [PubMed] [Google Scholar]
- 19.Vander Elst L, Raynaud JS, Vives V, et al. Comparative relaxivities and efficacies of gadolinium-based commercial contrast agents. Proceedings of the 21st Annual Meeting of ISMRM. 2013;746. [Google Scholar]
- 20.Kaldoudi E, Williams SC. Relaxation time measurements in NMR imaging. Part I: longitudinal relaxation time. Concepts Magn Reson. 1993;5:217–242. [Google Scholar]
- 21.Staks T, Schuhmann-Giampieri G, Frenzel T, et al. Pharmacokinetics, dose proportionality, and tolerability of gadobutrol after single intravenous injection in healthy volunteers. Invest Radiol. 1994;29:709–715. [DOI] [PubMed] [Google Scholar]
- 22.McLachlan SJ, Eaton S, De Simone DN. Pharmacokinetic behavior of gadoteridol injection. Invest Radiol. 1992;27(suppl 1):S12–S15. [PubMed] [Google Scholar]
- 23.Le Mignon MM, Chambon C, Warrington S, et al. Gd-DOTA. Pharmacokinetics and tolerability after intravenous injection into healthy volunteers. Invest Radiol. 1990;25:933–937. [PubMed] [Google Scholar]
- 24.Kramer JH, Arnoldi E, François CJ, et al. Dynamic and static magnetic resonance angiography of the supra-aortic vessels at 3.0 T: intraindividual comparison of gadobutrol, gadobenate dimeglumine, and gadoterate meglumine at equimolar dose. Invest Radiol. 2013;48:121–128. [DOI] [PMC free article] [PubMed] [Google Scholar]
- 25.Lauffer RB. Paramagnetic metal complexes as water proton relaxation agents for NMR imaging: theory and design. Chem Rev. 1987;87:901–927. [Google Scholar]
- 26.Tóth É, Helm L, Merbach A. Relaxivity of gadolinium(III) complexes: theory and mechanism. In: Merbach A, Helm L, Tóth É, eds. The chemistry of contrast agents in medical magnetic resonance imaging. 2nd ed Hoboken, NJ: John Wiley & Sons, Ltd; 2013:25–81. [Google Scholar]
- 27.Bloembergen N, Morgan LO. Proton relaxation times in paramagnetic solutions. Effects of electron spin relaxation. J Chem Phys. 1961;34:842–850. [Google Scholar]
- 28.Botta M. Second coordination sphere water molecules and relaxivity of gadolinium (III) complexes: implications for MRI contrast agents. Eur J Inorg Chem. 2000;2000:399–407. [Google Scholar]
- 29.Jacques V, Dumas S, Sun WC, et al. High-relaxivity magnetic resonance imaging contrast agents. Part 2. Optimization of inner- and second-sphere relaxivity. Invest Radiol. 2010;45:613–624. [DOI] [PMC free article] [PubMed] [Google Scholar]
- 30.Caravan P. Strategies for increasing the sensitivity of gadolinium based MRI contrast agents. Chem Soc Rev. 2006;35:512–523. [DOI] [PubMed] [Google Scholar]
- 31.Hao D, Ai T, Goerner F, et al. MRI contrast agents: basic chemistry and safety. J Magn Reson Imaging. 2012;36:1060–1071. [DOI] [PubMed] [Google Scholar]
- 32.Frenzel T, Lengsfeld P, Schirmer H, et al. Stability of gadolinium-based magnetic resonance imaging contrast agents in human serum at 37 degrees C. Invest Radiol. 2008;43:817–828. [DOI] [PubMed] [Google Scholar]
- 33.Geraldes C, Sherry A, Brown R, III, et al. Magnetic field dependence of solvent proton relaxation rates induced by Gd3+ and Mn2+ complexes of various polyaza macrocyclic ligands: implications for NMR imaging. Magn Reson Med. 1986;3:242–250. [DOI] [PubMed] [Google Scholar]
- 34.Rinck P, Fischer H, Vander Elst L, et al. Field-cycling relaxometry: medical applications. Radiology. 1988;168:843–849. [DOI] [PubMed] [Google Scholar]
- 35.Elster AD. Field-strength dependence of gadolinium enhancement: theory and implications. Am J Neurorad. 1994;15:1420–1423. [Google Scholar]
- 36.Trattnig S, Pinker K, Ba-Ssalamah A, et al. The optimal use of contrast agents at high field MRI. Eur Radiol. 2006;16:1280–1287. [DOI] [PubMed] [Google Scholar]
- 37.Eldredge HB, Spiller M, Chasse JM, et al. Species dependence on plasma protein binding and relaxivity of the gadolinium-based MRI contrast agent MS-325. Invest Radiol. 2006;41:229–243. [DOI] [PubMed] [Google Scholar]
- 38.Boros E, Srinivas R, Kim HK, et al. Intramolecular hydrogen bonding restricts Gd-aqua-ligand dynamics. Angew Chem Int Ed Engl. 2017;56:5603–5606. [DOI] [PMC free article] [PubMed] [Google Scholar]


