

Abstract
Social network analysis (SNA) concerns itself in studying network structures in relation to individuals’ behavior. Individuals may be influenced by their network members in their behavior, and thus past researchers have developed computational methods that allow us to measure the extent to which individuals are exposed to members with certain behavior within one’s social network, and that be correlated with their own behavior. Some of these methods include network exposure model, affiliation exposure model, and decomposed network exposure models. We developed a Gephi plugin that computes and visualizes these various kinds of network exposure models called NET-EXPO. We experimented with NET-EXPO on some social network datasets to demonstrate its pragmatic use in social network research. This plugin has the potential to equip researchers with a tool to compute network exposures in a user friendly way and simplify the process to compute and visualize the network data.
Keywords: Social network analysis, Network exposure model, Affiliation exposure model, Visualization, Gephi, Human computer interaction, Software, Network science, Public health
1. Introduction
An old adage, “[w]hen the character of a [wo]man is not clear to you, look at [their] friends”, assumes that each individual is reflected by their interactions by another human being. Within the field of social network analysis (SNA), graph-based networks that represent relational structures can provide comprehension into their relations to individual-level behaviors/attributes. A graph is a mathematical model connecting nodes to elucidate a network structure. While representing individual people as nodes (or actors) within a graph and the connection between nodes as relationships (or ties), these graphs can provide methods to garner insight into the social network composed of a population of interest.
SNA is “set of techniques used to understand these relationships and how they affect behavior” [1]. By representing these social structures as networks, researchers can apply various mathematical and graph-based methods to quantify structural characteristics and their relation to behavioral attributes of a population. Network methods such as computing centrality measures [2,3] or complex methods such as community detection [4] can reveal behavioral information in a social network. As a graph structure, we can potentially visualize the network to further assess and communicate important findings to a wider audience.
We introduce a software add-on that we developed for a popular open source visualization software called Gephi [5]. We will also summarize the network exposure models that the software add-on is based on.
1.1. Network Exposure Model
The network exposure model aims to assess a degree to which an individual is exposed to his or her network members with certain attributes or behaviors [6–9]. It has been grounded in the diffusion of innovation theory [10], and modeling network influence by constructing the weight matrix Wij were discussed [11]. Network Exposure (Ei) is defined in the equation below (Eq. 1).
| (1) |
From Eq. 1, a network influence is represented by relationships from individuals i (ego) to j (alter) in the form of a weight matrix Wij (with i indexing row and j indexing column) that is matrix multiplied by yj (i ≠ j) that represent each network member j’s value in his or her behavioral variable (either coded as 0 or 1), and divided by row sum of Σj Wij, to normalize the resulting exposure value. Here, Ei represents the resulting vector of network exposure, yielding the proportion of a connecting network members with certain behavior or attribute yj.
1.2. Affiliation Exposure Model
Affiliation exposure, developed by our co-author (KF) and colleagues [12,13], have been employed in various social network analysis research [12–16]. Affiliation exposure model extends the network exposure model by replacing a weight matrix Wij with a one-mode actor-by-actor co-affiliation matrix Cij. The co-affiliation matrix is a result of a projection of (or conversion from) a two-mode affiliation matrix Aij where actor i index row and event j index column. Mathematically, this projected co-affiliation matrix Cij, is computed by the matrix multiplication of a bipartite graph as a matrix Aij, by its transposed form , i.e., . The off-diagonal entries of the resulting co-affiliation matrix, representing the number of common events each pair of actors jointly affiliated. Cij (where i ≠ j) is used to compute affiliation exposure (See Eq. 2). Values in the on-diagonal entries represent the number of total event each actor affiliated, that will not be used in affiliation exposure computation, but used as a control variable in regression analysis [12].
| (2) |
Analogous to network exposure model, the resulting vector Fi measures the percentages of events in which actors co-affiliates with actors of a specific behavioral attribute yj.
1.3. Decomposed Network Exposure Model
Decomposed network exposure model is another network exposure derivative developed by our co-author (KF) and colleagues that allows us to incorporate multiple network influences, by including two network weight matrices of the same population that can be decomposed into overlapped versus non-overlapped network influence [17,18]. We will focus on decomposed network exposure for using two one-mode networks as an example, but future implementation for NET-EXPO will support combinations of one one-mode network and one two-mode network [18] and two two-mode networks [17].
| (3) |
| (4) |
Equations 3 and 4 defines the decomposed network exposure model for two one-mode networks, Xij and Wij. The model involves generating a matrix from a weight matrix (Xij) and converting the elements into binarized elements sgn(Xij), and also generating the inverse form of 1 — sgn(Xij), i.e., switching 0 to 1, and 1 to 0. To derive an overlapped decomposed exposure component to a certain behavior (Di, overlap), we preform element-wise multiplication between the binary matrix sgn(Xij) and another weight matrix Wij, and then compute the standard procedure for network exposure (matrix multiply the resulting dot-multiplied matrix by the behavior vector yj), that will yield overlapped network exposure component between two networks. To derive non-overlapped decomposed exposure component to a certain behavior, we subtracted the binarized elements sgn(Xij), from a square matrix with all off-diagonal elements 1, and everything else being identical to the computation of Eq. 3.
1.4. Research Objectives
Using the aforementioned models discussed, we intend to harness Gephi, a network visualization tool, to display and compute the various network exposure measures. Through the visualization of these measures, network researchers can potentially analyze and have an insight to better understand various network influences of individuals or events/places on specific individual nodes in a network.
Currently, the Gephi plugin repository do not offer any support for the discussed network exposure models of various forms. To accomplish our objective, we developed a software add-on for Gephi that computes the models and allows the users to exploit the Gephi’s visualization tools to display the models. We will demonstrate and discuss NET-EXPO’s functionality using published datasets from well-known studies to reveal various network influences through the visualizations.
2. Material and Method
2.1. NET-EXPO
NET-EXPO was developed using the Gephi plugin API and leveraged a Java matrix library, EJML (Efficient Java Matrix Library)1. We implemented the computations for these models and integrated it within the Gephi framework. We also implemented some basic user interface features for the user to instruct Gephi on how to process the data. This included three basic configuration panels (See Fig. 1) for the three exposure models where each tab is reserved for each model computation.
Fig. 1.
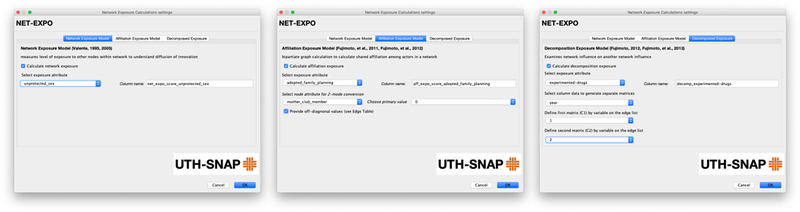
NET-EXPO’s configuration panel for network exposure, affiliation exposure, and decomposed network exposure models
2.2. Sample Network Datasets
We utilized three network datasets from previous research to demonstrate the visualization potential of the plugin. One dataset originated from research studying online network data of sex escorts and their customers from a Brazilian forum [19]. The other dataset came from Rogers and Kincaid [20] that involved the adoption of family planning methods in South Korean villages. The third dataset came from Teenage Friends and Lifestyle Study and focused on a friendship network of teenagers and their behavioral attributes [21–24]. For convenience, we used an excerpt of their network of 50 school girls2.
3. Results and Discussion
The plugin was tested on Gephi vO.9.2 on an Apple Mac Pro® machine (8-core 2.4 GHz Intel processor, 64 GB RAM, and AMD Radeon™HD 7950 3GB video card). We optimized the memory allocation for Gephi (up to 4GB) to accommodate large network graphs.
Figure 2 represents a one-node network of both escorts and clients, with ties representing a sexual partnership (Wij). The behavioral attribute yj was the unprotected sexual activity, which we defined as having either anal or oral sex without a condom (1 for unprotected sex and 0 for protected sexual contact).
Fig. 2.
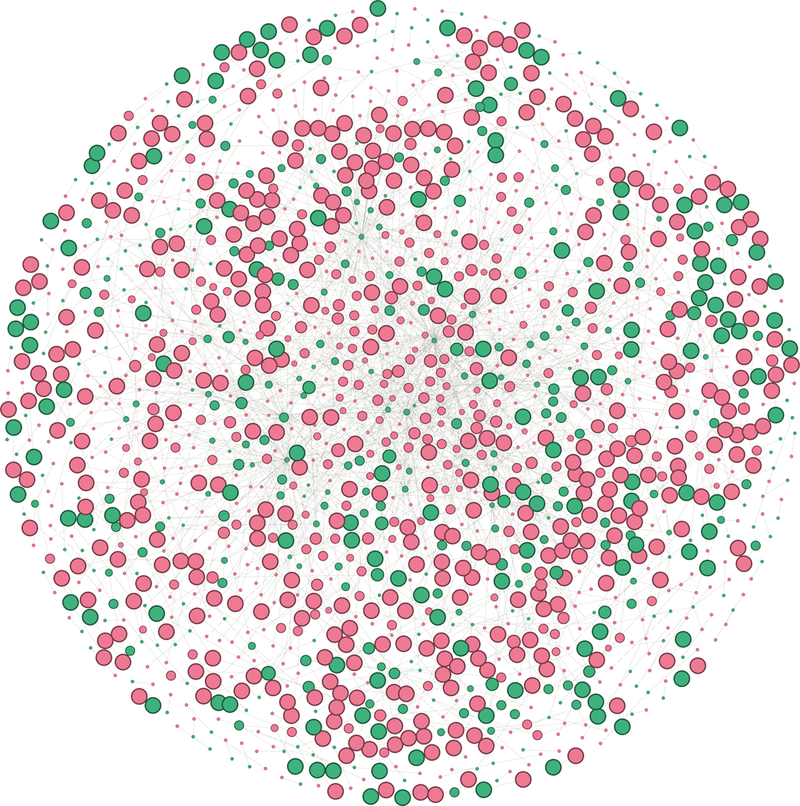
Unidirected graph of network exposure visualized through NET-EXPO. The size of the node indicates network exposure to unprotected sexual activity. Green nodes represent the sex workers and the pink nodes represent the sex clients. (Color figure online)
The network displays a visualized graph through NET-EXPO that represents a unidirected sexual network between escorts/sex workers (green nodes) and their clients (pink nodes), with the node size representing the degree to which individuals are exposed to risk of disease infection through unprotected sex activity. This network visualization shows the amount of exposure to partners that engaged in unprotected sex. The size of the nodes indicates the exposure value (i.e. the larger the value, the larger the node size). Also the dataset for this network spanned 6 years and amounted to a large network size that stalled the performance. We relegated to using a subset (first two years of data collected) for demonstration purposes.
Figure 3 is an affiliation network illustrating non-club mothers (blue nodes), who share an interaction with members of a “Mother’s Club” (red nodes). The village network shown in Fig. 3 is the converted co-affiliation matrix (Cij) projected from a two mode network (Aij) of non-club mothers i (first mode) and encounter with club mothers j (second mode). The yj vector was the adoption of family planning methods of the non-club mothers (1 for adopting and 0 for not adopting). The size of the nodes indicate the magnitude of the affiliation exposure. NET-EXPO also facilitates the creation of new links (co-affiliation) based off the projected matrix with values assigned to each of them (off-diagonal values). This particular network employs line thickness to denote the strength of the co-affiliation (green lines in Fig. 3).
Fig. 3.
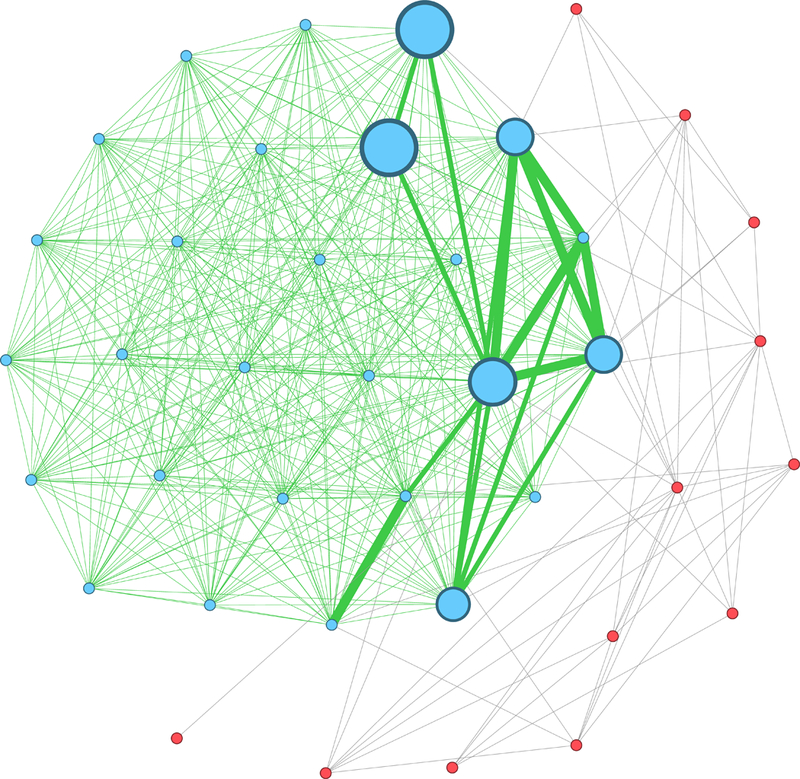
Unidirected graph of Korean village mothers where the blue nodes represent non-club members and red nodes represent club members from NET-EXPO. Green lines are the co-affiliation ties and gray lines are the non-co-affiliation ties. The size of nodes indicates exposure to family planning methods based on non-club members shared interaction with club members. (Color figure online)
Figure 4 presents two visualizations for decomposed network exposure model. The one-mode friendship network of the first year (Xij) and the one-mode friendship network of second year (Wij) were overlapped. The behavior attribute vector yj is binary value indicating whether the individual ever experimented with drugs (1 for yes or 0 for no). The left network of the figure (Di,overlap) shows the measure of exposure to drug use with a friendship network of two years. The right side network (Di,non–overlap) of the figure reveals the measure of exposure to drug use where the friendship network was not over the span of two years. The gray nodes represent teen girls who experimented with drugs, and the light orange nodes are teen girls who never experimented with drugs. The left network did not yield any exposure value, but the right network revealed exposure to experimental drug use. Again, the size of the nodes indicate the exposure strength with the values as labels assigned to each node.
Fig. 4.
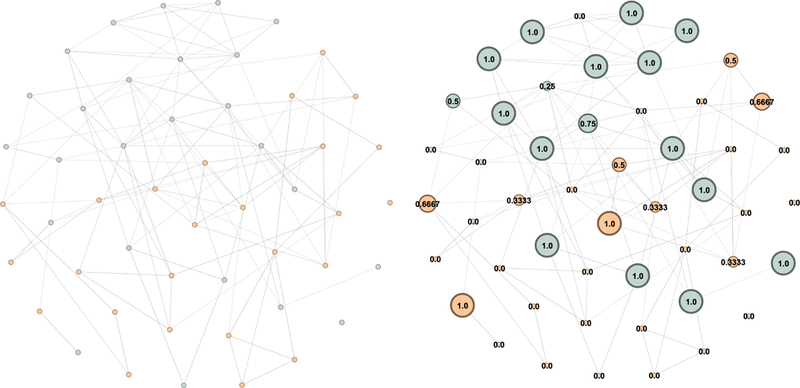
Two network exposure visualizations of teenage drug use resulting from decomposed network exposure model computation from NET-EXPO.
With NET-EXPO, users can harness the Gephi platform to measure and visualize network exposure, affiliation exposure, and decomposed network exposure. With minimum effort, network researchers could extrapolate exposure data and their visualizations using a graphical interface provided through the Gephi platform. We showed NET-EXPO’s functionality using open network datasets - sex escort network (network exposure), family planning network from a Korean villages (affiliation exposure), and a friendship network of teens (decomposed network exposure).
While previous studies have validated these exposure models, a future study is needed to derive meaning from outputted visualizations and match it to empirical observations. From a usability standpoint, we need to address scalability if users import large datasets and where the computations may take longer to process. We also need to investigate some limitations relating to workflow within the Gephi framework. For example, decomposed network exposure models for two-mode networks would require two two-mode networks, therefore, we need to address how to best utilize the data import formats to generate complex matrices while making it easy for users.
4. Conclusion
In this paper, we introduce a Gephi plugin called NET-EXPO that visualizes networks to help understand influences and the impact of affiliations among the nodes that represent individuals. netdiffuseR, a CRAN package for the R statistical environment, implements algorithms to compute network diffusion statistics including network exposure models, and other network diffusion statistics [25]. Our co-author (KF) published a STATA script module called AFFILIATION-EXPOSURE for affiliation exposure model [26]. In comparison with AFFILI-ATIONEXPOSURE, NET-EXPO aims to offer an extended network exposure model computations with the ease of click and point. As a Gephi plugin, it can leverage the WYSIWYG3 approach to visualize and manage network data. This makes NET-EXPO an ideal tool for non-technical users to be introduced to network exposure models and reach a large audience base who use Gephi. With NET-EXPO, we demonstrated the use of this plugin using three network datasets to manifest visualizations for network exposure model, affiliation exposure model, and decomposed network exposure model. The plugin is available on Github4 for open source under the Apache License 2.0. In the future, we plan on addressing scalability for large networks, testing usability with novice users, and furthering the utility of visualizing network exposure models. NET-EXPO will be extended to include a wider array of network exposure models and computation of longitudinal network exposure models [27].
Acknowledgments.
This research was supported by the UTHealth Innovation for Cancer Prevention Research Training Program (Cancer Prevention and Research Institute of Texas grant # RP160015), the National Library of Medicine of the National Institutes of Health under Award Number R01LM011829, and the National Institute on Alcohol Abuse and Alcoholism (1K99AA019699), and the National Institute of Mental Health of the National Institutes of Health under Award Numbers R01MH100021.
Footnotes
What you see is what you get.
References
- 1.Valente TW: Social Networks and Health: Models, Methods, and Applications. Oxford University Press, New York: (2010) [Google Scholar]
- 2.Freeman LC: Centrality in social networks conceptual clarification. Social Netw. 1(3), 215–239 (1978) [Google Scholar]
- 3.Newman ME: The mathematics of networks. New Palgrave Encycl. Econ. 2(2008), 1–12 (2008) [Google Scholar]
- 4.Blondel VD, Guillaume JL, Lambiotte R, Lefebvre E: Fast unfolding of communities in large networks. J. Stat. Mech.: Theory Exp. 2008(10), P10008 (2008) [Google Scholar]
- 5.Bastian M, Heymann S, Jacomy M, et al. : Gephi: an open source software for exploring and manipulating networks. Icwsm 8(2009), 361–362 (2009) [Google Scholar]
- 6.Marsden PV, Friedkin NE: Network studies of social influence. Sociol. Methods Res. 22(1), 127–151 (1993) [Google Scholar]
- 7.Burt RS: Social contagion and innovation: cohesion versus structural equivalence. Am. J. Sociol. 92(6), 128–1335 (1987) [Google Scholar]
- 8.Valente TW: Network models of the diffusion of innovations. Comput. Math. Organ. Theory 2(2), 163–164 (1996) [Google Scholar]
- 9.Valente TW: Network models and methods for studying the diffusion of innovations. Models Methods Soc. Netw. Anal. 28, 98 (2005) [Google Scholar]
- 10.Rogers EM: Diffusion of Innovations. Simon and Schuster, New York: (2010) [Google Scholar]
- 11.Leenders RTA: Modeling social influence through network autocorrelation: constructing the weight matrix. Soc. Netw. 24(1), 21–47 (2002) [Google Scholar]
- 12.Fujimoto K, Chou CP, Valente TW: The network autocorrelation model using two-mode data: affiliation exposure and potential bias in the autocorrelation parameter. Soc. Netw. 33(3), 231–243 (2011) [DOI] [PMC free article] [PubMed] [Google Scholar]
- 13.Fujimoto K, Unger JB, Valente TW: A network method of measuring affiliation-based peer influence: assessing the influences of teammates’ smoking on adolescent smoking. Child Dev. 83(2), 442–451 (2012) [DOI] [PMC free article] [PubMed] [Google Scholar]
- 14.Papachristos AV, Wildeman C, Roberto E: Tragic, but not random: the social contagion of nonfatal gunshot injuries. Soc. Sci. Med. 125, 139–150 (2015) [DOI] [PubMed] [Google Scholar]
- 15.Wipfli HL, Fujimoto K, Valente TW: Global tobacco control diffusion: the case of the framework convention on tobacco control. Am. J. Public Health 100(7), 1260–1266 (2010) [DOI] [PMC free article] [PubMed] [Google Scholar]
- 16.Myneni S, Fujimoto K, Cobb N, Cohen T: Content-driven analysis of an online community for smoking cessation: integration of qualitative techniques, automated text analysis, and affiliation networks. Am. J. Public Health 105(6), 1206–1212 (2015) [DOI] [PMC free article] [PubMed] [Google Scholar]
- 17.Fujimoto K, Wang P, Valente TW: The decomposed affiliation exposure model: a network approach to segregating peer influences from crowds and organized sports. Netw. Sci. 1(2), 154–169 (2013) [DOI] [PMC free article] [PubMed] [Google Scholar]
- 18.Fujimoto K, Valente TW: Alcohol peer influence of participating in organized school activities: a network approach. Health Psychol. 32(10), 1084 (2013) [DOI] [PMC free article] [PubMed] [Google Scholar]
- 19.Rocha LEC, Liljeros F, Holme P: Information dynamics shape the sexual networks of Internet-mediated prostitution. Proc. Natl. Acad. Sci. U.S.A. 107(13), 5706–5711 (2010) [DOI] [PMC free article] [PubMed] [Google Scholar]
- 20.Rogers EM, Kincaid DL: Communication networks: toward a new paradigm for research (1981) [Google Scholar]
- 21.West P, Sweeting H: Background, rationale and design of the west of scotland 11 to 16 study. MRC Medical Sociology Unit Working Paper, no. 52 (1996) [Google Scholar]
- 22.Michell L, Amos A: Girls, pecking order and smoking. Soc. Sci. Med. 44(12), 1861–1869 (1997) [DOI] [PubMed] [Google Scholar]
- 23.Michell MPL: Smoke rings: social network analysis of friendship groups, smoking and drug-taking. Drugs: Educ. Prevent. Policy 7(1), 21–37 (2000) [Google Scholar]
- 24.Pearson M, West P: Drifting smoke rings. Connections 25(2), 59–76 (2003) [Google Scholar]
- 25.Yon GV, et al. : netdiffuser: Network analysis for diffusion of innovations (2016) [Google Scholar]
- 26.Fujimoto K: AFFILIATIONEXPOSURE: stata module to compute an affiliation exposure model using two-mode actor(row)-by-event(column) network data. Statistical Software Components, Boston College Department of Economics, June 2011 [Google Scholar]
- 27.Valente TW, Dyal SR, Chu KH, Wipfli H, Fujimoto K: Diffusion of innovations theory applied to global tobacco control treaty ratification. Soc. Sci. Med. 145, 89–97 (2015) [DOI] [PMC free article] [PubMed] [Google Scholar]