

Supplemental Digital Content is available in the text
Keywords: awareness, hypertension, prevalence, risk factors, risk prediction model
Abstract
Hypertension is a common global health problem including China. This study aimed to assess the prevalence and awareness of hypertension, and evaluate risk factors associated with hypertension among multi-ethnic population in northwest China using a random sampling cross-sectional data.
A cross-sectional survey was conducted between 2014 and 2015 as part of a nationwide survey using stratified four-stage random sampling in Xinjiang. Hypertension was defined as mean systolic blood pressure (SBP) and/or diastolic blood pressure (DBP) ≥140/90 mm Hg and/or taking anti-hypertensive medication. In addition, the prevalence of hypertension (SBP ≥ 130 or DBP ≥ 80 mm Hg) was also estimated according to the 2017 American College of Cardiology (ACC)/American Heart Association (AHA) High Blood Pressure Guideline. Awareness of hypertension was based on self-report. An optimized risk score model was used to assess the risk and determine the predictive power of risk factors on hypertension.
Totally 6722 subjects aged ≥18 years were enrolled and prevalence of hypertension was 24.3%, while the prevalence of hypertension based on the 2017 ACC/AHA guideline was approximately twice as high as that based on 2010 Chinese guideline (37.6%). Among individuals with hypertension, 55.5% were aware of their condition. Six potential factors were estimated to be associated with increased risk of hypertension including age, ethnicity, marital status, body mass index (BMI), waistline circumference, and comorbidity. In the analyses of calculated risk score, BMI ≥ 28.0 corresponded to the highest risk score of 23 points. The area under the receiver operation curve for the multivariable prediction model was 0.803 (95%CI: 0.789–0.813).
There is a considerable prevalence of hypertension among Xinjiang adults, northwest China; awareness of hypertension is low. Excess weight loss may be a vital strategy for controlling hypertension, particularly if accompanied with other preventive measures in this region.
1. Introduction
Hypertension is the major and modifiable risk factor for cardiovascular disease (CVD), which represents top cause of death in China.[1,2] The burden of hypertension and CVD in China is increasing along with urbanization, rapidly rising per capital income and aging population.[3,4] In China, the most populated country in the world, crude prevalence of hypertension is about 27.9% in population aged ≥18 years,[5] up to 41.9% in population aged ≥35 years,[6] whereas the control rate is only 15.3%, which is even unacceptably low (8.2%) in underdeveloped areas such as Xinjiang, compared with southeast of China.[7] Although many factors have been reported to be associated with hypertension among Xinjiang residents, including lifestyle characteristics, socioeconomic factors, fasting blood-glucose (FBG) and blood lipid.[8–10] However, the exact role and effect value of these factors in predicting hypertension remain unclear.
Xinjiang, a multi-ethnic underdeveloped province, is located in Northwestern China, where historically hypertension is affecting about 35% of population aged ≥35 years.[11] Also the prevalence is even higher in some population such as Kazakh (52.6%), Uygur (54.6%), and Mongolians (39.5%) aged ≥30 years.[8] Minority groups and Han have different cultural backgrounds, customs and lifestyle. In addition, there are generally lower level of culture and education, and the poor medical care and residents health awareness, compared with other areas of the country, leading to serious public health conditions in Xinjiang.[9,11]
Previous research from many countries found that public health and behavior intervention among different populations can improve hypertension.[12] However, in order to effectively prevent hypertension, it is necessary to determine the precise magnitude, awareness, and contributors of hypertension. Therefore, this study aimed to reveal the magnitude and awareness rates of hypertension, and construct a targeted hypertension scoring system and prediction model for identifying the risk factors associated with hypertension and for early screening the high-risk groups of hypertension. The results provided the basis for the developing interventions for hypertension in Xinjiang residents and may be of important reference value for the screening and control of hypertension for the Xinjiang area extending to the Belt and Road countries including the same ethnicity which share common phenotypes and genotypes.
2. Materials and methods
2.1. Study population
This cross-sectional study was conducted between 2012 and 2015 as a part of national study. A four-stage (city/county-district/township-community/village-resident) stratified random sampling method was used to select participants who were aged 15 years and older from the general population of Xinjiang. First, two cities as the urban areas and five counties as rural areas were selected using a probability proportional to size. Then two districts or two townships were selected in each city or county using simple random sampling (SRS). Next, in each district and township, three communities or villages were chosen respectively using SRS. Finally, participants stratified by sex (50% men and 50% women) and age (aged 15–24, 25–34, 35–44, 45–54, 55–64, 65–74, ≥75 years) were chosen using SRS according to the population composition. Participants were chosen from the list provided by the local government registers of households.[5] Sample size was estimated as N = 6452, based on a design effect of 1.8 and assuming a prevalence of hypertension of 16.0% among the population aged ≥15 years and calculated. 15% of no response rate was considered and about 7400 sample was planned to be included. Finally, 7276 participants aged ≥15 years (with response rate: >95%) participated in the survey. The selection criteria were as follows:
1. Residents who are living in the local for at least 6 months.
2. Residents who are willing to cooperate with the investigation.
3. Women who are not pregnant.
4. Residents who are able to and willing to perform measurements including anthropometric and blood plasma glucose and lipid test.
5. Residents with clear consciousness and without mental diseases.
In the current analysis were assessed in population aged ≥18 years. This study was approved by the Fuwai Hospital Ethics Review Board.
2.2. Training and data collection
All study investigators and staff members were trained to be familiar with both the aims of the study and the specific tools and methods used. A standardized questionnaire developed by the coordinating center, Fuwai Hospital, was administered by trained staff to obtain information on demographic characteristics, social-economic factors, health-related behaviors (cigarette smoking, alcohol consumption),[5] disease status (hypertension, diabetes, stroke, dyslipidemia, and other diseases). Anthropometric variables were measured using standard equipment and procedures (including blood pressure, height, weight, and waist circumference).[13] Blood pressure (BP) was measured with the OMRON HBP-1300 Professional Portable Blood Pressure Monitor (OMRON, Kyoto, Japan) three times on the right arm positioned at heart level after the participant was sitting at rest for 5 min, with 30 s between each measurement with an observer present. The average of the three readings was used for analysis. Height was measured without shoes using a standard right-angle device and a fixed measurement tape (to the nearest 0.5 cm). Body weight without heavy clothing was measured using an OMRON body fat and weight measurement device (V-body HBF-371, OMRON, Kyoto, Japan). Waistline circumference (WC) was measured in the midpoint between the lower rib and upper margin of the iliac crest, measured by a ruler tape with an insertion buckle at one end. WC was measured to the nearest 0.1 cm. Body mass index (BMI) was calculated as weight divided by the square of height (kg/m2).
2.3. Blood plasma glucose and lipid measurements
All participants were fasting for ≥12 h, and a 9-mL fasting blood sample was collected from each participant who takes a comfortable seat in the morning. The sample was centrifuged at 2000 rpm for 10 min after the sample was stand at room temperature for 45 min, and plasma was stored at lower −20°C. Total cholesterol (TC), high density lipoprotein cholesterol (HDL-C), low density lipoprotein cholesterol (LDL-C), and fasting blood glucose (FBG) were tested in the Biochemistry Laboratory of Fuwai Hospital. Quality control was strictly followed by the procedure of blood collection, separation, storage, transportation, and measuring processes.
2.4. Definitions
Hypertension was defined as systolic BP (SBP) ≥140 mm Hg, and/or diastolic BP (DBP) ≥90 mm Hg, and/or use of antihypertensive medicine within 2 weeks (2010 Chinese guideline for the management of hypertension). The prevalence hypertension was also estimated according to the 2017 American College of Cardiology (ACC)/American Heart Association (AHA) High Blood Pressure Guideline.[14] All participants were asked whether they had a medical diagnosis of hypertension (awareness). Education status was categorized into three levels: primary and lower, junior high and, senior high, and higher. Overweight and obesity were defined as a BMI between 24.0 and 27.9 kg/m2 and of ≥28.0 kg/m2. Abdominal obesity was defined as WC ≥ 90 cm in male, WC ≥ 85 cm in female. Current smokers were defined as participants who have smoked at least 20 packets of cigarettes in their lifetime and currently smoke cigarettes; former smokers as participants who have smoked at least 20 packets of cigarettes in their lifetime, and quit smoking for at least 1 month; never smokers as participants who never smoked or smoked <20 packets of cigarettes in their entire lifetime. Drinker was defined as consuming at least once alcoholic beverage per week in the past month.
2.5. Statistical analysis
Descriptive statistics were conducted for 6722 subjects at baseline. Continuous variables were presented as means ± standard deviations (m ± sd), and the student's t test was used to detect the statistical significances between hypertension and non-hypertension. Categorical variables were expressed as frequency (n) and proportion (%), and the chi-square test was conducted to detect the difference between hypertension and non-hypertension.
Steps of the assessment of risk factor and the development of predictive model: First, the independent variables were coded (Table-supplement1). Univariable and multivariable logistic regression model was used to select potential factors associated with increased risk of hypertension. Second, an optimized Framingham risk model was then used to calculate risk scores based on the selected risk factors. Using previously described methods for determining points associated with each of the categories of the risk factors (Table supplement2).[15] Third, we determined risks associated with point totals. We attached a risk estimate to each point total using the multiple logistic regression equation. Total risk scores were then categorized into three groups according to the estimated probability of hypertension: low (<16%), moderate (16–67%), and high (≥67%). All above statistical analyses were performed using SPSS 19.0 for Windows.
Receiver operating characteristics (ROC) curves, sensitivity and specificity of the predicted probability of hypertension were calculated to assess the predictive power of the final multivariable model, and to determine the cut-off value for the predicted probability of hypertension. The nomogram was build to interpret the relation between probability risk of hypertension and total points, which is more easily understood and straightforward. Stata12.0 statistical software was conducted in the statistical analyses.
3. Results
3.1. Population characteristics
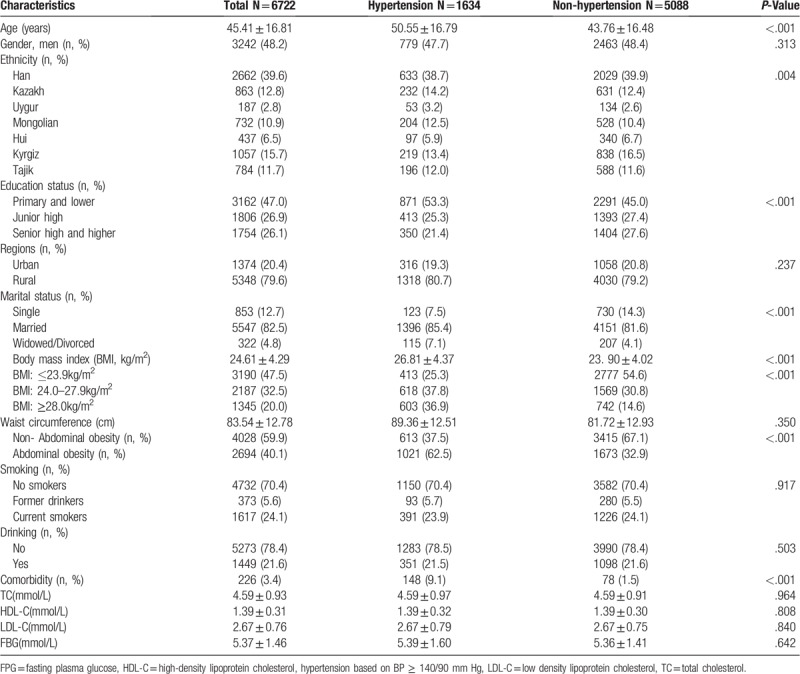
A total of 6722 subjects aged 45.41 ± 16.81 years were enrolled from Xinjiang with women accounting for 51.8% and with subjects from rural region accounting for 79.6% (Fig. 1). In terms of proportion of ethnic groups, the number of enrolled subjects were the largest in Han (n = 2662, 39.6%), second in Kyrgyz (n = 1057, 15.7%), and followed by Kazakh (n = 863, 12.8%), Tajik (n = 784, 11.7%), Mongolian (n = 732, 10.9%), and Uygur (n = 187, 2.8%) subjects, most was primary and lower education status (47%). As compared with residents without hypertension, those who with hypertension were more likely to be elder, minority, more likely to experience low education status and widowed/divorced, more likely to have higher BMI, higher waist circumference and comorbidities (Table 1).
Figure 1.
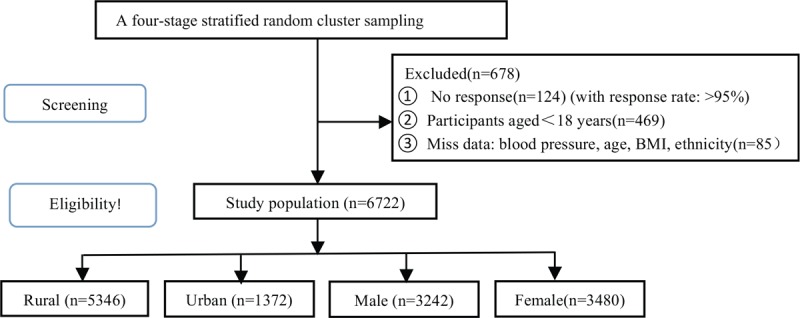
The flow chart of recruiting the surveyed subjects including screening and eligibility.
Table 1.
Basic characteristics among Xinjiang residents with and without hypertension.
3.2. Prevalence and awareness of hypertension
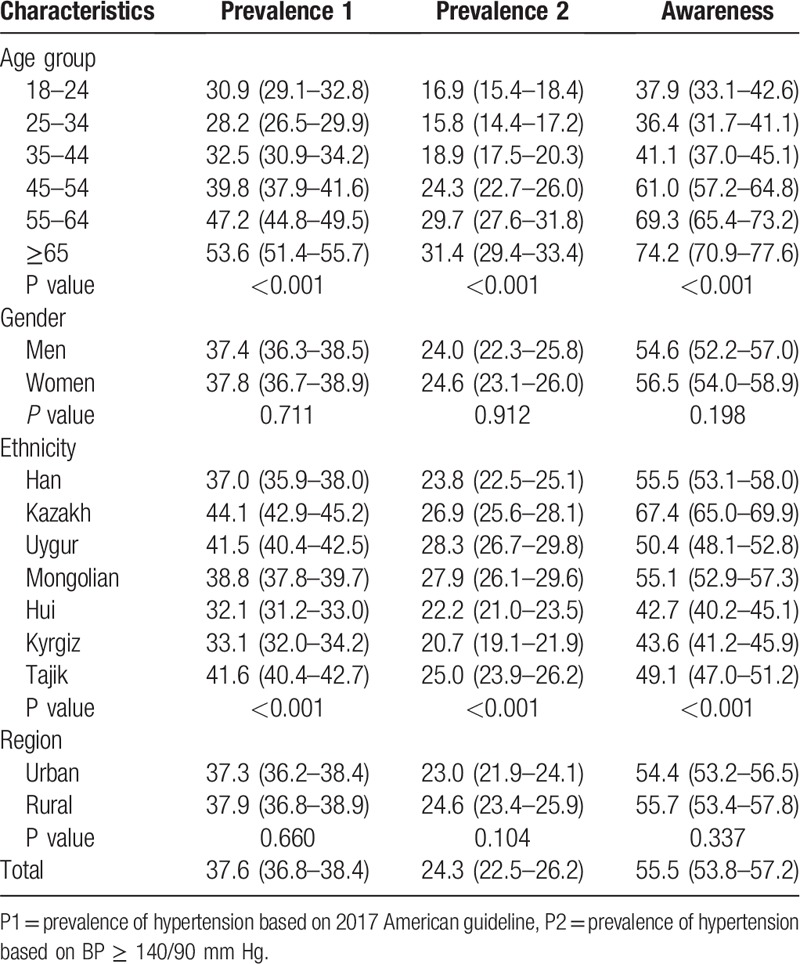
Among Xinjiang adults aged ≥18 years, the overall prevalence of hypertension was 24.3% and similar for both genders (24.0% vs 24.6%, P = .912) and for urban and rural regions (23.0% vs 24.6%, P = .104) (Table 2). Uygur and Mongolian ethnic subjects had the highest prevalence of hypertension (28.3% and 27.9%, respectively), followed by Kazakh and Tajik ethnic subjects (26.9% and 25.0%, respectively). The prevalence of hypertension based on the 2017 ACC/AHA guideline was approximately twice as high as that based on 2010 Chinese guideline (37.6%) (Table 2). Of the hypertensive subjects, 55.5% (95% CI 53.8–57.2%) were aware of having hypertension. Subjects from Hui and Kyrgiz ethnic group had the lowest awareness (42.7% and 43.6%, respectively), followed by Tajik ethnic subjects (49.1%). No significant difference was found between men and women, as well as urban and rural settings in the awareness of hypertension (Table 2).
Table 2.
Prevalence and awareness of hypertension among Xinjiang residents s (%, 95%CI).
3.3. Risk factors assessment
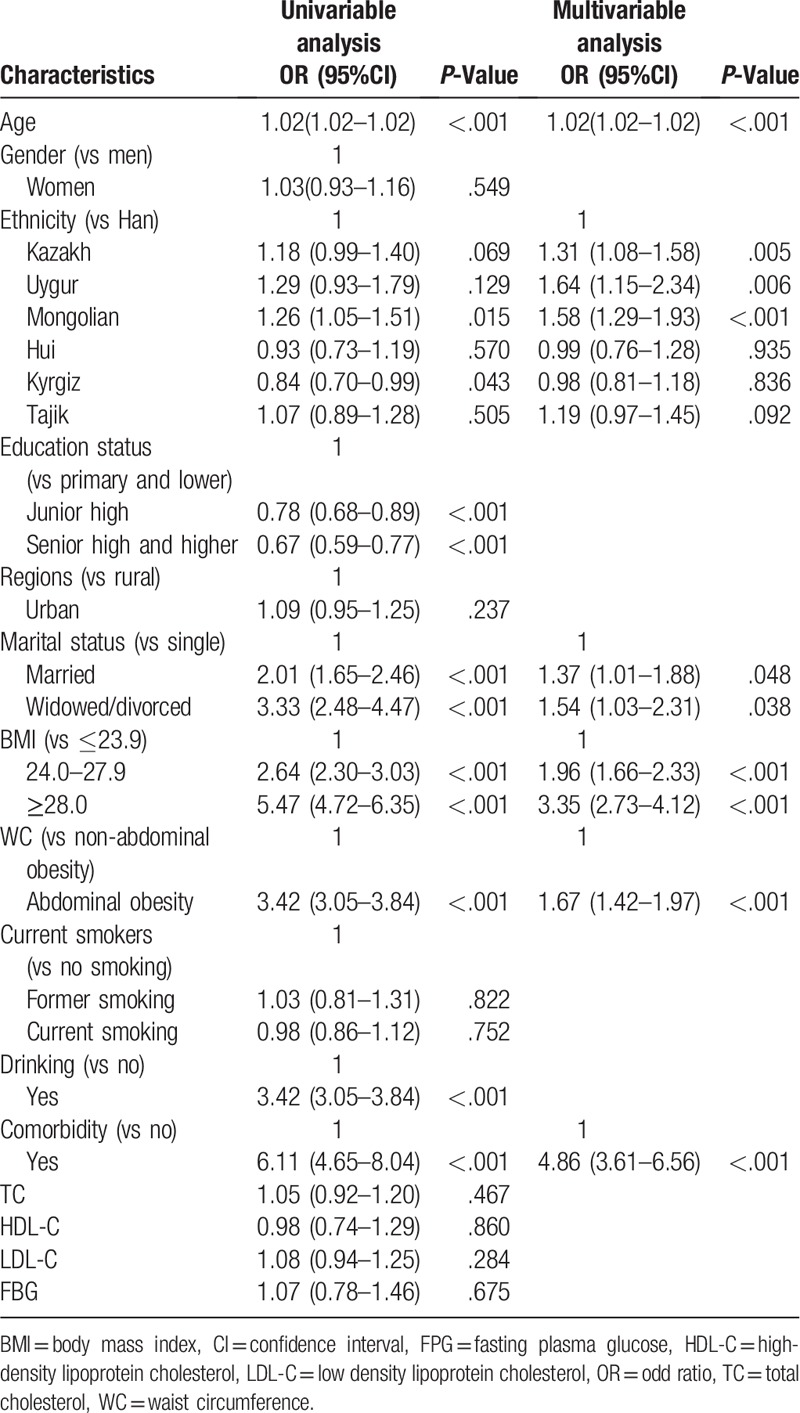
Risk factors were screened by univariable logistic regression, and then build a multivariable logistic regression model (Table 3). The results suggested that age (OR = 1.02; 95% CI, 1.02–1.02), ethnicity (Kazakh: OR = 1.31; 95% CI, 1.08–1.58, Uygur: OR = 1.64; 95% CI, 1.15–2.34, Mongolian: OR = 1.58; 95% CI, 1.29–1.93, Tajikh: OR = 1.19; 95% CI, 0.97–1.45 vs Han), marital status (married: OR = 1.37; 95% CI, 1.01–1.88 and widowed/divorced: OR = 1.54; 95% CI, 1.03–2.31 vs single), BMI (BMI: 24.0–27.9, OR = 1.96; 95% CI, 1.66–2.33 and BMI ≥ 28.0, OR = 3.35; 95% CI, 2.73–4.12 vs BMI ≤ 23.9), WC (abdominal obesity: OR = 1.67; 95% CI, 1.42–1.97 vs non-abdominal obesity), and comorbidity (yes: OR = 4.86; 95% CI, 3.61–6.56 vs no) were more likely associated hypertension. Thus, we derived the following multivariable logistic regression equation:
Table 3.
Univariable and multivariable analysis for hypertension.
Logit(probability of Xinjiang residents with hypertension | XAge, XKazakh, XUygur, XMongolian, XHui, Xkyrgiz, XTajikh, XMarried, XWidowed/Divorced, X24≤BMI≤28, XBMI≥24, XAbdominalobesity, XWithcomorbidity) = −3.276 + 0.021(age) + 0.268(Kazakh) + 0.502(Uygur) + 0.487 (Mongolian) + 0.011(Hui) + 0.020(kyrgiz) + 0.201(Tajikh) + 0.210(married) + 0.294 (widowed/divorced) + 0.655(24≤BMI<28 + 1.187(BMI≥28) + 0.476(abdominal obesity) + 1.582(with comorbidity)
3.4. Risk score for hypertension and assessment
The points corresponding to each of the risk factor categories were shown in Table 4. We observed BMI ≥ 28.0 corresponded to a highest risk score of 23 points, second was comorbidity (15 point), and followed by aged ≥65 (11 point). Each total point of all participants showed that 1131 had a total risk score greater than 34, which corresponded to an estimated probability of hypertension of more than 67% (Table-S3). The area under the ROC curve (AUC) for the multivariable prediction model was 0.803 (95%CI: 0.789–0.813), and using the risk score cut-off value of 24 to identify hypertension in a sensitivity and specificity value were 61.5% and 84.6%, respectively (Fig. 2).
Table 4.
Risk score calculation for risk factors of hypertension in residents of Xinjiang.
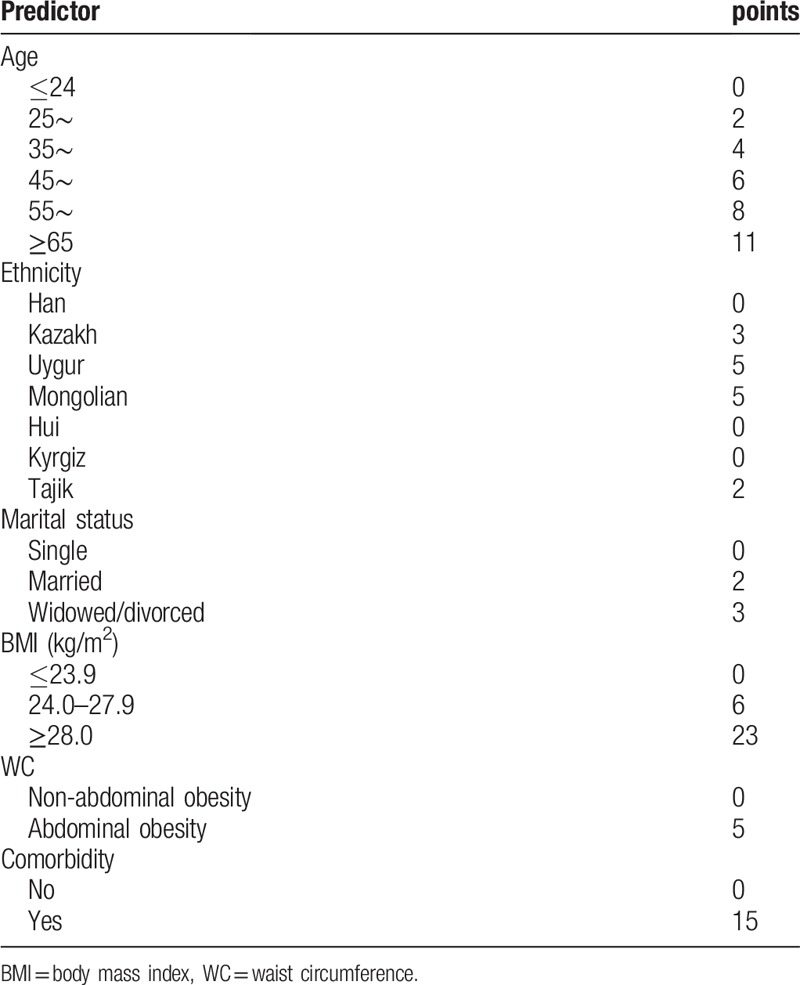
Figure 2.
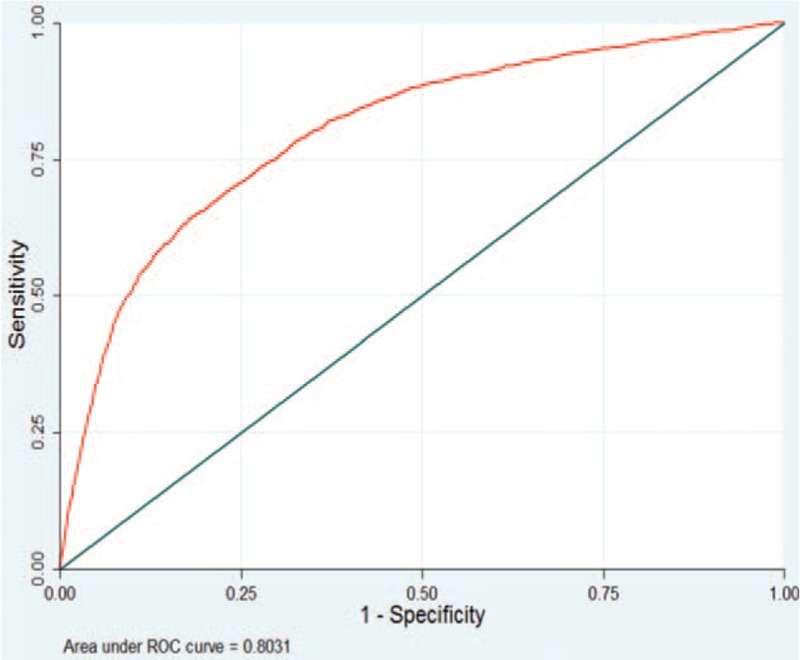
Receiver operating characteristic curves of final multivariable prediction model for residents with hypertension.
Based on this six-risk factors logistic regression model, we built the nomogram model for hypertension prediction in Xinjiang residents. The nomogram model is showed in Figure 3.
Figure 3.
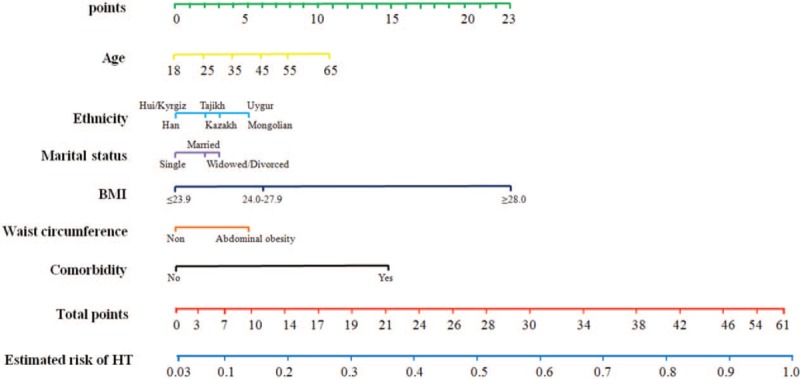
Nomogram model for HT prediction in Xinjiang residents (e.g., a resident with age = 45, Kazakh, divorced, BMI: 24–27.9, non-abdominal obesity, no comorbidity, the total point is 18 read from the above nomogram, and the corresponding probability of HT is 0.28[28%]).
4. Discussion
This survey showed that one in four of Xinjiang adults aged ≥18 years had hypertension. The overall prevalence of hypertension in Xinjiang populations was higher than national average (24.3% vs 23.2%).[5] Without effective intervention, the burden of hypertension will only exacerbate the epidemic of cardiovascular and kidney diseases, especially in Uygur, Mongolian, and Kazakh populations. Furthermore, our study indicated that approximately half of hypertensive patients were not aware of their condition here. There are widening gap compared with high-income countries in hypertension awareness.[16] Therefore, there is an urgent need to identify effective interventions for the prevention and control of hypertension in Xinjiang. We may build appropriate model for assessing the risk of hypertension and for identifying high-risk factors, which could early screen the high-risk groups of hypertension and provide the basis for the developing interventions for hypertension.
Several studies have found that the overweight and obesity are the risk of hypertension.[17,18] Furthermore, hypertensive patients who normalized their body mass index can largely improve BP level and a number of metabolic and hormonal parameters.[19,20] Our study suggested that a major risk factor for hypertension among residents of Xinjiang is BMI ≥ 28.0, associated the highest addition to the risk score (23 points) of all of the risk factors examined, similar to several epidemiological research conducted in other countries.[21–23] Moreover, the overall prevalence of obesity and abdominal obesity were 20.0% and 40.1%, respectively and 36.9%, 62.5% among hypertensive patients. Furthermore, numerous studies confirm the central role of abdominal obesity as the main metabolic syndrome component associated with early organ damage in the patients with metabolic syndrome.[24] Therefore, our results may provide very valuable information for excess weight loss is a critical public health priority in prevention of hypertension in Xinjiang residents.
Additionally, our study indicated that age is a risk factor for hypertension in residents of Xinjiang, which is also in line with reports from global epidemiological research, as the risk of hypertension increases with age.[25,26] It is noteworthy that our study found the married or widowed/divorced are independent risk factors for hypertension, contributing 2 and 3 points to the risk score, respectively. Although the widowed/divorced rate in Xinjiang currently accounts for approximately 5%, this group of people have a high risk of developing hypertension since they continue to experience serious work- and life-related stress.[27,28]
Different ethnic groups have different genetic backgrounds and enduring lifestyles which are associated with hypertension.[11,29,30] The findings from different ethnicity conducted in the United States showed that the prevalence of hypertension was 40.5% in non-Hispanic blacks, while 27.4% in non-Hispanic whites.[31] An important finding of our study suggests that minority ethnicity may be a major risk factor for hypertension among Xinjiang, compared with Han ethnicity. The risk scores of Kazakh, Uygur, Mongolian, and Tajikh were 3, 5, 5, and 2, respectively, and corresponding to the OR were 1.31, 1.64, 1.58, and 1.19, respectively. Previous studies have demonstrated that minority population often consume unbalanced diet (e.g., excessive consumption of beef, sodium, alcohol, and mutton), which increases the risk of hypertension.[29,32] More importantly, Kazakh ethnicity is mainly distributed in Kazakhstan, Uzbekistan, Russia, and China. Mongolian ethnicity in Russia, Republic of Mongolia, and Inner Mongolia of China. Tajik ethnicity is mainly distributed in Tajikistan, Uzbekistan and China. However, there are few epidemiological studies on hypertension, awareness, and hypertension associated factors. Therefore, the present study may provide a theoretical basis for the prevention and control of hypertension in the countries including the same ethnicity which share common phenotypes and genotypes.
Current analysis is strengthened by relatively representative study subjects and by diversity in ethnicity, which makes the report one of the valuable information for public health sectors and for clinical setting. In addition, using high-quality data obtained in a systematic and standardized approach, hypertension was used to construct a prediction model for the multiple ethnicity population, as similar studies have not been reported. The results may be of important reference value for the prediction, early screening and control of hypertension for Xinjiang area extending to the Belt and Road countries with the same ethnicity.
This study had some limitations. First of all, current analysis failed to focus on information from diet such as salt intake, which was associated factors of hypertension. Nonetheless, previous studies provided data that daily salt intake of local population is about 12.4–16.1 g.[30,31] Second, our study design was cross-sectional, the associations causality need cohort studies with follow-up data to strengthen the understanding. Indeed, we will follow the current population of this study for several years.
5. Conclusions
There is a considerable prevalence of hypertension among Xinjiang, northwest China; with low awareness. Excess weight loss is a vital strategy for controlling hypertension, particularly if accompanied with other preventive measures.
Acknowledgments
We thank all the individuals who participated in the present study. We thank The Department of Science and Technology of Xinjiang Uygur Autonomous Region of China for funding the project.
Author contributions
Nanfang Li was involved in the study design. Lin Wang, Mulalibieke Heizhati, Nanfang Li, Delian Zhang, Guijuan Chang, Xiaoguang Yao, Jing Hong, Mayila Kamilijiang, and Mei Li collected the data. Lin Wang and Mulalibieke Heizhati performed the statistical analysis. Lin Wang and Mulalibieke Heizhati wrote the paper. Nanfang Li, Xiaoguang Yao, Jing Hong, Delian Zhang, and Guijuan Chang gave important suggestions and did significant changes. All authors reviewed and approved the final version of the paper. We also thank all the participants of the survey including the population.
Conceptualization: Nanfang Li.
Data curation: Nanfang Li, Lin Wang, Mulalibieke Heizhati, Delian Zhang, Xiaoguang Yao, Mayila Kamilijiang.
Funding acquisition: Nanfang Li.
Investigation: Nanfang Li, Lin Wang, Mulalibieke Heizhati, Delian Zhang, Guijuan Chang, Xiaoguang Yao, Jing Hong, Mayila Kamilijiang, Mei Li.
Methodology: Nanfang Li.
Writing – original draft: Lin Wang.
Writing – review & editing: Mulalibieke Heizhati, Delian Zhang, Xiaoguang Yao.
Supplementary Material
Footnotes
Abbreviations: ACC = American College of Cardiology, AHA = American Heart Association, BMI = body mass index, BP = blood pressure, CVD = cardiovascular disease, DBP = diastolic blood pressure, FBG = fasting blood-glucose, HDL-C = high density lipoprotein cholesterol, LDL-C = low density lipoprotein cholesterol, OR = odd ratio; CI = confidence interval, ROC = receiver operating characteristics, SBP = systolic blood pressure, SRS = simple random sampling, TC = total cholesterol, WC = Waistline circumference.
How to cite this article: Wang L, Heizhati M, Zhang D, Chang G, Yao X, Hong J, Kamilijiang M, Li M, Li N. Excess weight loss is a vital strategy for controlling hypertension among multi-ethnic population in northwest China. Medicine. 2019;98:36(e16894).
This work was supported by a grant from the Key Research and Development Project of Xinjiang Uygur Autonomous Region China (2017B03015).
LW and MH contributed equally to this work.
The authors report no conflicts of interest.
Supplemental Digital Content is available for this article.
References
- [1].He J, Gu D, Chen J, et al. Premature deaths attributable to blood pressure in China: a prospective cohort study. Lancet 2009;374:1765–72. [DOI] [PubMed] [Google Scholar]
- [2].GBD Causes of Death Collaborators. Global, regional, and national age-sex specific mortality for 264 causes of death, 1980-2016: a systematic analysis for the global burden of disease study 2016. Lancet 2017;390:1151–210. [DOI] [PMC free article] [PubMed] [Google Scholar]
- [3].Lim SS, Vos T, Flaxman AD, et al. A comparative risk assessment of burden of disease and injury attributable to 67 risk factors and risk factor clusters in 21 regions, 1990-2010: a systematic analysis for the global burden of disease study 2010. Lancet 2012;380:2224–60. [DOI] [PMC free article] [PubMed] [Google Scholar]
- [4].Lawes CM, Vander Hoorn S, Rodgers A, et al. Global burden of blood-pressure-related disease. Lancet 2008;371:1513–8. [DOI] [PubMed] [Google Scholar]
- [5].Wang Z, Chen Z, Zhang L, et al. Status of hypertension in China: results from the China Hypertension Survey, 2012-2015. Circulation 2018;137:2344–56. [DOI] [PubMed] [Google Scholar]
- [6].Li W, Gu H, Teo KK, et al. Hypertension prevalence, awareness, treatment, and control in 115 rural and urban communities involving 47000 people from China. J Hypertens 2016;34:39–46. [DOI] [PubMed] [Google Scholar]
- [7].Nrc C, Zhang XH. Hypertension in China time to transition from knowing the problem to implementing the solution. Circulation 2018;137:2357–9. [DOI] [PubMed] [Google Scholar]
- [8].Yao XG, Frommlet F, Zhou L, et al. The prevalence of hypertension, obesity and dyslipidemia in individuals of over 30 years of age belonging to minorities from the pasture area of Xinjiang. BMC Public Health 2010;10:91. [DOI] [PMC free article] [PubMed] [Google Scholar]
- [9].Wang Y, Zhang J, Ding Y, et al. Prevalence of hypertension among adults in remote rural areas of Xinjiang, China. Int J Environ Res Public Health 2016;13: [DOI] [PMC free article] [PubMed] [Google Scholar]
- [10].Hu Y, Wang Z, Wang Y, et al. Prevalence, awareness, treatment, and control of hypertension among Kazakhs with high Salt Intake in Xinjiang, China: a community-based cross-sectional study. Sci Rep 2017;7:45547. [DOI] [PMC free article] [PubMed] [Google Scholar]
- [11].Wang YT, Adi D, Yu ZX, et al. The burden and correlates of hypertension among Chinese rural population in Han, Uygur, and Kazak: a cross-sectional study. J Am Soc Hypertens 2017;11:737–45. [DOI] [PubMed] [Google Scholar]
- [12].Naing C, Aung K. Prevalence and risk factors of hypertension in Myanmar: a systematic review and meta-analysis. Medicine (Baltimore) 2014;93:e100. [DOI] [PMC free article] [PubMed] [Google Scholar]
- [13].World Health Organ Obesity: preventing and managing the global epidemic, vol. 894. WHO: Geneva, Switzerland; 2000:1–253. [PubMed] [Google Scholar]
- [14].Whelton PK, Carey RM, Aronow WS, et al. 2017 ACC/AHA/AAPA/ABC/ACPM/AGS/APHA/ASH/ASPC/NMA/PCNA guideline for the prevention, detection, evaluation, and management of high blood pressure in adults: A report of the American College of Cardiology/American Heart Association Task Force on clinical practice guidelines. Hypertension 2018;71:13–15. [DOI] [PubMed] [Google Scholar]
- [15].Sullivan LM, Massaro JM, D’Agostino RB., Sr Presentation of multivariate data for clinical use: the Framingham study risk score functions. Stat Med 2004;23:1631–60. [DOI] [PubMed] [Google Scholar]
- [16].Mills KT, Bundy JD, Kelly TN, et al. Global disparities of hypertension prevalence and control: a systematic analysis of population-based studies from 90 countries. Circulation 2016;134:441–50. [DOI] [PMC free article] [PubMed] [Google Scholar]
- [17].Poorolajal J, Hooshmand E, Bahrami M, et al. How much excess weight loss can reduce the risk of hypertension? J Public Health (Oxf) 2017;39:95–102. [DOI] [PubMed] [Google Scholar]
- [18].Du M, Yin S, Wang P, et al. Self-reported hypertension in Northern China: a cross-sectional study of a risk prediction model and age trends. BMC Health Serv Res 2018;18:475. [DOI] [PMC free article] [PubMed] [Google Scholar]
- [19].Fogari R, Zoppi A, Corradi L, et al. Effect of body weight loss and normalization on blood pressure in overweight non-obese patients with stage 1 hypertension. Hypertens Res 2010;33:236–42. [DOI] [PubMed] [Google Scholar]
- [20].Cicero AF. Weight loss and blood pressure normalization: the relevance of early interventions in hypertension. Hypertens Res 2010;33:195–6. [DOI] [PubMed] [Google Scholar]
- [21].Roka R, Michimi A, Macy G. Associations between hypertension and body mass index and waist circumference in U.S. Adults: a comparative analysis by gender. High Blood Press Cardiovasc Prev 2015;22:265–73. [DOI] [PubMed] [Google Scholar]
- [22].Midha T, Krishna V, Nath B, et al. Cut-off of body mass index and waist circumference to predict hypertension in Indian adults. World J Clin Cases 2014;2:272–8. [DOI] [PMC free article] [PubMed] [Google Scholar]
- [23].Dong B, Wang Z, Yang Y, et al. Intensified association between waist circumference and hypertension in abdominally overweight children. Obes Res Clin Pract 2016;10:24–32. [DOI] [PubMed] [Google Scholar]
- [24].Cicero AF, Derosa G. Are there mild and serious metabolic syndromes? The need for a graded diagnosis. J Cardiovasc Med (Hagerstown) 2014;15:759–60. [DOI] [PubMed] [Google Scholar]
- [25].McEniery CM, Wilkinson IB, Avolio AP. Age, hypertension and arterial function. Clin Exp Pharmacol Physiol 2007;34:665–71. [DOI] [PubMed] [Google Scholar]
- [26].Joshi MD, Ayah R, Njau EK, et al. Prevalence of hypertension and associated cardiovascular risk factors in an urban slum in Nairobi, Kenya: a population-based survey. BMC Public Health 2014;14:1177. [DOI] [PMC free article] [PubMed] [Google Scholar]
- [27].Guimont C, Brisson C, Dagenais GR, et al. Effects of job strain on blood pressure: a prospective study of male and female white-collar workers. Am J Public Health 2006;96:1436–43. [DOI] [PMC free article] [PubMed] [Google Scholar]
- [28].Fan AZ, Strasser SM, Zhang X, et al. State socioeconomic indicators and self-reported hypertension among US adults, 2011 behavioral risk factor surveillance system. Prev Chronic Dis 2015;12:E27. [DOI] [PMC free article] [PubMed] [Google Scholar]
- [29].Liu L, Ding Y, Huang Z, et al. Ethnic and environmental differences in various markers of dietary intake and blood pressure among Chinese Han and three minority people of China: results from the WHO cardiovascular disease and alimentary comparison (CARDIC) study. Hypertens Res 2001;24:315–22. [DOI] [PubMed] [Google Scholar]
- [30].Jiang J, Zhang B, Zhang M, et al. Prevalence of conventional cardiovascular disease risk factors among Chinese Kazakh individuals of diverse occupational backgrounds in Xinjiang China. Int J Cardiol 2015;179:558–60. [DOI] [PubMed] [Google Scholar]
- [31].Centers for Disease Control Prevention (CDC). Racial/ethnic disparities in prevalence, treatment, and control of hypertension–United States. MMWR Morb Mortal Wkly Rep 2005;54:7–9. [PubMed] [Google Scholar]
- [32].Chen L, Smith GD, Harbord RM, et al. Alcohol intake and blood pressure: a systematic review implementing a Mendelian randomization approach. PLoS Med 2008;5:e52. [DOI] [PMC free article] [PubMed] [Google Scholar]
Associated Data
This section collects any data citations, data availability statements, or supplementary materials included in this article.