

ABSTRACT
Epidemiological studies have shown that humans with altered circadian rhythms have higher cancer incidence, with breast cancer being one of the most cited examples. To uncover how circadian disruptions may be correlated with breast cancer and its development, prior studies have assessed the expression of BMAL1 and PER2 core clock genes via RT-qPCR and western blot analyses. These and our own low-resolution data show that BMAL1 and PER2 expression are suppressed and arrhythmic. We hypothesized that oscillations persist in breast cancer cells, but due to limitations of protocols utilized, cannot be observed. This is especially true where dynamic changes may be subtle. In the present work, we generated luciferase reporter cell lines representing high- and low-grade breast cancers to assess circadian rhythms. We tracked signals for BMAL1 and PER2 to determine whether and to what extent oscillations exist and provide initial correlations of circadian rhythm alterations with breast cancer aggression. In contrast to previous studies, where no oscillations were apparent in any breast cancer cell line, our luminometry data reveal that circadian oscillations of BMAL1 and PER2 in fact exist in the low-grade, luminal A MCF7 cells but are not present in high-grade, basal MDA-MB-231 cells. To our knowledge, this is the first evidence of core circadian clock oscillations in breast cancer cells. This work also suggests that circadian rhythms are further disrupted in more aggressive/high tumor grades of breast cancer, and that use of real time luminometry to study additional representatives of breast and other cancer subtypes is merited.
KEYWORDS: Breast cancer, circadian rhythms, luminescent reporters, rhythmicity, computational analysis
Introduction
Circadian rhythms are biological changes that follow a daily cycle, responding primarily to light and darkness in an organism’s environment. Their disruption has been associated with increased risk of several cancers, including breast[1]. Circadian rhythms are regulated by a molecular circadian clock comprising CLOCK, BMAL, PER, and CRY proteins. Oscillations of these and ancillary circadian genes have been found to be arrhythmic/absent in several disease models and tissues, including peripheral blood mononuclear cells from chronic myeloid leukemia[2], colorectal liver metastases[3], and prostate [4] and breast cancer cell lines [5–8]. In these cases, RT-qPCR, western blots, and immunohistochemistry were used to evaluate circadian changes. These assays generally result in less-detailed oscillation assessments because sampling frequency is typically 4–6 h and the experiment covers ~48 h; more time-points and collection over a longer duration are difficult to achieve. While similar studies reveal that high amplitude oscillations are present and can be tracked in non-cancerous MCF10A breast epithelial cells [6–10], they also suggest that core clock gene transcripts are present, but do not oscillate in breast cancer cell lines [6–9,11]. However, using these methods it is difficult to separate trends from background, especially in cases of subtle changes and low amplitudes, resulting in reduced accuracy of period and rhythmicity evaluations. To determine whether clocks oscillate in cancer, continuous tracking in living cells is needed. The use of reporter systems combined with luminometry can facilitate tracking of circadian oscillations at a higher resolution via data recording at shorter intervals over a longer period[12]. Increased data collection enables more accurate analyses of circadian parameters. While luminometry has been used to track circadian rhythms in plants, cyanobacteria, mice, and human cells[12], this work is the first instance of its use for tracking circadian rhythms in breast cancer models.
According to the 2017 American Cancer Society annual report, breast cancer is the most common cancer (30% of estimated new cancer cases) among women in the United States[13]. Breast cancers may be divided into four molecular subtypes based on gene expression profile: luminal A, luminal B, HER2+, and basal (or triple-negative), where tumor grade and aggressiveness are generally lowest in luminal A and highest in basal types[14]. We hypothesized that RT-qPCR-based analyses are insufficient to track circadian oscillations of breast cancer cells whose amplitudes are too low to discern changes. Furthermore, as circadian disruptions have been associated with disease severity, we also hypothesized that with higher breast tumor grade/aggressiveness, cellular circadian rhythms may be disrupted to a greater extent. To test these hypotheses, we used RT-qPCR and luminometry to track BMAL1 and PER2 transcription and western blots to confirm their levels of expression in two breast cancer cell lines, MCF7 (luminal A) and MDA-MB-231 (basal). By using the higher resolution luminometry technique, we find that circadian oscillations exist in low grade, luminal A MCF7 breast cancer cells, but not high grade, basal MDA-MB-231 cells.
Materials and methods
Cell culture
HEK293T and MCF7 cells were obtained from Prof. D. Joseph Jerry (Veterinary and Animal Sciences, UMass Amherst). MCF7 cells were characterized for expression of estrogen receptor and its signaling; both were mycoplasma tested prior to transfer via PCR Mycoplasma detection kit (AMB). MDA-MB-231 cells were obtained from Prof. Shelly Peyton (Chemical Engineering, UMass Amherst), which were evaluated for karyotype and mycoplasma, along with subtype confirmation via RNAseq prior to transfer. HEK293T cells were maintained in DMEM:F12 supplemented with 10% FBS and 1% penicillin-streptomycin. MCF7 and MDA-MB-231 cells were maintained in DMEM, supplemented with 10% FBS, 1% penicillin-streptomycin, and 1% L-glutamine. All media and supplements were from Gibco. Cells were incubated at 37°C under 5% CO2 atmosphere.
Synchronization of cells by serum shock
Cells were seeded in 35 mm culture dishes at 2 × 10⁵ cells/mL and incubated for 1–3 days. Confluent cells were washed with PBS (Gibco) and starved in DMEM media supplemented only with 1% L-glutamine for 12 h. Cells were then serum shocked using DMEM containing 50% FBS and 1% L-glutamine for 2 h.
RNA extraction and cDNA synthesis
Following synchronization, cells were washed with PBS and returned to starvation conditions with 1% penicillin-streptomycin. Cells were harvested with the first time point (T = 0) taken prior to serum shock, and every 4 h thereafter for 48 h. Total RNA was extracted via TRIzol Reagent (Gibco) according to manufacturer’s instructions (detailed protocols in Supporting Information).
Quantitative real-time PCR (RT-qPCR)
RT-qPCR was performed in 96-well plates. The reaction consisted of 100 ng cDNA, 10 μL iTaq universal SYBR Green Supermix (Biorad), 4 μM each forward and reverse primer (Integrated DNA Technologies), and RNAse-free water to 20 μL. Primer sequences are in Supporting Information. After brief centrifugation, samples were analyzed via CFX Connect real-time system (Biorad) programmed with an initial denaturation at 95°C for 3 min, followed by 40 cycles of 95°C denaturation for 10 s, and 60°C annealing/extension for 30 s. Relative BMAL1 and PER2 expression were determined by comparing Ct values of BMAL1 and PER2 to GAPDH (control) via 2∧ΔΔCt method[15]. Three biological replicates and three technical replicates per biological replicate were analyzed for each condition.
The Metacycle R package [16] (https://cran.r-project.org/package=MetaCycle) was used to determine whether recordings were rhythmic in the circadian range. Default ranges were used for period (20–28 h) and the Bonferroni method was used to combine p-values from the three tests (Lomb-Scargle, ARSER, and JTK_Cycle).
Lentiviral transductions
2.5 x 10⁶ HEK293T cells were seeded in 60 mm culture dishes and transiently transfected with 3 μg psPAX packaging plasmid, 2 μg pMD2G envelope plasmid, and 3 μg BMAL1:luc or PER2:luc reporter constructs using Lipofectamine3000 (ThermoScientific) according to manufacturer’s instructions. Plasmid details are in Supporting Information. Lentiviral particles were harvested from supernatant and passed through a 45 μm filter. 9 mL lentivirus-containing supernatant was combined with 9 mL DMEM culture media (with all growth supplements) containing 10 μg/mL polybrene (Sigma). MCF7 (passage 11) and MDA-MB-231 (passage 16) cells were seeded in T25 culture flasks at 2 × 10⁵ cells/mL and incubated under standard conditions until 70–80% confluence was reached. Culture media was then removed, and 6 mL lentivirus-containing media added to each flask. After two days of infection, media was replaced with selection media (DMEM with all growth supplements plus 4 μg/mL puromycin) to obtain stably transfected cells. All cells were incubated at 37°C under 5% CO2 atmosphere.
Bioluminescence recording
Cells were seeded in 35 mm culture dishes at 2 × 10⁵ cells/mL and incubated for 2–3 days. Then, cells were starved and serum shocked as above. After 2 h synchronization, media was replaced with recording media consisting of 0.0135 g/mL solid DMEM (Sigma), 1% HEPES, 1% penicillin/streptomycin, 1% sodium pyruvate, 5% FBS, and 0.5 mM luciferin (ThermoScientific). Dishes were sealed with 40 mm sterile cover glass using silicon vacuum grease and subjected to continuous monitoring using a LumiCycle 32 Instrument (Actimetrics) at 36.5°C. Cells were not used at higher than passage 16 for MCF7 cells and passage 20 for MDA-MB-231.
Bioluminescence recordings were pre-processed to remove the initial transient (24 hours) and spikes. Each spike (any value more than 1/3rd of the data range higher than that of the value at the preceding time step) was replaced with the average of the values of the preceding and succeeding time steps. To determine if a recording was rhythmic, we applied an FFT-based test [17] to the time-series after removing a quadratic trend. Rhythmic time-series were de-noised and de-trended using the maximum overlap discrete wavelet transform (12-tap symmlet) with reflective boundary condition (WMTSA Matlab package written by Charles Cornish implementing previously published methods [18]), retaining the signal in the circadian band (periods of 21.33–42.67 h). Periods of the smoothed data were estimated using a continuous wavelet analysis (WAVOS Matlab package [19]), choosing the Morlet wavelet, excluding edge data, with a tuning parameter eta of 5, looking for a period within the range of 6–60 hours.
Western blot
MCF7 and MDA-MB-231 cells were cultured until confluent, and harvested using RIPA buffer (150 mM NaCl, 1% Triton X-100, 0.5% sodium deoxycholate, 0.1% sodium dodecyl sulfate (SDS), 50 mM Tris, pH 8.0, and freshly prepared 1% Halt™ Protease and Phosphatase Inhibitor (ThermoFisher)). Cell lysates were agitated for 30 min at 4°C and centrifuged at room temperature at 12,000 rpm for 20 min. Total cellular protein concentration was quantified via BCA Protein Assay Kit (ThermoFisher). 10 µg protein per sample was separated via 8% SDS polyacrylamide gel and transferred to PVDF membrane (ThermoFisher). Membrane was blocked with 5% (w/v) bovine serum albumin (BSA) in TBST (150 mM NaCl, 20 mM Tris-HCl, 0.1% Tween 20), incubated with primary antibodies against BMAL1 (Cell Signaling, cat no. 14020S), PER2, and GAPDH (Proteintech, cat no. 20,359–1-AP and 10,494–1-AP, respectively) overnight at 4°C, washed with TBST, and incubated with horseradish peroxidase-conjugated goat-anti-rabbit IgG secondary antibody (ThermoFisher) for 1 h at room temperature. Immunoblots were imaged using an enhanced chemiluminescence system (ECL; ThermoFisher) and a G:Box iChemi XT imaging system (GeneSys). Band intensities were analyzed via ImageJ.
Results and discussion
To confirm prior studies [6,7,11], we obtained RT-qPCR data tracking BMAL1 and PER2 in MCF7 and MDA-MB-231 cells. While both transcripts were present and detectable (Figure 1), oscillations were not rhythmic in the circadian range (p > 0.05 using Metacycle). To evaluate circadian rhythms in a more detailed manner to reveal subtle changes, we elected to employ luciferase reporters. This method has been used to provide high resolution oscillations in a variety of models [1,12], but not in breast cancer.
Figure 1.
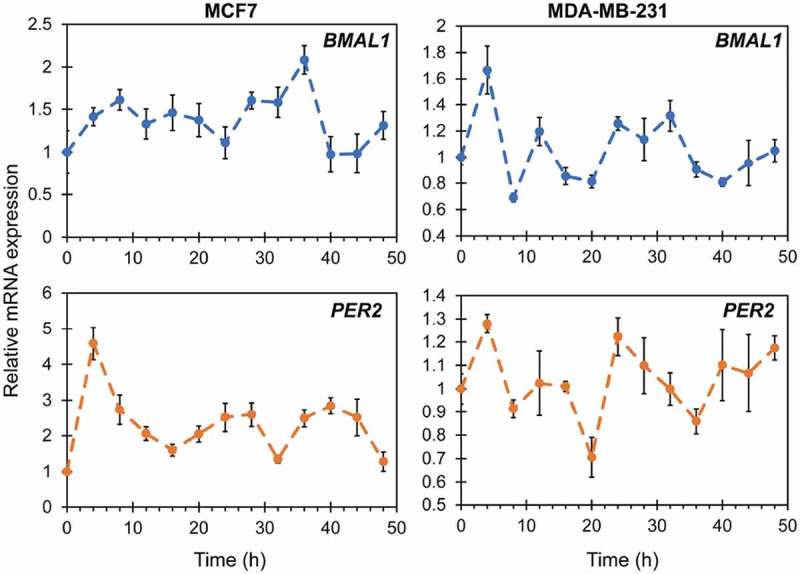
RT-qPCR of BMAL1 and PER2 expression in MCF7 (left) and MDA-MB-231 (right) cells. Oscillations do not occur in a rhythmic manner (Metacycle rhythmicity test p > 0.05). Each point represents the average of three biological replicates, with three technical replicates each. Error bars represent relative errors.
To test our hypothesis that RT-qPCR approaches, which do not facilitate frequent sampling, may not capture low amplitude oscillations, we separately stably transfected BMAL1:luc and PER2:luc into MCF7 cells (Figure S1A, S1B). Subsequent luminometry experiments revealed that circadian oscillations of both BMAL1:luc and PER2:luc persisted with a typical antiphase relationship (Figure 2, Figure S2). The trend in the raw bioluminescence time-series was negatively sloped and curving, and therefore appeared to be quadratic or exponential. Removal of a quadratic (Figure 2A,B) or exponential (Figure S3) trend leads to qualitatively similar curves. An FFT-based test confirmed rhythmicity (p < 0.05) [17] for all BMAL1:luc and 11 of 12 PER2:luc experiments. To further quantify rhythms, we used continuous wavelet analysis to estimate the period of each recording over time, and computed the mean over time to yield a single period estimate for each recording. For data shown in Figure 2, period estimate ranges were 22.5–23.2 h for BMAL1:luc and 22.1–23.6 h for PER2:luc. For the eight additional recordings (Figure S2) the ranges are wider (22.4–25.2 h for BMAL1:luc and 18.7–23.3 h for PER2:luc). All period data are reported in Table S1 and S2. These results stand in contrast with RT-qPCR analyses, which suggest that circadian clock gene expression is arrhythmic in breast cancer cells.
Figure 2.
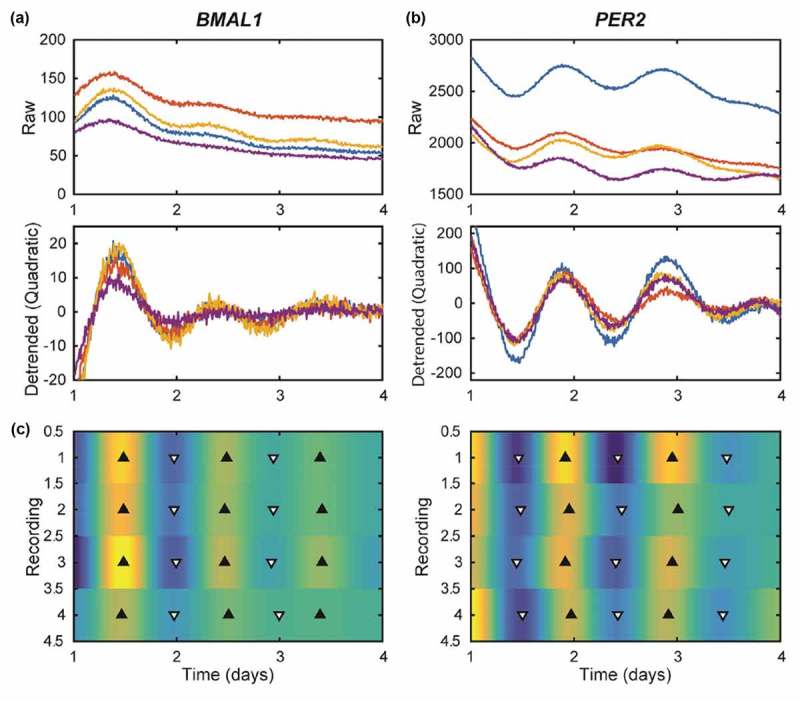
MCF7-BMAL1:luc (A) and PER2:luc (B) recordings have damped, anti-phase rhythms. Shown are time-series in raw form (top), with a quadratic trend removed (middle), and with the trend and noise removed by discrete wavelet analysis shown as a heat map (C). For (A) and (B) each color represents a different sample/recording. The heat map indicates luminescence for each recording (N = 4) with peaks (black triangles) and troughs (white triangles). Rhythms are clear, but lose amplitude over time. As expected in a functioning clock, peak times for PER2:luc are consistent and are 12 h out of phase with those of BMAL1:luc. Results from additional experiments are in Figure S2.
To test our hypothesis that breast tumors of higher grade/aggressiveness may possess more disrupted cellular circadian rhythms, we stably transfected BMAL1:luc and PER2:luc separately into triple negative/basal MDA-MB-231 cells (Figure S1C and S1D). The luminometry data from these highly aggressive cells revealed no visually detectable oscillations (Figure 3, Figure S4), even after removal of either a quadratic (Figure 3) or exponential (Figure S5) trend. Very few statistically significant oscillations were observed (FFT-based test for rhythmicity yielded p < 0.05 for only 1 of 12 BMAL1:luc and 3 of 12 PER2:luc recordings)[17]. In addition to assessing transcriptional activities of BMAL1 and PER2 in both cancer cell lines, we examined overall protein expression levels (Figure 4). Our western blot data indicates the presence of BMAL1 and PER2, albeit at fairly low levels.
Figure 3.
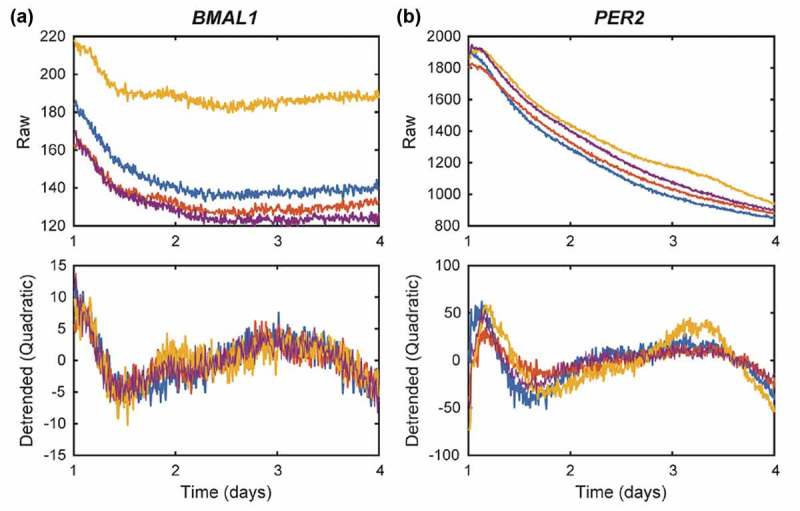
MDA-MB-231-BMAL1:luc (A) and PER2:luc (B) recordings reveal no circadian rhythms. Shown are time-series in raw form (top) and with a quadratic trend removed (bottom). Visual inspection and an FFT-based test for rhythmicity confirm there are no circadian rhythms in these recordings. Each color represents a different sample/recording. Results from additional experiments are in Figure S3.
Figure 4.
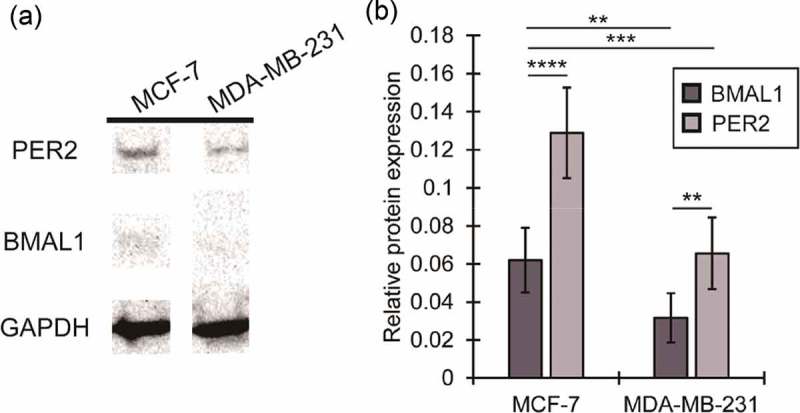
Expression of core clock proteins BMAL1 and PER2 in MCF7 and MDA-MB-231 cells. Representative western blot showing PER2 and BMAL1 expression in MCF7 and MDA-MB-231 cells. Western blots were obtained for two biological replicates with three technical replicates each. In both cases, GAPDH was used as a loading control.
The subtype-defining molecular differences between MCF7 and MDA-MB-231 cell lines are presence of estrogen receptor (ER) and progesterone receptor (PR) in the former. We hypothesize that the ER-E2 pathway may contribute to the circadian oscillations present in MCF7 cells. Studies have shown that cellular treatment with 17β-estradiol (E2) and progesterone (P4), the ligands for ER and PR, can affect circadian oscillations in normal cells expressing these receptors[20]. It has also been shown that E2 treatment can enhance expression of BMAL1, CLOCK, PER1, and PER2 [11,21,22]. Concurrently, the lack of ER/PR in MDA-MB-231 cells may play a role in the absence of rhythmic patterns. Future studies will examine additional ER-positive and other breast cancer cells to evaluate whether results obtained here remain consistent.
Another difference between MCF7 and MDA-MB-231 cells occurs in terms of epidermal growth factor receptor (EGFR) status[23]. MDA-MB-231 cells express EGFR to a greater degree than do MCF7 cells. Following activation via EGF, the EGFR cascade’s downstream pathways, including Ras/MAPK and PI3K/mTOR[24], have been shown to disrupt circadian rhythms via period alteration or clock gene suppression [25,26]. This may also be a cause of the arrhythmic oscillations observed in MDA-MB-231 cells. In the future, the role of EGFR in the circadian network should be further assessed.
Based on the data obtained, we conclude that while RT-qPCR assessments tracking endogenous mRNA levels are useful in some systems, they may not be sufficient for tracking low amplitude, subtle circadian oscillations in cancer or other cells. Additionally, we show that the clock is not arrhythmic in all breast cancers, as had previously been posited. Furthermore, via assessment of MDA-MB-231 cells, we provide initial evidence that circadian rhythms of both positive (BMAL1) and negative (PER2) components of the clock are further disrupted in diseases of increased tumor grade. Our results indicate that studies in additional representatives of breast cancer subtypes is highly merited.
Funding Statement
H.-H. L. was supported by a University of Massachusetts Amherst Chemistry-Biology Interface (CBI) training fellowship. J. J. F. was supported by an Honors Research Grant from the Commonwealth Honors College, University of Massachusetts Amherst. M. Q. received funding and S. R. T. received travel support from the Office of the Provost of Colby College.
Acknowledgments
We acknowledge Prof. Tanya Leise (Mathematics and Statistics, Amherst College) and Prof. D. Joseph Jerry (Veterinary and Animal Sciences, UMass Amherst) for helpful comments on the manuscript. We thank Prof. Jungwoo Lee (Chemical Engineering, UMass Amherst) for plate reader and Prof. Elizabeth Vierling (Biochemistry and Molecular Biology, UMass Amherst) for gel documentation system access.
Disclosure statement
No potential conflict of interest was reported by the authors.
Supplementary material
Supplemental data for this article can be accessed on the publisher’s website.
References
- [1].Lin H, Farkas ME.. Altered circadian rhythms and breast cancer : from the human to the molecular level. Front Endocrinol (Lausanne). 2018;9:1–9. [DOI] [PMC free article] [PubMed] [Google Scholar]
- [2].Rahman S, Nedhi A, Gmati G, et al. Differential expression of circadian genes in leukemia and a possible role for sirt1 in restoring the circadian clock in chronic myeloid leukemia. J Circadian Rhythms. 2017;15:1–13. [DOI] [PMC free article] [PubMed] [Google Scholar]
- [3].Huisman SA, Oklejewicz M, Ahmadi AR, et al. Colorectal liver metastases with a disrupted circadian rhythm phase shift the peripheral clock in liver and kidney. Int J Cancer. 2015;136:1027–1032. [DOI] [PubMed] [Google Scholar]
- [4].Cao Q, Gery S, Dashti A, et al. A role for the clock gene, Per1 in Prostate Cancer. Cancer Res. 2009;69:7619–7625. [DOI] [PMC free article] [PubMed] [Google Scholar]
- [5].Savvidis C, Koutsilieris M.. Circadian rhythm disruption in cancer biology. Mol Med. 2012;18:1249–1260. [DOI] [PMC free article] [PubMed] [Google Scholar]
- [6].Gutiérrez-Monreal MA, Treviño V, Moreno-Cuevas JE, et al. Identification of circadian-related gene expression profiles in entrained breast cancer cell lines. Chronobiol Int. 2016;33:392–405. [DOI] [PubMed] [Google Scholar]
- [7].Xiang S, Mao L, Duplessis T, et al. Oscillation of clock and clock controlled genes induced by serum shock in human breast epithelial and breast cancer cells: regulation by melatonin. Breast Cancer Basic Clin Res. 2012;6:137–150. [DOI] [PMC free article] [PubMed] [Google Scholar]
- [8].Chacolla-Huaringa R, Moreno-Cuevas J, Trevino V, et al. Entrainment of Breast Cell Lines Results in Rhythmic Fluctuations of microRNAs. Int J Mol Sci. 2017;18:1–19. [DOI] [PMC free article] [PubMed] [Google Scholar]
- [9].Rossetti S, Esposito J, Corlazzoli F, et al. Entrainment of breast (cancer) epithelial cells detects distinct circadian oscillation patterns for clock and hormone receptor genes. Cell Cycle. 2012;11:350–360. [DOI] [PMC free article] [PubMed] [Google Scholar]
- [10].Lin H-H, Qraitem M, Lian Y, et al. Analyses of Bmal1 and Per2 oscillations in a model of breast cancer reveal changes with malignancy. Integr Cancer Ther. 2019;18:1–13. [DOI] [PMC free article] [PubMed] [Google Scholar]
- [11].Rossetti S, Corlazzoli F, Gregorski A, et al. Identification of an Estrogen-Regulated Circadian Mechanism Necessary for Breast Acinar Morphogenesis. Cell Cycle. 2012;11:3691–3700. [DOI] [PMC free article] [PubMed] [Google Scholar]
- [12].Welsh DK, Imaizumi T, Kay SA. Real-time reporting of Circadian-regulated gene expression by luciferase imaging in plants and mammalian cells. Methods Enzymol. 2005;393:269–288. [DOI] [PubMed] [Google Scholar]
- [13].American Cancer Society Cancer Facts & Figures 2018. Atlanta: American Cancer Society; 2018. [Google Scholar]
- [14].Dai X, Li T, Bai Z, et al. Breast Cancer Intrinsic Subtype Classification, Clinical Use and Future Trends. Am J Cancer Res. 2015;5:2929–2943. [PMC free article] [PubMed] [Google Scholar]
- [15].Livak KJ, Schmittgen TD. Analysis of relative gene expression data using real-time quantitative PCR and the 2−ΔΔCT Method. Methods. 2001;25:402–408. [DOI] [PubMed] [Google Scholar]
- [16].Wu G, Anafi RC, Hughes ME, et al. MetaCycle: an integrated R package to evaluate periodicity in large scale data. Bioinformatics. 2016;32:3351–3353. [DOI] [PMC free article] [PubMed] [Google Scholar]
- [17].Leise TL, Wang CW, Gitis PJ, et al. Persistent cell-autonomous circadian oscillations in fibroblasts revealed by six-week single-cell imaging of PER2:: lUCBioluminescence. PLoS One. 2012;7:1–10. [DOI] [PMC free article] [PubMed] [Google Scholar]
- [18].Percival DB, Walden AT. Wavelet methods for time series analysis. Cambridge: Cambridge University Press; 2000. [Google Scholar]
- [19].Harang R, Bonnet G, Petzold LR. WAVOS: a MATLAB toolkit for wavelet analysis and visualization of oscillatory systems. BMC Res Notes. 2012;5:163. [DOI] [PMC free article] [PubMed] [Google Scholar]
- [20].Nakamura TJ, Sellix MT, Menaker M, et al. Estrogen directly modulates circadian rhythms of PER2 expression in the uterus. Am J Physiol Endocrinol Metab. 2008;295:E1025–31. [DOI] [PMC free article] [PubMed] [Google Scholar]
- [21].Gery S, Virk RK, Chumakov K, et al. The clock gene per2 links the circadian system to the estrogen receptor. Oncogene. 2007;26:7916–7920. [DOI] [PubMed] [Google Scholar]
- [22].Xiao L, Chang AK, Zang M-X, et al. Induction of the CLOCK Gene by E2-ERα signaling promotes the proliferation of breast cancer cells. PLoS One. 2014;9:e95878. [DOI] [PMC free article] [PubMed] [Google Scholar]
- [23].Subik K, Lee J-F, Baxter L, et al. The expression patterns of ER, PR, HER2, CK5/6, EGFR, Ki-67 and AR by Immunohistochemical analysis in breast cancer cell lines. Breast Cancer (Auckl). 2010;4:35–41. [PMC free article] [PubMed] [Google Scholar]
- [24].Wee P, Wang Z. Epidermal growth factor receptor cell proliferation signaling pathways. Cancers (Basel). 2017;9:1–45. [DOI] [PMC free article] [PubMed] [Google Scholar]
- [25].Relogio A, Thomas P, Paula M-P, et al. Ras-mediated deregulation of the circadian clock in cancer. PLOS Genet. 2014;10:e1004338. [DOI] [PMC free article] [PubMed] [Google Scholar]
- [26].Matsumoto CS, Almeida LO, Guimarães DM, et al. PI3K-PTEN Dysregulation Leads to mTOR-driven upregulation of the core clock gene BMAL1 in normal and malignant epithelial cells. Oncotarget. 2016;7:42393–42407. [DOI] [PMC free article] [PubMed] [Google Scholar]
Associated Data
This section collects any data citations, data availability statements, or supplementary materials included in this article.