Abstract
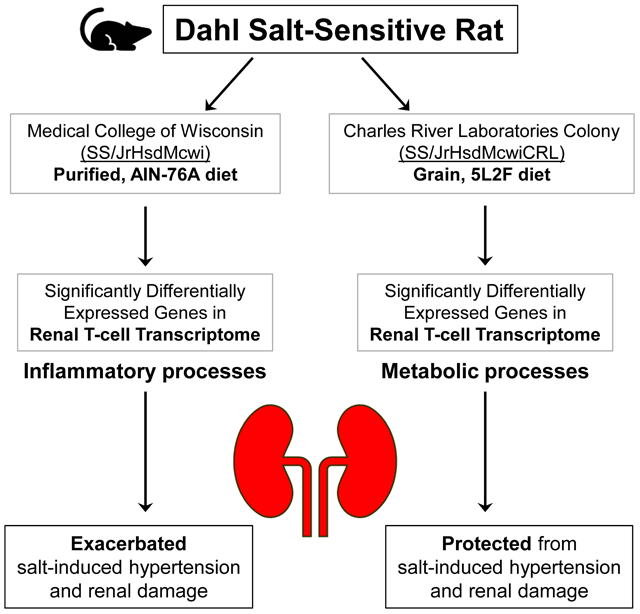
The Dahl salt-sensitive (SS) rat is an established model of salt-sensitive hypertension and renal damage. In addition to salt, other dietary components were shown to be important determinants of hypertension in SS rats. With previous work eliminating the involvement of genetic differences, grain-fed SS rats from Charles River Laboratories (SS/CRL; 5L2F/5L79) were less susceptible to salt-induced hypertension and renal damage compared to purified diet-fed SS rats bred at the Medical College of Wisconsin (SS/MCW; 0.4% NaCl, AIN-76A). With the known role of immunity in hypertension, the present study characterized the immune cells infiltrating SS/MCW and SS/CRL kidneys via flow cytometry and RNA sequencing in T-cells isolated from the blood and kidneys of rats maintained on their respective parental diet or on 3 weeks of high salt (4.0% NaCl, AIN-76A). SS/CRL rats were protected from salt-induced hypertension (116.5±1.2 vs 141.9±14.4 mmHg), albuminuria (21.7±3.5 vs 162.9±22.2 mg/day), and renal immune cell infiltration compared to SS/MCW. RNA-seq revealed >50% of all annotated genes in the entire transcriptome to be significantly differentially expressed in T-cells isolated from blood versus kidney, regardless of colony or chow. Pathway analysis of significantly differentially expressed genes between low and high salt conditions demonstrated changes related to inflammation in SS/MCW renal T-cells compared to metabolism-related pathways in SS/CRL renal T-cells. These functional and transcriptomic T-cell differences between SS/MCW and SS/CRL show that dietary components in addition to salt may influence immunity and the infiltration of immune cells into the kidney, ultimately impacting susceptibility to salt-induced hypertension and renal damage.
Keywords: salt-sensitivity, hypertension, renal damage, diet, T-cells, transcriptome
Graphical Abstract
Introduction
High blood pressure is a major risk factor for the development of cardiovascular disease (CVD), with 46% of the US population estimated to have hypertension1. Of these 116.4 million adults, approximately 30–50% exhibit salt-sensitive hypertension2, 3. In African Americans, salt-sensitivity prevalence is greatly exaggerated (~75%) and may contribute to the increased mortality seen in African Americans with hypertension4, 5.
One experimental model of salt-sensitive hypertension is the Dahl salt-sensitive (SS) rat, which recapitulates the hypertensive and renal disease phenotype similarly observed in African American salt-sensitive, hypertensive populations6. Dahl SS rats bred at the Medical College of Wisconsin (SS/MCW) are maintained on a highly purified, casein-based diet (AIN-76A, Dyets Inc)7. In 2001, SS/MCW rats were sent to Charles River Laboratories (SS/CRL) where they have been maintained on a 0.75% NaCl grain-based diet (5L2F/5L79, LabDiet). Interestingly, SS/CRL rats are remarkably protected from salt-induced increases in mean arterial pressure (MAP) and albuminuria compared to SS/MCW rats fed the casein-based diet8. Previous RNA-seq data yielded 8× coverage for 172,301,707 nucleotides, and although 102 single nucleotide variations were found between the SS/MCW and SS/CRL (0.00001%), embryo transfer experiments demonstrated this protection in SS/CRL to be independent of this minor genetic drift8. Additional studies by our group demonstrated that the differences in the severity of salt-sensitive hypertension is mediated by dietary components other than salt9-11.
Previous work in our laboratory has shown a salt-induced infiltration of T-cells into Dahl SS kidneys, where T-cell activation is necessary for the amplification of hypertension and renal disease12, 13. Our recent studies have demonstrated the importance of the dietary protein source in determining disease severity, which is largely driven by immune mechanisms11, 14. Given the contribution of diet and immunity, the current study hypothesized that grain-fed SS/CRL rats would have an altered renal infiltrating immune cell profile compared to SS/MCW rats as determined by flow cytometry, with potential functional differences explored utilizing an RNA sequencing approach.
Methods
The authors declare that all supporting data are available within the article and its online supplementary files. Additionally, all RNA sequencing data generated from these studies have been made publicly available in NCBI’s Gene Expression Omnibus15 and can be accessed at (https://www.ncbi.nlm.nih.gov/geo/query/acc.cgi?acc=GSE127000).
Animals and Diets.
Experiments were performed on age-matched, inbred, male Dahl SS rats obtained from 2 colonies maintained on different diets. Inbred SS/JrHsdMcwi rats (denoted SS/MCW) have been maintained as a closed colony at the Medical College of Wisconsin since 1991 and fed a 0.4% NaCl purified casein-based AIN-76A diet (#113755, Dyets Inc). Breeding pairs from this colony were sent to Charles River Laboratories (SS/JrHsdMcwiCrl) in 2001 (denoted SS/CRL) and maintained on a 0.75% NaCl grain diet (5L2F/5L79, LabDiet). The AIN-76A and 5L2F diets are composed of approximately the same percentage of protein (18%), carbohydrates (60–65%), fat (5%), and fiber (4–5%). Comparison of additional components include arginine (6.26g/100g AIN-76A versus 1.16g/100g 5L2F), potassium (3.61g/kg versus 9.5g/kg), and calcium (5.26g/kg versus 8.5g/kg) content. Both groups of rats were maintained on their respective parental diets (SS/MCW – AIN-76A and SS/CRL – 5L2F) from weaning through 7 weeks of age, where all rats were then switched to the high salt (4.0% NaCl) casein-based AIN-76A diet (#113756, Dyets Inc) for 3 weeks. Control rats were kept on the parental diet throughout the entire 10-week experiment. A detailed schematic of the rats and their diets can be found in Figure S1A. All protocols were approved by the Medical College of Wisconsin Institutional Animal Care and Use Committee (IACUC).
A detailed description of all other methods can be found in the Online Supplement.
Results
SS/CRL rats are significantly protected from the development of salt-sensitive hypertension, renal damage, and immune cell infiltration and activation.
At baseline, no differences in mean arterial pressure (MAP) or renal damage indices were observed between SS/MCW and SS/CRL rats. However, after just 3 days of high salt challenge and throughout the 3-week HS period, SS/CRL demonstrated significantly lower MAP compared to SS/MCW (116.5±1.2 vs 141.9±14.4 mmHg, SS/CRL vs SS/MCW at HS21, Figure 1A). Systolic arterial pressure (SAP), diastolic arterial pressure (DAP), as well as body weights can be found in Figure S2. Shown in Figure 1C, this reduction in hypertension corresponded with drastically lower albuminuria (21.7±3.5 vs 162.9±22.2 mg/day) and proteinuria (85.0±6.6 vs 325.3±35.44 mg/day). Although daily sodium intake and output was not directly measured, and is considered to be a limitation of the current study, these protections observed in the SS/CRL compared to SS/MCW occurred without differences in overall urinary sodium excretion (15.3±0.4 vs 14.7±0.7 mEq/day, SS/CRL vs SS/MCW, Figure 1B; weekly urinary sodium excretion can be found in Figure S2C). While analysis of the immune cell profile in the blood revealed no differences between the two groups (Figure 1D), there were significantly fewer immune cells infiltrating the kidneys of SS/CRL than SS/MCW. Demonstrated in Figure 1E, there were fewer total CD45+ leukocytes (47.3% reduction in SS/CRL vs SS/MCW), CD11b/c+ monocytes and macrophages (45.9%), CD3+ T-cells (52.4%) and CD45R+ B-cells (77.7%).
Figure 1. Grain-fed SS/CRL rats demonstrate attenuated salt-induced hypertension, renal damage, and renal immune cell infiltration compared to casein-fed SS/MCW.
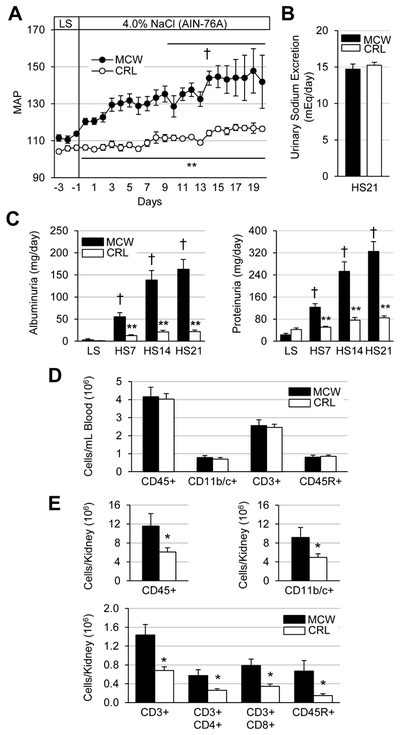
(A) Summarized daily mean arterial pressure (MAP, mmHg) during the baseline, low salt (LS) period through 21 days of high salt challenge (4.0% NaCl AIN-76A). (B) Equivalent urinary sodium excretion between SS/MCW and SS/CRL after 21 days of high salt (HS). (C) Indicative of protection from renal damage, albuminuria and proteinuria were significantly reduced in SS/CRL rats compared to SS/MCW. (D) Similar circulating immune cell profile between SS/MCW and SS/CRL rats. (E) Significantly fewer renal infiltrating immune cells in SS/CRL kidneys compared to SS/MCW. CD45: leukocytes, CD11b/c+: monocyte/macrophages, CD3+: T-cells, CD4+: helper T-cells, CD8+: cytotoxic T-cells, CD45R+: B-cells. n=5-7, †p<0.05 vs LS Day 0, *p<0.05 and **p<0.001 vs SS/MCW.
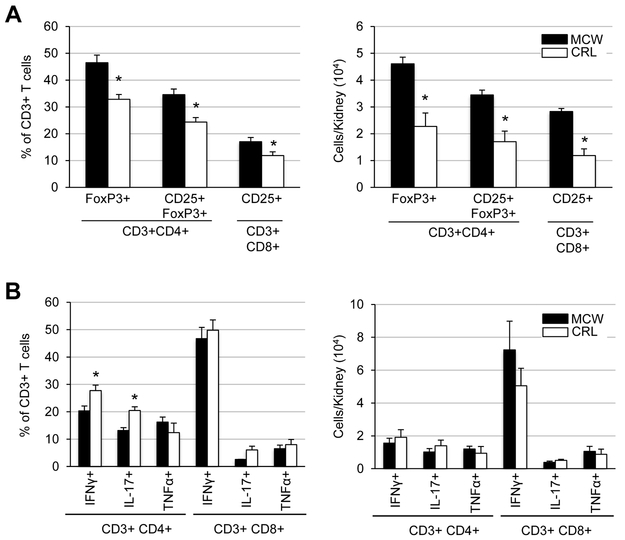
Upon analysis of the activation status of the infiltrating helper and cytotoxic T-cells (Figure 2A), there was a reduction in both the percentage (24.3±1.7 vs 34.6±2.1%) and number (1.7±0.4 vs 3.4±0.2 × 10⁴ cells/kidney) of activated T regulatory cells (CD3+CD4+CD25+FoxP3+) in SS/CRL kidneys compared to SS/MCW. Similar reduction was seen in percentage (11.8±1.4 vs 17.0±1.6%) and number (1.2±0.2 vs 2.8±0.1 × 10⁴ cells/kidney) of activated cytotoxic T-cells (CD3+CD8+CD25+). Despite the apparent SS/CRL protection from renal immune cells recruitment and activation, intracellular cytokine staining of T-cells interestingly revealed nearly similar capacities of SS/MCW and SS/CRL T-cells to produce cytokines IFNγ, IL-17, and TNFα in response to PMA-ionomycin stimulation (Figure 2B).
Figure 2. SS/MCW rats have more T regulatory cells and activated cytotoxic T-cells than SS/CRL, but no overt differences in PMA-ionomycin-stimulated cytokine production.
(A) After 3 weeks of high salt, there was a smaller percentage and fewer number of T-regulatory cells (CD3+CD4+CD25+FoxP3+) and activated cytotoxic T-cells (CD3+CD8+CD25+) in the protected SS/CRL rats. (B) In vitro stimulation of isolated T-cells with PMA-ionomycin and intracellular cytokine staining revealed similar capacities of SS/MCW and SS/CRL helper (CD4+) and cytotoxic (CD8+) T-cells to produce pro-inflammatory cytokines IFNγ, IL-17, and TNFα. n=4-6, *p<0.05 vs SS/MCW.
Nearly 2 out of every 3 annotated genes in the entire T-cell transcriptome are significantly differentially expressed when comparing T-cells isolated from the blood versus the kidney.
Due to the lack of an overt functional difference in the ability of the SS/MCW and SS/CRL T-cells to produce cytokines, we sought to more deeply assess gene expression differences by utilizing an RNA-seq approach. RNA-seq analysis was performed on both blood and kidney T-cells from SS/MCW and SS/CRL rats on their respective parental diets (LS) or the 4.0% NaCl AIN-76A chow (HS). Figure S3A contains the albuminuria data from these rats specifically used for RNA-seq purposes and counts of isolated T-cells are summarized in Figure S3B-D, demonstrating no significant changes in T-cell numbers in the blood, but a reduction in the number of T-cells isolated from SS/CRL kidneys compared to SS/MCW during HS.
Using a q-value<0.05 as the criteria for determining significance in differentially expressed genes (DEGs), the volcano plots in Figure 3A show >50% of all annotated genes were significantly differentially expressed when comparing T-cells isolated from the blood versus kidney within each experimental group. These numbers of genes are summarized in Figure 3B. Further investigation revealed a large number of these genes to be quiescent or “turned off” (FPKM=0) in blood T-cells but significantly differentially expressed or “turned on” in kidney T-cells (Figure 3C). Few genes had the same occur in the reverse (quiescent in the kidney but activated in blood), indicating a specific activation of these T-cells as they infiltrate into the kidney from the periphery.
Figure 3. On average, >50% of all annotated genes in the transcriptome are significantly differentially expressed in blood versus renal T-cells.
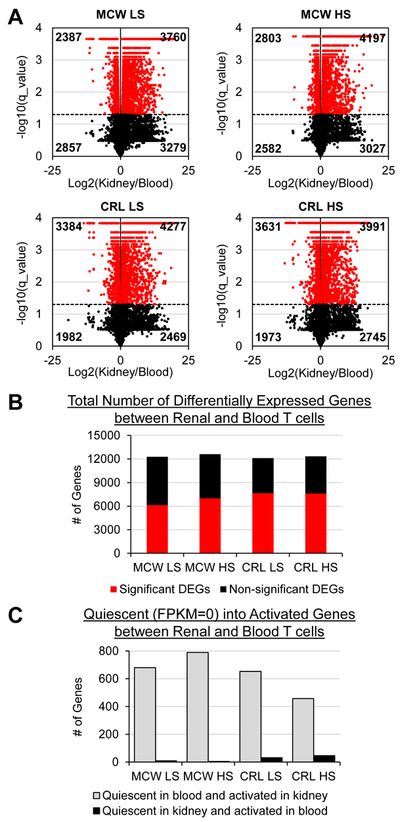
(A) Volcano plots demonstrating significantly up- and downregulated genes (red) when comparing blood versus kidney T-cells in MCW LS, MCW HS, CRL LS, and CRL HS treatment groups. (B) Summarized counts of significant (red) and non-significant (black) differentially expressed genes (DEGs) out of all 14,804 annotated genes. (C) Of the significant DEGs, a large proportion of genes could be considered ‘quiescent’ in the blood (FPKM=0) but activated in the kidney (significantly differentially expressed). n=4 pools/group, 3 rats/pool.
Greater number of differentially expressed genes (DEGs) responsive to high salt challenge in SS/CRL T-cells than SS/MCW.
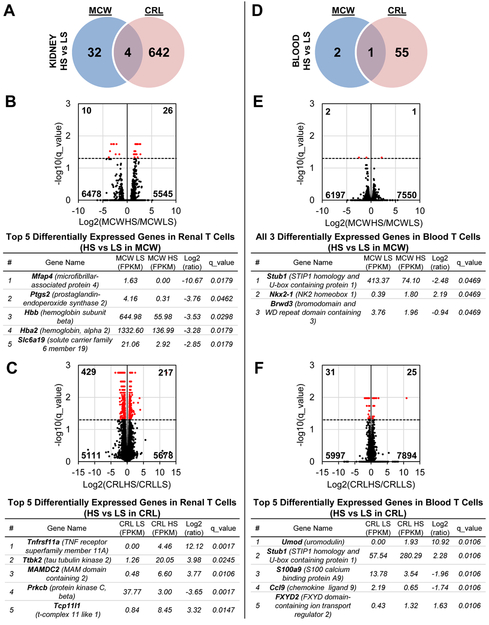
We first compared the effect of HS separately in the SS/MCW and SS/CRL rats. In infiltrating renal T-cells, there were more salt-induced changes in gene expression in SS/CRL rats (646 genes) compared to SS/MCW (36 genes), with only 4 overlapping genes (Slc6a19, Hba2, Hbb, and Spink1, Figure 4A). The top DEGs based on magnitude of absolute fold change in response to salt in SS/MCW and SS/CRL renal T-cells are listed in Figure 4B and C, respectively. In comparison to the changes in renal T-cells, there were far fewer overall genes changed in blood T-cells (Figure 4D). Significant salt-induced expression changes occurred in only 3 genes in SS/MCW and 56 genes in SS/CRL, with only a single gene overlapping (Stub1). The top DEGs between SS/MCW and SS/CRL blood T-cells are listed in Figure 4E and F, respectively. The full list of DEGs for these comparisons can be found in Table S1.
Figure 4. More DEGs responsive to high salt in T-cells from kidney than in blood, as well as in SS/CRL rats than SS/MCW.
(A) Venn diagram of all significant DEGs in kidney T-cells of SS/MCW and SS/CRL rats when comparing LS to HS in each group. Volcano plots demonstrating significantly up- and downregulated genes (red), and the top 5 DEGs for each group are listed in Panels (B) and (C). (D) Venn diagram of all significant DEGS in blood T-cells of SS/MCW and SS/CRL rats when comparing LS to HS in each group. Volcano plots and the top DEGs for each group are listed in Panels (E) and (F). n=4 pools/group, 3 rats/pool.
Salt modulates changes in genes related to inflammatory pathways in SS/MCW renal T-cells compared to metabolism-related pathways in SS/CRL.
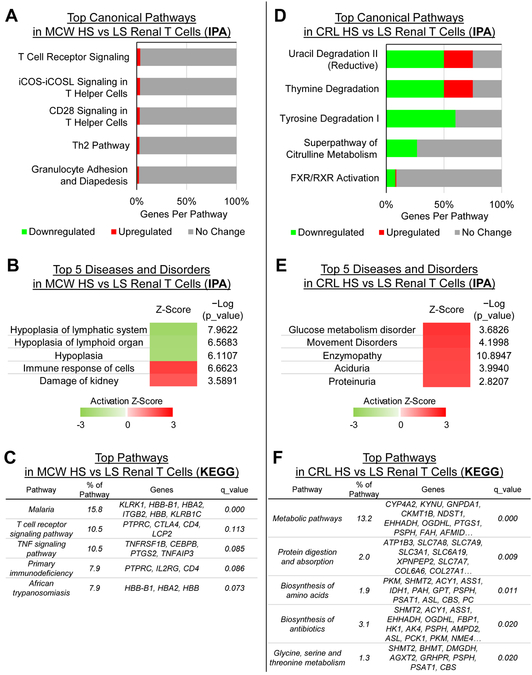
Ingenuity Pathway Analysis (IPA) was used to assess the function of the 36 salt-responsive DEGs in SS/MCW and 646 DEGs in SS/CRL in renal T-cells. As expected, the salt-responsive genes in SS/MCW renal T-cells showed an overrepresentation of canonical pathways related to T-cell receptor signaling (Figure 5A). IPA also assembled these genes into ‘Diseases and Disorders’, with the top five including the activation of lymph organ hyperplasia, immune responses, and kidney damage processes (Figure 5B). KEGG pathway analysis similarly showed an enrichment of immune-related pathways like T-cell Receptor and TNF signaling (Figure 5C). The 4 genes in the ‘T-cell receptor signaling pathway’ were utilized for qRT-PCR validation of the RNA-seq data and can be found in Figure S5A.
Figure 5. Functional analysis of DEGS by IPA or KEGG reveal enrichment of inflammatory pathways in SS/MCW renal T-cells compared to metabolism-related pathways in SS/CRL renal T-cells.
According to IPA, the canonical pathways (A) and ‘diseases and disorders’ (B) enriched in SS/MCW kidney T-cells were specifically related to inflammatory, T-cell signaling and kidney damage. KEGG pathways analysis confirmed this with enrichment in T-cell receptor and TNF signaling pathways (C). This highly contrasts the pathways enriched in SS/CRL renal T-cells, which were related primarily to metabolic processes, including nucleic acid, amino acid, and protein synthesis and metabolism (D-F). n=4 pools/group, 3 rats/pool.
Pathway enrichment analysis of the 646 salt-responsive genes in SS/CRL renal T-cells revealed a completely different functional profile. As opposed to the immune-specific pathways indicated by IPA for the SS/MCW renal T-cells, the changes in the SS/CRL renal T-cell transcriptome was enriched in metabolic pathways related to nucleic and amino acid production (Figure 5D and E). KEGG analysis confirmed that DEGs in SS/CRL renal T-cells were overrepresented in metabolic pathways related to amino acid and protein synthesis and utilization (Figure 5F). The complete list of genes within these top KEGG pathways can be found in Figure S4. The top 6 genes found within the KEGG ‘Metabolic pathways’ were also used for qRT-PCR validation of the RNA-seq data (Figure S5B). There were not enough DEGs in T-cells isolated from the blood to perform similar functional analyses.
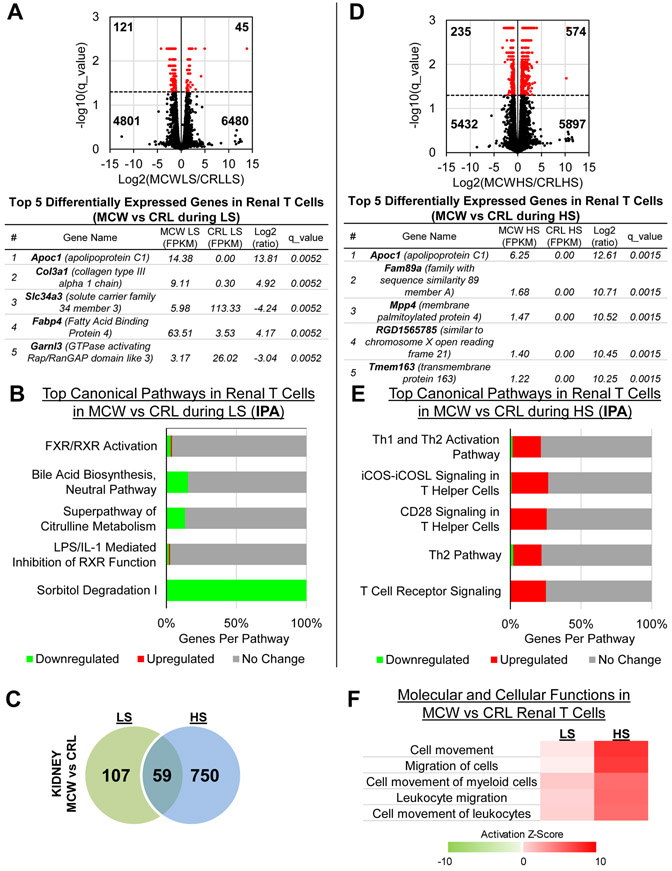
We also compared the genes that were differentially expressed between SS/MCW and SS/CRL while both groups were either on LS or HS. During LS, there were 166 genes that were significantly differentially expressed between SS/MCW and SS/CRL, with the top 5 genes based on magnitude of absolute fold change listed in Figure 6A. IPA analysis of these 166 genes revealed a downregulation in metabolism-related pathways in SS/MCW compared to SS/CRL renal T-cells during LS (Figure 6B). During HS, there were 809 genes that were significantly differentially expressed between SS/MCW and SS/CRL, with the top 5 genes listed in Figure 6D. There was an overlap of 59 genes that changed during both LS and HS when comparing SS/MCW versus SS/CRL (Figure 6C). Pathway analysis of the 809 DEGs revealed a specific enrichment in T-cell signaling pathways in SS/MCW versus SS/CRL during HS (Figure 6E). Shown in Figure 6F, there was a clear activation of migratory and homing mechanisms in the SS/MCW T-cells compared to SS/CRL, which was exacerbated after HS. Functional analysis of the same comparison was made in T-cells isolated from the blood (Figure S6), with the complete list of significantly DEGs for this SS/MCW versus SS/CRL comparison in Table S2.
Figure 6. Comparison of casein-fed SS/MCW and grain-fed SS/CRL renal T-cells during LS or HS.
(A) Volcano plot demonstrating significantly up- and downregulated genes (red) when comparing SS/MCW to SS/CRL renal T-cells during LS, and the top 5 DEGs. (B) Functional analysis by IPA of these DEGs showed downregulation of metabolism-related pathways in SS/MCW compared to SS/CRL. (C) Venn diagram of all significant DEGs in kidney T-cells during LS and HS when comparing SS/MCW to SS/CRL rats in each group. (D) Volcano plot demonstrating significantly up- and downregulated genes (red) when comparing SS/MCW to SS/CRL renal T-cells during HS, and the top 5 DEGs. (E) Functional analysis by IPA of these DEGs showed upregulation of inflammatory, T-cell signaling pathways in SS/MCW compared to SS/CRL during HS. (F) Heatmap indicating the activation of migratory and homing mechanisms in the SS/MCW T-cells compared to SS/CRL, which was exacerbated upon HS challenge. n=4 pools/group, 3 rats/pool.
Discussion
The study of SS rats and the effect of their commercial source on blood pressure is becoming of great interest to those in the field of hypertension16, as it can drastically impact the way results are interpreted. With the SS/CRL rats originally derived from the same source as the SS/MCW rats, the current study has demonstrated the influence of other non-sodium components of the diet in determining the extent of salt-sensitive disease development. It is widely accepted that diet is one of the top modifiable risk factors contributing to the development of cardiovascular disease, with a significant amount of observational evidence distinguishing the effect of animal versus plant protein consumption17. Compared to omnivores, vegetarians are shown to have lower blood pressure18, and additional studies have since indicated an inverse relationship between plant protein intake and blood pressure19-21, ultimately associating health benefits with greater plant protein consumption22,23. This coincides with observations made in the current study, as well as previous studies8, 11, where grain-fed SS/CRL rats are protected from the development of hypertension and renal damage compared to casein-fed SS/MCW rats.
Interestingly, pre-clinical evidence in a non-obese diabetic mouse model showed a wheat-based diet led to greater Th1-type and pro-inflammatory markers compared to soy or casein-based diets24. However, in a human trial comparing the consumption of whole versus refined grains, diets containing whole grain were considered to be inversely associated with inflammation25. In the current study, the protection of grain-fed SS/CRL rats from developing hypertension and renal damage corresponded with fewer immune cells infiltrating into the kidney after high salt. Given our previous work elucidating a specific role for T-cells12-14, closer inspection of T-cell subsets also demonstrated fewer T helper, cytotoxic, and T regulatory cells in SS/CRL kidneys. However, there appeared to be no overt functional difference in the ability of either SS/MCW or SS/CRL T-cells to produce cytokines in vitro. To take a more comprehensive look at potential functional differences between rat colony and T-cell compartment, we utilized an RNA-seq approach to determine overall changes in gene expression. Interestingly, examination of expression of key cytokines that define Th1 (IL-2, IFNγ, TNFα) and Th2 (IL-4, IL-5, IL-6, IL-10) did not reveal any major differences between the T-cells in SS/MCW versus SS/CRL during high salt. Instead, a pathway analysis of significant DEGs between salt conditions demonstrated changes related to inflammation in SS/MCW renal T-cells compared to metabolism-related pathways in SS/CRL renal T-cells. Our RNA-seq data revealed that the greatest change in SS/CRL T-cells was not inflammation related, perhaps indicating that the measurement of a few cytokines may be an inadequate method when trying to determine overall T-cell function.
With nearly 2 out of every 3 annotated genes were significantly differentially expressed between blood and kidney T-cells, these T-cells from different compartments hardly appear to even be of the same cell type, and demonstrate the importance of knowing what populations of cells are subject to downstream analyses. This is an especially critical point, particularly in the context of the number of human studies that focus on phenotypes observed in circulating mononuclear cells as a proxy for assessing target organ damage. Furthermore, there were far more significant changes in gene expression in the protected SS/CRL (646 genes) and only a handful of genes that changed in the disease-exacerbated SS/MCW (36 genes), perhaps indicating a functional defect in the SS/MCW T-cells to respond appropriately to insult. While functional insight into these gene changes by IPA and KEGG analysis revealed that the few DEGs in SS/MCW renal T-cells responded to salt in a predicted inflammatory manner, these minimal gene changes in T-cells from SS/MCW rats fed HS were somewhat contrary to previous observations made regarding the influence of elevated sodium intake on T-cells, particularly on genes like SGK1, NFAT5, IL-17, and IL-2326-28. Instead, the SS/CRL renal T-cells respond to HS by activating a whole host of non-inflammatory, metabolism-related pathways.
We recognize that there are innumerable differences between the AIN-76A and 5L79 diets; namely, differences in dietary potassium and calcium. These macrominerals have been documented to affect blood pressure and immune responses to high salt29, 30. Early-life exposure to this difference in micromineral consumption and its effect on disease progression in adulthood certainly warrants future investigation in our model. We further speculate that the parental diet and the dietary protein source may have direct programming effects on T-cell function, as we have previously shown influence of protein source on disease progression9. However, other T-cell-independent factors may also modulate blood pressure and renal injury. Future studies need to parse out these potential contributing factors and determine whether dietary changes in gene expression precede changes in blood pressure. Furthermore, since RNA-seq was performed in a separate group of animals where blood pressure was not measured, it remains to be seen whether undergoing this surgical procedure might influence the transcriptome. An additional limitation of the study is the exclusive focus on male rats; the importance of sex differences in T-cell transcriptome regulation should certainly be explored and is an exciting area for future investigation. Other follow-up studies might also include looking into specific differentially expressed genes, in particular those related to the metabolism pathways in the SS/CRL T-cells and assessing how these gene changes work in concert to create a functionally protective T-cell.
Multiple studies have utilized an RNA-seq approach to achieve in-depth, transcriptomic profiling of various renal pathological conditions, such as salt-sensitive hypertension, aging, and diabetic nephropathy31-34. The upregulation of genes and the enrichment of pathways involved with inflammation is shared across these pathologies. However, these transcriptome analyses have been performed in whole tissue (typically renal cortex and medulla), containing a vastly heterogenous population mixed with both various parenchymal and hematopoietic cells. Deep RNA sequencing of 14 different microdissected renal tubule segments has already provided strong evidence of the transcriptomic complexity and cell-type specificity that exists in the kidney35. Recent advances made by single-cell RNA-seq methodologies have further helped elucidate functional states and gene regulatory mechanisms of individual kidney cells36-38. As shown in our current study, even the same cell type (T-cells) isolated from different compartments (i.e., blood and kidney) can drastically differ in gene expression profile. While these kind of whole tissue RNAseq analyses are useful, this issue of cell-type heterogeneity will make data interpretation, and ultimately therapeutic application, incredibly difficult.
Perspectives
Our study has demonstrated that in addition to salt, other dietary components can modulate several phenotypes in the Dahl salt-sensitive rat, including the alteration of the severity of hypertension, renal damage, and immune cell infiltration. An RNA-seq approach was utilized to thoroughly assess how changes in immune cells, namely T-cells, at the molecular level could contribute to drastic differences in immune function, and ultimately, pathophysiology. These comprehensive transcriptomic results offer further understanding into the immune mechanisms that contribute to salt-sensitive hypertension and provide numerous avenues of future investigation.
Supplementary Material
Novelty and Significance.
- What Is New –
- SS/CRL rats fed a grain-based diet were protected from salt-induced hypertension, renal disease, and renal immune cell infiltration versus SS/MCW rats fed a purified diet, despite both colonies being challenged with the same high salt diet.
- Examination of potential immune function differences by RNA-seq analysis of T-cells revealed enrichment of genes in pathways related to metabolism in the protected, grain-fed SS/CRL rats, but inflammation-related mechanisms for disease-exacerbated, purified diet-fed SS/MCW rats.
What Is Relevant – Diet and immunity are established contributors to the progression of salt-sensitive hypertension and renal disease. These studies in a relevant, pre-clinical model of salt-sensitive hypertension provide new understanding of how dietary modifications can alter immunity and the severity of disease development.
Summary – Our study has demonstrated that in addition to salt, other dietary components can modulate several phenotypes in the Dahl salt-sensitive rat, including the alteration of the severity of hypertension, renal damage, and immune cell infiltration. Transcriptomic analysis of immune cells, namely T-cells, at the molecular level demonstrated changes that could contribute to differences in immune function, and ultimately, pathophysiology.
Acknowledgments
Sources of Funding
This work was supported by HL116264, HL137748, DK62803, AHA-15SFRN2391002, AHA-16POST29900004 and 1F32HL136161.
Footnotes
Disclosures
None.
References
- 1.Benjamin EJ, Virani SS, Callaway CW, Chamberlain AM, Chang AR, Cheng S, Chiuve SE, Cushman M, Delling FN, Deo R, de Ferranti SD, Ferguson JF, Fornage M, Gillespie C, Isasi CR, Jimenez MC, Jordan LC, Judd SE, Lackland D, Lichtman JH, Lisabeth L, Liu S, Longenecker CT, Lutsey PL, Mackey JS, Matchar DB, Matsushita K, Mussolino ME, Nasir K, O'Flaherty M, Palaniappan LP, Pandey A, Pandey DK, Reeves MJ, Ritchey MD, Rodriguez CJ, Roth GA, Rosamond WD, Sampson UKA, Satou GM, Shah SH, Spartano NL, Tirschwell DL, Tsao CW, Voeks JH, Willey JZ, Wilkins JT, Wu JH, Alger HM, Wong SS, Muntner P, American Heart Association Council on E, Prevention Statistics C, Stroke Statistics S. Heart disease and stroke statistics-2018 update: A report from the american heart association. Circulation. 2018;137:e67–e492 [DOI] [PubMed] [Google Scholar]
- 2.Weinberger MH. Salt sensitivity of blood pressure in humans. Hypertension. 1996;27:481–490 [DOI] [PubMed] [Google Scholar]
- 3.Lackland DT, Egan BM. Dietary salt restriction and blood pressure in clinical trials. Curr Hypertens Rep. 2007;9:314–319 [DOI] [PubMed] [Google Scholar]
- 4.Svetkey LP, McKeown SP, Wilson AF. Heritability of salt sensitivity in black americans. Hypertension. 1996;28:854–858 [DOI] [PubMed] [Google Scholar]
- 5.Weinberger MH, Miller JZ, Luft FC, Grim CE, Fineberg NS. Definitions and characteristics of sodium sensitivity and blood pressure resistance. Hypertension. 1986;8:II127–134 [DOI] [PubMed] [Google Scholar]
- 6.Bigazzi R, Bianchi S, Baldari D, Sgherri G, Baldari G, Campese VM. Microalbuminuria in salt-sensitive patients. A marker for renal and cardiovascular risk factors. Hypertension. 1994;23:195–199 [DOI] [PubMed] [Google Scholar]
- 7.Mattson DL, Kunert MP, Kaldunski ML, Greene AS, Roman RJ, Jacob HJ, Cowley AW, Jr. Influence of diet and genetics on hypertension and renal disease in dahl salt-sensitive rats. Physiol Genomics. 2004;16:194–203 [DOI] [PubMed] [Google Scholar]
- 8.Geurts AM, Mattson DL, Liu P, Cabacungan E, Skelton MM, Kurth TM, Yang C, Endres BT, Klotz J, Liang M, Cowley AW, Jr. Maternal diet during gestation and lactation modifies the severity of salt-induced hypertension and renal injury in dahl salt-sensitive rats. Hypertension. 2015;65:447–455 [DOI] [PMC free article] [PubMed] [Google Scholar]
- 9.Mattson DL, Meister CJ, Marcelle ML. Dietary protein source determines the degree of hypertension and renal disease in the dahl salt-sensitive rat. Hypertension. 2005;45:736–741 [DOI] [PubMed] [Google Scholar]
- 10.De Miguel C, Lund H, Mattson DL. High dietary protein exacerbates hypertension and renal damage in dahl ss rats by increasing infiltrating immune cells in the kidney. Hypertension. 2011;57:269–274 [DOI] [PMC free article] [PubMed] [Google Scholar]
- 11.Abais-Battad JM, Lund H, Fehrenbach DJ, Dasinger JH, Alsheikh AJ, Mattson DL. Parental dietary protein source and the role of cmklr1 in determining the severity of dahl salt-sensitive hypertension. Hypertension. 2019;73:440–448 [DOI] [PMC free article] [PubMed] [Google Scholar]
- 12.De Miguel C, Das S, Lund H, Mattson DL. T lymphocytes mediate hypertension and kidney damage in dahl salt-sensitive rats. Am J Physiol Regul Integr Comp Physiol. 2010;298:R1136–1142 [DOI] [PMC free article] [PubMed] [Google Scholar]
- 13.Rudemiller N, Lund H, Jacob HJ, Geurts AM, Mattson DL, PhysGen Knockout P. Cd247 modulates blood pressure by altering t-lymphocyte infiltration in the kidney. Hypertension. 2014;63:559–564 [DOI] [PMC free article] [PubMed] [Google Scholar]
- 14.Abais-Battad JM, Lund H, Fehrenbach DJ, Dasinger JH, Mattson DL. Rag1-null dahl ss rats reveal that adaptive immune mechanisms exacerbate high protein-induced hypertension and renal injury. Am J Physiol Regul Integr Comp Physiol. 2018;315:R28–R35 [DOI] [PMC free article] [PubMed] [Google Scholar]
- 15.Edgar R, Domrachev M, Lash AE. Gene expression omnibus: Ncbi gene expression and hybridization array data repository. Nucleic Acids Res. 2002;30:207–210 [DOI] [PMC free article] [PubMed] [Google Scholar]
- 16.Pai AV, West CA, AdS AM, Cheng X, West DA Jr., Ji H, Wu X, Baylis C, Sandberg K. Salt-sensitive (rapp) rats from envigo spontaneously develop accelerated hypertension independent of ovariectomy on a low-sodium diet. Am J Physiol Regul Integr Comp Physiol. 2018;315:R915–R924 [DOI] [PMC free article] [PubMed] [Google Scholar]
- 17.Richter CK, Skulas-Ray AC, Champagne CM, Kris-Etherton PM. Plant protein and animal proteins: Do they differentially affect cardiovascular disease risk? Adv Nutr. 2015;6:712–728 [DOI] [PMC free article] [PubMed] [Google Scholar]
- 18.Sacks FM, Rosner B, Kass EH. Blood pressure in vegetarians. Am J Epidemiol. 1974;100:390–398 [DOI] [PubMed] [Google Scholar]
- 19.Wang YF, Yancy WS Jr., Yu D, Champagne C, Appel LJ, Lin PH. The relationship between dietary protein intake and blood pressure: Results from the premier study. J Hum Hypertens. 2008;22:745–754 [DOI] [PubMed] [Google Scholar]
- 20.Altorf-van der Kuil W, Engberink MF, Brink EJ, van Baak MA, Bakker SJ, Navis G, van ‘t Veer P, Geleijnse JM. Dietary protein and blood pressure: A systematic review. PLoS One. 2010;5:e12102. [DOI] [PMC free article] [PubMed] [Google Scholar]
- 21.Stamler J, Liu K, Ruth KJ, Pryer J, Greenland P. Eight-year blood pressure change in middle-aged men: Relationship to multiple nutrients. Hypertension. 2002;39:1000–1006 [DOI] [PubMed] [Google Scholar]
- 22.Appel LJ, Moore TJ, Obarzanek E, Vollmer WM, Svetkey LP, Sacks FM, Bray GA, Vogt TM, Cutler JA, Windhauser MM, Lin PH, Karanja N. A clinical trial of the effects of dietary patterns on blood pressure. Dash collaborative research group. N Engl J Med. 1997;336:1117–1124 [DOI] [PubMed] [Google Scholar]
- 23.Appel LJ, Sacks FM, Carey VJ, Obarzanek E, Swain JF, Miller ER 3rd, Conlin PR, Erlinger TP, Rosner BA, Laranjo NM, Charleston J, McCarron P, Bishop LM, OmniHeart Collaborative Research G. Effects of protein, monounsaturated fat, and carbohydrate intake on blood pressure and serum lipids: Results of the omniheart randomized trial. JAMA. 2005;294:2455–2464 [DOI] [PubMed] [Google Scholar]
- 24.Flohe SB, Wasmuth HE, Kerad JB, Beales PE, Pozzilli P, Elliott RB, Hill JP, Scott FW, Kolb H. A wheat-based, diabetes-promoting diet induces a th1-type cytokine bias in the gut of nod mice. Cytokine. 2003;21:149–154 [DOI] [PubMed] [Google Scholar]
- 25.Vanegas SM, Meydani M, Barnett JB, Goldin B, Kane A, Rasmussen H, Brown C, Vangay P, Knights D, Jonnalagadda S, Koecher K, Karl JP, Thomas M, Dolnikowski G, Li L, Saltzman E, Wu D, Meydani SN. Substituting whole grains for refined grains in a 6-wk randomized trial has a modest effect on gut microbiota and immune and inflammatory markers of healthy adults. Am J Clin Nutr. 2017;105:635–650 [DOI] [PMC free article] [PubMed] [Google Scholar]
- 26.Kleinewietfeld M, Manzel A, Titze J, Kvakan H, Yosef N, Linker RA, Muller DN, Hafler DA. Sodium chloride drives autoimmune disease by the induction of pathogenic th17 cells. Nature. 2013;496:518–522 [DOI] [PMC free article] [PubMed] [Google Scholar]
- 27.Wu C, Yosef N, Thalhamer T, Zhu C, Xiao S, Kishi Y, Regev A, Kuchroo VK. Induction of pathogenic th17 cells by inducible salt-sensing kinase sgk1. Nature. 2013;496:513–517 [DOI] [PMC free article] [PubMed] [Google Scholar]
- 28.Binger KJ, Linker RA, Muller DN, Kleinewietfeld M. Sodium chloride, sgk1, and th17 activation. Pflugers Arch. 2015;467:543–550 [DOI] [PubMed] [Google Scholar]
- 29.McDonough AA, Youn JH. Potassium homeostasis: The knowns, the unknowns, and the health benefits. Physiology (Bethesda). 2017;32:100–111 [DOI] [PMC free article] [PubMed] [Google Scholar]
- 30.Chan Q, Stamler J, Griep LM, Daviglus ML, Horn LV, Elliott P. An update on nutrients and blood pressure. J Atheroscler Thromb. 2016;23:276–289 [DOI] [PMC free article] [PubMed] [Google Scholar]
- 31.Xu H, Qing T, Shen Y, Huang J, Liu Y, Li J, Zhen T, Xing K, Zhu S, Luo M. Rna-seq analyses the effect of high-salt diet in hypertension. Gene. 2018;677:245–250 [DOI] [PubMed] [Google Scholar]
- 32.Park D, Kim BC, Kim CH, Choi YJ, Jeong HO, Kim ME, Lee JS, Park MH, Chung KW, Kim DH, Lee J, Im DS, Yoon S, Lee S, Yu BP, Bhak J, Chung HY. Rna-seq analysis reveals new evidence for inflammation-related changes in aged kidney. Oncotarget. 2016;7:30037–30048 [DOI] [PMC free article] [PubMed] [Google Scholar]
- 33.Kelly KJ, Liu Y, Zhang J, Goswami C, Lin H, Dominguez JH. Comprehensive genomic profiling in diabetic nephropathy reveals the predominance of proinflammatory pathways. Physiol Genomics. 2013;45:710–719 [DOI] [PMC free article] [PubMed] [Google Scholar]
- 34.Hinder LM, Park M, Rumora AE, Hur J, Eichinger F, Pennathur S, Kretzler M, Brosius FC 3rd, Feldman EL. Comparative rna-seq transcriptome analyses reveal distinct metabolic pathways in diabetic nerve and kidney disease. J Cell Mol Med. 2017;21:2140–2152 [DOI] [PMC free article] [PubMed] [Google Scholar]
- 35.Lee JW, Chou CL, Knepper MA. Deep sequencing in microdissected renal tubules identifies nephron segment-specific transcriptomes. J Am Soc Nephrol. 2015;26:2669–2677 [DOI] [PMC free article] [PubMed] [Google Scholar]
- 36.Wu H, Humphreys BD. The promise of single-cell rna sequencing for kidney disease investigation. Kidney Int. 2017;92:1334–1342 [DOI] [PMC free article] [PubMed] [Google Scholar]
- 37.Lu Y, Ye Y, Yang Q, Shi S. Single-cell rna-sequence analysis of mouse glomerular mesangial cells uncovers mesangial cell essential genes. Kidney Int. 2017;92:504–513 [DOI] [PubMed] [Google Scholar]
- 38.Chen L, Lee JW, Chou CL, Nair AV, Battistone MA, Paunescu TG, Merkulova M, Breton S, Verlander JW, Wall SM, Brown D, Burg MB, Knepper MA. Transcriptomes of major renal collecting duct cell types in mouse identified by single-cell rna-seq. Proc Natl Acad Sci U S A. 2017;114:E9989–E9998 [DOI] [PMC free article] [PubMed] [Google Scholar]
Associated Data
This section collects any data citations, data availability statements, or supplementary materials included in this article.


