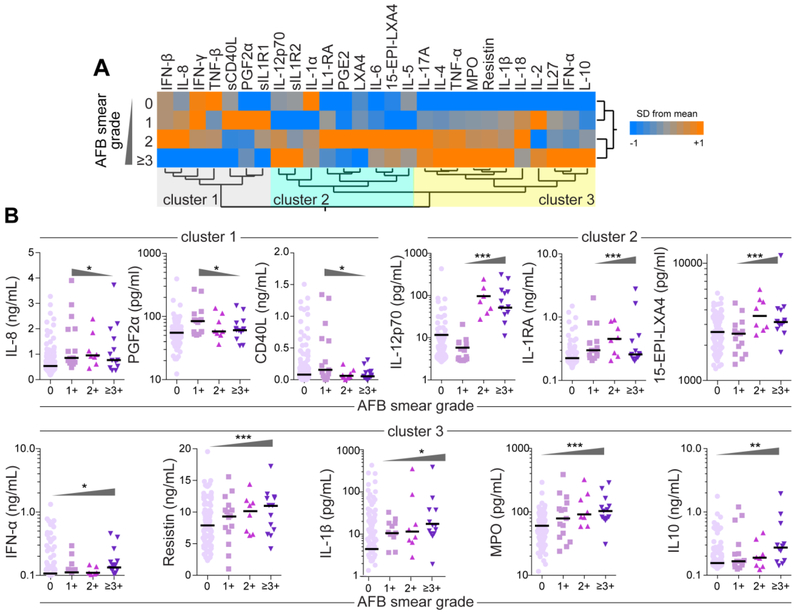
Figure 3: Correlation of sputum AFB smear grade with concentrations of plasma biomarkers in PTB patients.
(A)A hierarchical cluster analysis (Ward’s method with 100X bootstrap) was employed to test whether the overall expression profile could separate the groups of PTB patients based on AFB sputum grades. Dendrograms represent Euclidean distance. Using this approach, 3 clusters of biomarkers were detected. (B) Scatterplots of concentrations of indicated biomarkers from each cluster shown in (A), which values presented statistically significant differences between the study groups using the Kruskal-Wallis test with linear trend ad hoc test, are displayed. Bars represent median values whereas triangles indicate the trends of data variation. *p<0.05; **p<0.01; ***p<0.0001.

