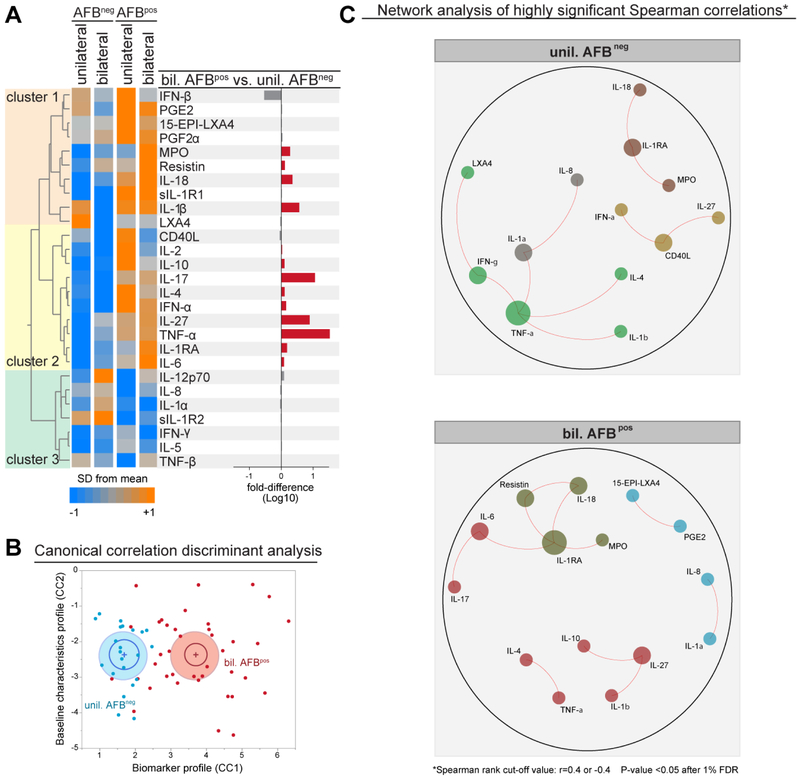
Figure 4: Difference in AFB status and extent of radiographic disease associated with specific changes in plasma inflammatory biomarker profiles in PTB.
(A)Hierarchical cluster analysis (Ward’s method with 100X bootstrap) was employed to illustrate the overall expression profile of the biomarkers in PTB patients stratified per AFB smear status and lung disease extension (AFBneg + unilateral disease, n=22; AFBneg + bilateral disease, n=21; AFBpos + unilateral disease, n=09; AFBpos + bilateral disease, n=34). Dendrograms represent Euclidean distance. The bar graph on the right panel indicate the fold-difference variation from the group of PTB patients with mild disease (AFBneg + unilateral disease) to that with severe disease (AFBpos + bilateral disease). (B) Sparse canonical correlation analysis (sCCA) was employed using the markers indicated in (A) which were statistically different between the groups. (C) Networks represent strong Spearman correlations (p<0.05 after 1% FDR adjustment; Spearman rank value >0.4 or <−0.4). Markers were clustered based on a similarity index of the correlation profiles using a modularity algorithm and depicted with Fruchterman Reingold (force-directed graph drawing). Only markers which had strong correlations were plotted to reduce visual pollution. Size of the circles is proportional to number of connections.

