Abstract
Purpose
The purpose of this study is to develop an accurate and reliable dose volume histogram (DVH) prediction method for external beam radiation therapy plans with multiple planning target volumes (PTVs).
Materials and methods
We present a novel DVH prediction workflow, including new features and a modeling methodology, that makes better use of multiple PTVs: (a) We propose a generalized feature to characterize the geometric relationship of organ‐at‐risk (OARs) with respect to two or more PTVs with different prescribed dose levels; (b) We incorporate a novel data augmentation method to improve the data distribution in the feature space; (c) A similarity metric that leverages such information is subsequently used to select a subset of similar cases from the training dataset for model building; (d) Finally, a DVH prediction model is trained with these selected cases. To evaluate this new modeling workflow, we used 120 head and neck (HN) cases to tune the model, and used a separate dataset consisting of 148 cases for validation. The proposed model has been compared with the conventional knowledge‐based model in terms of model prediction accuracy, which was measured by the root mean squared error (RMSE) between the predicted DVHs and the actual clinical plan DVHs. Furthermore, 25 randomly selected plans were replanned guided by the proposed model and evaluated against clinical plans using clinical evaluation criteria.
Results
The proposed modeling workflow significantly improved DVH prediction accuracy for brainstem (P < 0.001), cord (P < 0.001), larynx (P = 0.004), mandible (P < 0.001), oral cavity (P = 0.011), parotid (P < 0.001) and pharynx (P = 0.001). Cases replanned with the guidance of the proposed model spared OARs significantly better by clinical evaluation criteria. The replanned cases showed a 15% increase in the number of satisfied criteria, compared with clinical plans.
Conclusions
The proposed modeling workflow generates DVH predictions with improved accuracy and robustness when multiple PTVs exist in a plan. It has demonstrated that the improvement in the DVH prediction model translates into better plan quality in knowledge‐based planning.
Keywords: DVH prediction, Intensity‐modulated radiation therapy, knowledge‐based planning, modeling, treatment planning
1. Introduction
During clinical treatment planning, planners seek to achieve optimal dose distributions by interacting with treatment planning systems iteratively. This process heavily relies on planners’ prior experience and is often time consuming.1, 2, 3, 4 Knowledge‐based planning (KBP) utilizes available information in previous cases, and predicts best achievable dose volume histograms (DVHs) based on anatomical information of the current patient. Numerous KBP methods have been proposed in the last few years, including library approaches,5, 6, 7, 8, 9 neural network‐based voxel prediction approaches,10 DVH regression‐based methods,3, 11 and other parametric approaches.12 Of all the previously proposed approaches, the DVH regression‐based method is the most widely used due to its simplicity and robustness, and one version of this approach has been commercialized as RapidPlanTM (Varian Medical Systems, Palo Alto, CA, USA).3, 13 In some validation studies, RapidPlanTM has shown to be an effective treatment planning tool as well as an excellent quantitative plan quality evaluation tool.4, 14, 15, 16, 17, 18, 19, 20, 21, 22, 23, 24, 25 However, most of the existing KBP methods assume that only a single planning target volumes (PTV) exists in a plan. The models3, 7, 9, 24 can be applied to cases with multiple PTVs with the assumption that the features extracted for each PTV separately are sufficient in representing the dose distribution. This assumption does not hold true for complicated treatment sites such as head and neck, for which the relative shape distribution of multiple PTVs have to be accounted for during the modeling process. Modeling the differences in location, shape, and prescribed dose levels of multiple PTVs in the simultaneous integrated boost (SIB) plans has the potential to improve the performance of predictive models for these cases.
In this study, we propose a novel multidimensional feature map — a generalized distance‐to‐target histogram (gDTH) — that captures the geometric relationship of an organ‐at‐risk (OAR) with multiple PTVs and we implement a two‐dimensional (2D) version of this concept to model SIB plans that typically involve two PTVs. We improve upon the state‐of‐the‐art model for DVH predictions3 by coupling a localized regression methodology with this new feature representation. We also propose a data augmentation method to make effective use of available data and improve the feature space distribution of the available dataset. For comparison, we include the original DVH regression method, which models two PTV plans by utilizing two separate sets of features corresponding to respective PTVs. The two competing models are evaluated in terms of DVH prediction accuracy for anonymized HN treatment plans.
2. Materials and methods
2.A. DVH prediction model
One approach to knowledge‐based treatment planning is a regression‐based DVH prediction model,3, 11 which uses features that represent the geometrical and dosimetrical relationships of PTVs and OARs and model the variation of OAR DVHs as a function of these features. The features include principal component scores (PCS) of the distance‐to‐target histograms (DTH), the fractions of OAR volumes overlapping with PTVs, the fractions of OAR volumes outside of the irradiated volume, and the absolute volumes of OARs, etc. Note that the DTH is different from the overlap volume histogram previously proposed by Kazhdan el al.8 in that non‐Euclidean distance is used to better correlate the distance with the dose falloff, as explained in Zhu et al.11 The model is formulized as
| (1) |
where X denotes anatomy feature vectors, Y denotes the PCS of DVHs in the training set, and denotes regression coefficients.
A simplistic extension to multiple PTVs is by expanding the feature vector X in Eq. (1) to include additional sets of features corresponding to additional PTVs. In two PTV cases, the first set of features represents the effect of the primary PTV on OAR DVHs, and the second set represents the effect of the boost PTV. Formally, the regression coefficient can be formulized as follows:
| (2) |
where
In Eq. (2), Dpri , Dbst , and D denote prescription dose to the primary PTV, to the boost PTV, and the total prescription dose, respectively. One of the drawbacks of such extension is that the regression coefficients do not scale well with primary and boost PTV prescription dose ratio changes. Also, the model implicitly assumes geometric relations of primary and boost PTVs remain consistent from one case to another, which is often not the case for treatment sites like the head and neck. This scaling scheme is particularly problematic for HN cases when primary and boost PTVs vary in shape/volume as well as in prescription dose ratio. For instance, if the boost PTV is more than 5 cm from an OAR then in principle it should not affect the predicted OAR DVH, but since we fit the whole training set with a linear model, some features corresponding to boost PTVs will still contribute to the prediction.
2.B. Generalized distance‐to‐target histogram
We propose a multidimensional map, referred in this paper as a gDTH, to represent the geometric variations of an OAR to multiple PTVs. In this paper, we apply this concept to HN cases with primary and boost PTVs and thus will focus on the 2D version of this concept. Higher dimensional gDTHs can be developed similarly for cases with more than two PTVs. We use the same distance metric as defined in the original KBP work.3 This metric quantifies the distance of OAR voxels to PTV surfaces based on dosimetric effects. Therefore, distances from OAR voxels outside of the transverse slices that encompass the PTV are assigned larger values. We shall refer to this distance metric as effective target distance (ETD) in the remainder of the paper. We define an element of a gDTH matrix as
where d1 and d2 denote distances from a voxel to primary and boost PTVs, respectively. Gij is the fraction of the OAR volume with ETD to the surface of the primary PTV smaller than d(i), and effective target distance to boost PTV surface smaller than d1 + d(j). To generate a full gDTH for an OAR, we first calculate d1 and d2 for all voxels inside the OAR and then sort d1 and d2 ‐ d1 into discrete bins on a 2D map.
The rightmost column and bottom row of the matrix Gij are capped at infinity to account for all OAR voxels more than a certain distance away from the PTV surface. The rightmost column of a gDTH is equivalent to the DTH associated with the primary PTV. In this study, the size of distance bins d(i) and d(j) is set to 1 mm. The dimensions of gDTHs are set to 100 × 20. Figure 1 shows example gDTHs with phantoms cases. Contours of PTVs and OARs are generated using Varian Eclipse Scripting API.26 In the figure, red segments denote boost PTVs; red contours denote primary PTVs; and brown and blue segments denote OARs. The colored maps are gDTHs. In Figs. 1(a)–1(c) and Figs. 1(g)–1(i), the color maps only vary in the vertical direction, which represents the distance distribution of OAR relative to both PTVs. Figures 1(d)–1(f) illustrates the variance of gDTHs with respect to primary PTVs, with the relative spatial relationship between the boost PTV and the OAR stay unchanged. Example gDTHs of clinical HN cases are shown in Fig. 2, in which the rows represent three cases with different geometrical relations between OARs (larynx in this figure) and primary and boost PTVs. As shown, the shape variation cannot be effectively captured by any single‐PTV features. The gDTH feature clearly demonstrates its ability to differentiate such geometric variances.
Figure 1.
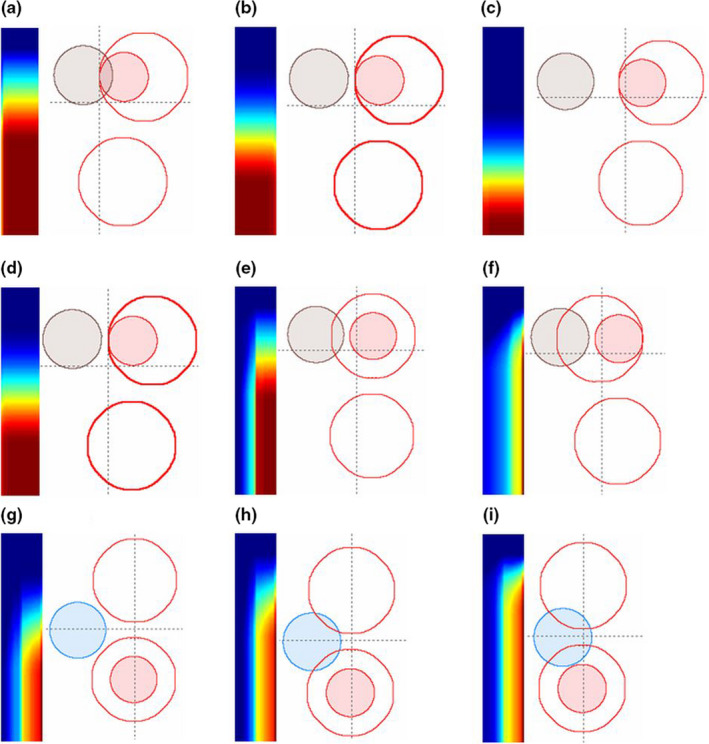
Illustrations of the proposed gDTH feature with phantom data. (a)–(i): Nine phantom set up scenarios, with PTVs and OARs designated as coplanar spheres (see text for details). Red contours represent primary PTVs; red solid segments represent boost PTVs; and brown and blue segments represent OARs. Corresponding gDTHs are shown for each phantom case as two‐dimensional color maps. [Color figure can be viewed at wileyonlinelibrary.com]
Figure 2.
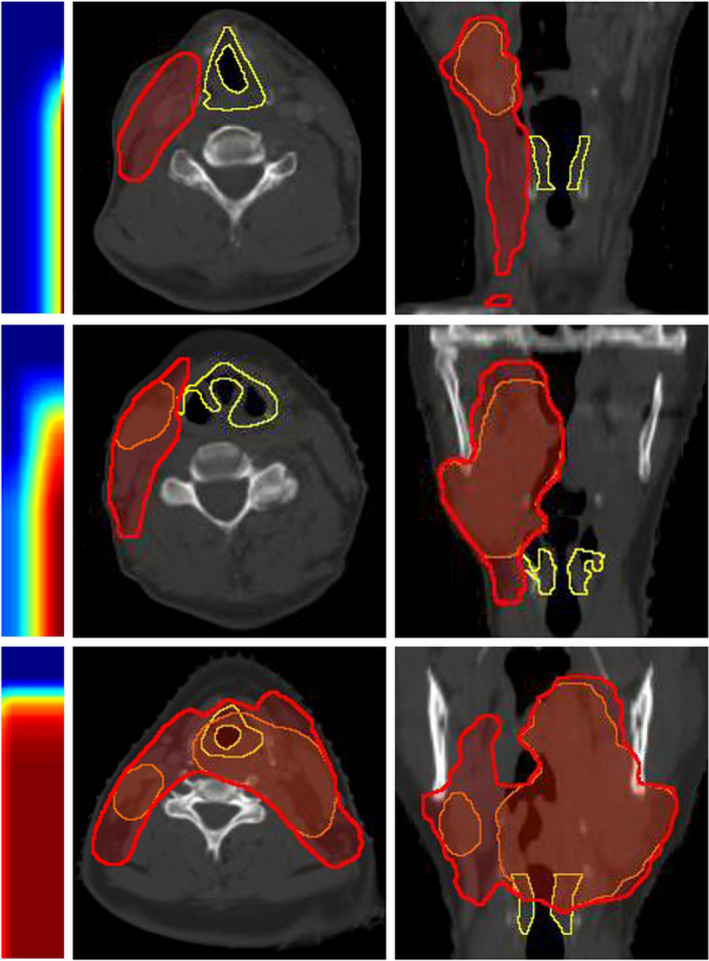
Larynx gDTHs of three example HN cases. Transverse and coronal views of the structures are shown. Yellow contours, red segments, and orange segments are larynxes, primary PTVs, and boost PTVs, respectively. Corresponding gDTHs are shown for each phantom setup case as two‐dimensional color maps. [Color figure can be viewed at wileyonlinelibrary.com]
Note that the assumption made in the feature extraction process is that boost PTV voxels are a subset of primary PTV voxels. For a case with separate PTVs with different prescription doses, the union of the PTV voxels is equivalent to the primary PTV in terms of planning, and the PTV with higher prescription dose is treated as the boost PTV.
2.C. Modeling with a gDTH‐based similarity metric
To take full advantage of the proposed gDTH feature, we have incorporated a similarity metric that measures the geometrical similarities of OARs with respect to multiple PTVs. The first term is the Frobenius norm of the differences between the gDTHs of two cases. The same distance distribution alone does not guarantee the same dose distribution, considering the prescription doses to primary PTVs and boost PTVs may vary from patient to patient. In our institution, for instance, there are several commonly used primary/ boost dose prescriptions for HN treatment, such as 44 Gy/70 Gy, 50 Gy/60 Gy. To account for such a variation, we introduced a second term to represent the dose ratio similarity and defined the similarity metric as:
| (3) |
where and denote the gDTH of the target plan and that of the plan being referenced from the database, and is a balancing factor empirically tuned to match the mean values of the first term and the second term in the training dataset, and d denotes prescription dose. In our experiments, was selected as , which is the ratio of the two square differences averaged over the training set.
With this similarity metric, the k‐nearest neighbors (kNN) search then selects a subset of training cases that resemble the validation case. We choose to reference k nearest neighbors because (a) kNN is a known robust nonparametric regression method when k is properly selected and (b) kNN referencing yields similar plans we can model with reduced model complexity. The selected subset is subsequently used to build a DVH prediction model. T‐distributed statistical neighboring embedding (t‐SNE)27 is used to visualize this high‐dimensional feature space and to justify similarity metric measurements on the feature space distribution. T‐SNE converts high dimensional Euclidean distances to conditional probabilities and maps high dimension data to low dimension while preserving local structures of the datasets. A visualization of the proposed feature map of a dataset is shown in Fig. 3. Figure 3(a) shows a 2D t‐SNE map of the left parotid gDTHs of the 120‐case training dataset in this study (the red and blue dots). Figure 3(b) is a validation case randomly picked to demonstrate the effectiveness of the proposed feature at differentiating cases with different OAR‐PTV shape distributions. The blue dots on the map [Fig. 3(a)] are the cases selected by the similarity metrics to build the model to predict the parotid DVH of Fig. 3(b) (the validation case), while the red dots are the cases excluded from the modeling. Figures 3(c)–3(f) further show the PTVs and left parotid anatomies of the selected (3f) and unselected (3c–e) cases, and their respective locations on the 2D t‐SNE map are indicated by the arrows. As shown, 3(b) and 3(f) are determined by Eq. (3) as similar in features, even though their PTVs (especially boost PTV) vary significantly in size and location. Previously, the modeling of head and neck treatment plans require manual data stratifications. For instance, ipsilateral and contralateral parotids have to be modeled separately,28 and treatment plans should be categorized by subsites before model training. The proposed gDTH feature effectively separates cases with different geometries in a nonlinear fashion, and it is no longer necessary to stratify data.
Figure 3.
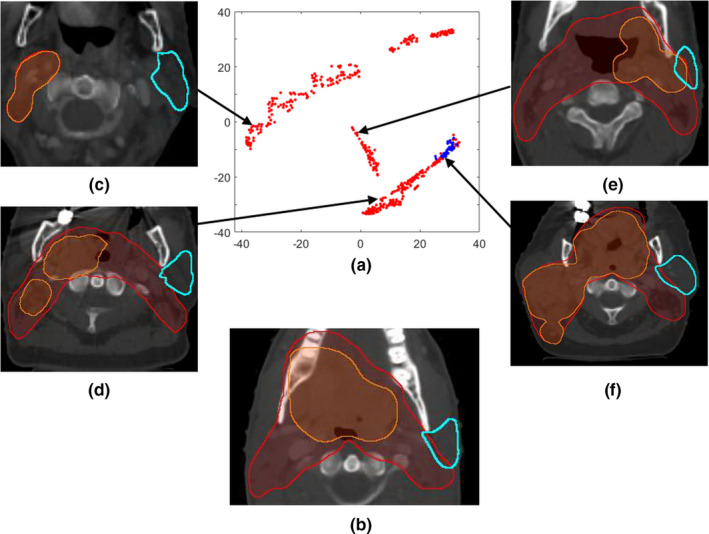
A t‐SNE visualization example: (a) A two‐dimensional t‐SNE map of the left parotid gDTHs; (b) The randomly selected validation case; (c)–(f) four example cases located in different regions of the feature map. In (a), blue dots mark the cases selected by the similarity metric for modeling the validation case in 3b, and red dots denote the rest of the dataset. (c)–(e) show three unselected cases and the arrows indicate their locations on the t‐SNE map, while (f) is one of the selected cases even though its PTVs (especially boost PTV) are significantly different to 3b in size and location. Both the x‐ and the y‐axis of the t‐SNE map are dimensionless and are of arbitrary units. [Color figure can be viewed at wileyonlinelibrary.com]
2.D. Data selection and augmentation
With IRB approval, we retrospectively retrieved and anonymized 268 HN cases for model training and validation. We selected optimal features (the first two PCS of DTH relative to the primary PTV, the fraction of OAR volume overlaps with PTV, the fraction of OAR volume not located in the same slices of the primary PTV) and the number of nearest number cases (30) based on the 120 cases reserved for model tuning to avoid positively biasing our validation results. The model performance was tested with the remaining 148 cases.
Head and neck treatment plans have high interpatient spatial variability, especially considering the fact that the boost PTVs (i.e., GTVs) from various subsites are located in different regions and that the OARs also vary significantly from patient to patient. Therefore, to successfully train a reliable KBP model for head and neck treatments, a large number of treatment plans is required. However, the treatment plans available for training purposes is limited. To make efficient use of the training cases and effectively increase the training dataset, we here present two data augmentation methods for our modeling process. Both methods utilize single‐PTV cases and the primary plans of multiple PTV cases as the means to synthesize gDTHs. Figure 4 shows the overall workflow of the model training and validation process with data augmentation. First, we anonymized and exported both sequential boost treatment plans and single‐PTV plans for head and neck treatments from our clinical database. We then utilized the primary PTV plans and the single‐PTV plans to create additional SIB data via data augmentation. Subsequently, a KBP model was trained with the augmented data and a fraction of the plan sum data. At last, we validated the model with the remaining plan sum data. We used fivefold cross‐validation with the dataset containing 148 cases. Therefore, the workflow shown in Fig. 4 was effectively repeated five times with different partitions of the dataset. As a result, every case in the dataset is used in validation dataset once, and used in the training dataset four times. Note that no model adjustment was made after the model‐tuning step, and the cross validation solely served the purpose of final model quality evaluation. The results of the cross validation are reported in Section 3.
Figure 4.
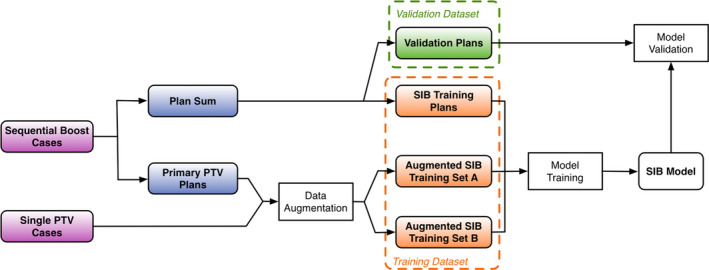
The workflow of the proposed modeling method with data augmentation. [Color figure can be viewed at wileyonlinelibrary.com]
2.D.1. Data augmentation type A
The first data augmentation method originates from an intrinsic property of gDTH. By definition, the rightmost column of gDTH is equivalent to the DTH associated with primary PTV. In some cases, certain OARs are only affected by primary PTVs because the ETDs to the boost PTVs are more than 5 cm larger than the ETDs to primary PTV. One such example is shown in the top row of Fig. 5. Such a shape distribution is most common for brainstems and parotids. To simulate such cases, we scale OAR DVHs to the various common clinical dose ratios — for example, 44 Gy/70 Gy, 50 Gy/60 Gy, and generate zero filled gDTHs with only the rightmost columns remain unchanged from the original cases. We replicate the whole dataset in this fashion. By generating these additional cases, we effectively increase the number of training cases in which OAR DVHs are only affected by primary PTVs.
Figure 5.
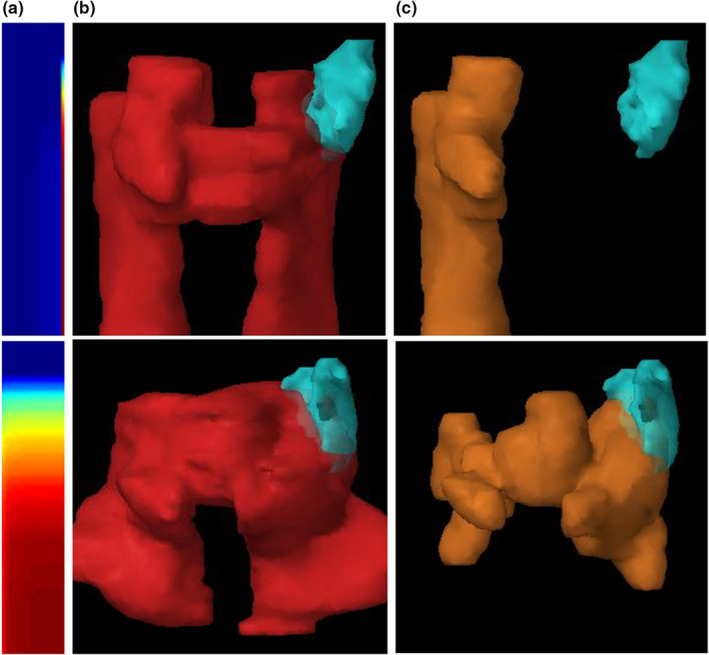
Examples of clinical cases that can be synthesized by data augmentation. Top row: type A augmentation — since boost PTV (yellow) if far away from the OAR (cyan), the plan can be synthesized for various primary/boost dose prescription ratios, such as 44 Gy/ 70 Gy, 50 Gy/ 60 Gy. Bottom row: type B augmentation — since the boost PTV is at the same distance to the OAR as the primary PTV, a synthesized plan can be generated using the primary PTV as both primary and boost PTV. Columns from left to right: (a) gDTHs, (b) OARs (left parotids) shown with primary PTVs, (c) same OARs shown with boost PTVs. [Color figure can be viewed at wileyonlinelibrary.com]
2.D.2. Data augmentation type B
The treatment plans without boost PTVs can be utilized to simulate cases in which two PTVs have the same volume. For some cases, boost PTV surfaces overlap with primary PTV surfaces in the regions that are close to the particular OAR, as shown in the bottom row of Fig. 5. We make the approximation that primary PTV plans can be scaled up to boost PTV dose level and can be treated as a plan with primary and boost PTVs of the same shape. For this type of augmented cases, gDTH can be generated by treating original primary PTV as both primary PTV and boost PTV.
3. Results
3.A. DVH prediction accuracy
To evaluate the effectiveness of the proposed data augmentation methods, we first map the training set to a 2D PCA space. The first two PCS of the training set gDTHs are set as the x and y axes, respectively [Fig. 6(a)]. As shown in the figure, the data augmentation procedure populates two opposite sides of the gDTH distribution, where data points are sparse. Therefore, when predicting a validation case’s DVH with gDTHs near the edge of the map, augmented cases will be selected to build the model and help improve prediction accuracy and robustness.
Figure 6.
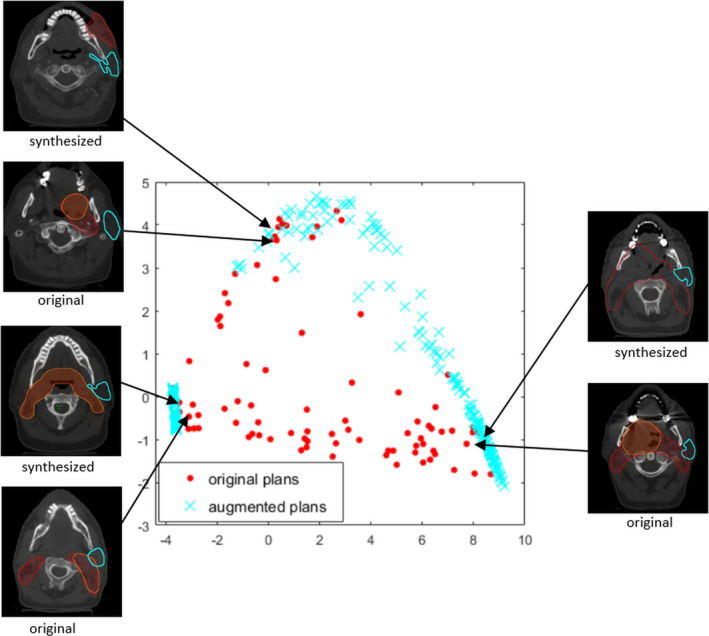
The distribution of the first two principal component scores of gDTHs in the training dataset. Blue crosses represent augmented cases, and red dots represent the original training data. Also shown in the figure are three example pairs of structure sets that demonstrate the resemblances of the original and the synthesized cases. Left parotids, primary, and boost PTV structures are marked with cyan contours, red segments, and orange segments, respectively. [Color figure can be viewed at wileyonlinelibrary.com]
To quantitatively measure the improvements of the proposed modelling workflow over the previous process, we evaluated DVH prediction accuracy measured by the root‐mean‐squared error (RMSE). Clinical plan DVHs are set as a baseline for comparison. The model previously tuned with 120 HN cases was evaluated using a separate validation dataset consisting of 148 cases (all with two PTVs). Compared with the previous model,3 the proposed model resulted in significantly reduced prediction RMSE for brainstem (P < 0.001), mandible (P = 0.004), pharynx (P = 0.034), oral cavity (P = 0.022), parotids (P < 0.001), but the improvements were not significant for cord (P = 0.051) larynx (P = 0.099). When augmented cases were included in the training dataset, statistically significant improvements were observed for predicted DVHs of all OARs, including brainstem (P < 0.001), cord (P < 0.001), larynx (P = 0.004), mandible (P < 0.001), pharynx (P = 0.001), oral cavity (P = 0.011) and parotid (P < 0.001), as shown in Table 1 and Fig. 7. In particular, the DVH prediction accuracies are moderately improved when data augmentation is implemented, compared to the proposed model without data augmentation. For some OARs with high DVH variances (e.g., larynx), the improvement is significant.
Table 1.
Model prediction accuracy comparison between the previous modeling process3 and the proposed modeling process with and without data augmentation.
| DVH RMSE (Vol %) | ||||
|---|---|---|---|---|
| Previous model | Proposed model | Proposed model with data augmentation | ||
| Parotid | 7.99 (0.36) | 6.92 (0.30) | 6.83 (0.28) | |
| Brainstem | 5.11 (0.39) | 3.73 (0.23) | 3.77 (0.26) | |
| Cord | 5.53 (0.27) | 5.19 (0.25)a | 4.92 (0.25) | |
| Mandible | 6.31 (0.23) | 5.70 (0.21) | 5.59 (0.22) | |
| Larynx | 9.32 (0.74) | 8.46 (0.80)a | 7.19 (0.35) | |
| Oral cavity | 8.23 (0.43) | 7.58 (0.40) | 7.33 (0.41) | |
| Pharynx | 7.63 (0.28) | 7.04 (0.32) | 6.65 (0.27) | |
DVH, dose volume histogram; RMSE, root mean squared error.
The improvement over the previous method is not statistically significant (paired‐sample t‐test, P> 0.05).
Figure 7.
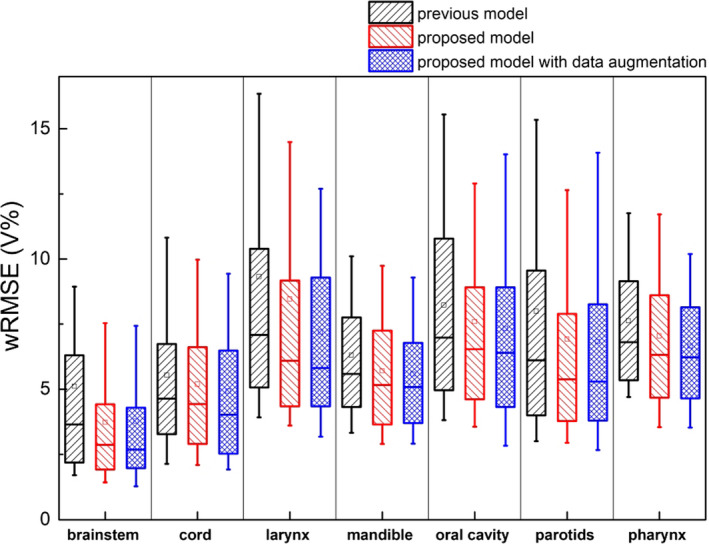
Prediction error comparison between the previous model, the proposed model and proposed model with data augmentation. The proposed models are significantly better at predicting all OARs, including brainstem (P < 0.001), cord (P < 0.001), larynx (P = 0.004), mandible (P < 0.001), pharynx (P = 0.001), oral cavity (P = 0.011), and parotid (P < 0.001). [Color figure can be viewed at wileyonlinelibrary.com]
3.B. Evaluation of KBP plans
To analyze if accurately predicted DVHs could be incorporated into the treatment planning workflow and improve plan quality, we randomly selected 25 clinical HN plans from the validation dataset and replanned with the guidance of predicted DVHs generated by our proposed prediction model. All KBP plans have been normalized to match the PTV coverage of the clinical plans (prescription dose covers the same percent volume). Plans were evaluated with physician prescribed constraints and were compared against original clinical plans. Table 2 summarizes numbers of evaluation criteria met by the original clinical plans and the KBP plans. The replanning process substantially increased the pass rate of clinical evaluation. The mean values and standard deviations of the aforementioned evaluation criteria are shown in Table 3. The improvement of OAR sparing in terms of clinical evaluation criteria are significant for most criteria evaluated, including brainstem Dmax, cord + 5 mm Dmax, larynx Dmedian, mandible Dmax, oral cavity Dmedian, parotid Dmedian. The difference in body Dmax between both planning methods is not statistically significant (P = 0.10, paired t‐test).
Table 2.
Summary of constraints satisfaction for clinical plans and KBP plans.
| Number of constraints | ||||
|---|---|---|---|---|
| Evaluation criteria | Total | Met by clinical plans | Met by KBP plans | Number of plans improved by replanning |
| Brainstem Dmax | 25 | 24 | 25 | 22 |
| Cord + 5mm Dmax | 25 | 20 | 24 | 24 |
| Larynx Dmedian | 20 | 16 | 19 | 17 |
| Mandible Dmax | 25 | 9 | 23 | 25 |
| Oral cavity Dmedian | 24 | 18 | 20 | 19 |
| Parotid Dmedian | 40 | 33 | 37 | 36 |
KBP, Knowledge‐based planning.
Table 3.
Mean values and standard deviations of clinical evaluation criteria for clinical plans and KBP plans.
| Evaluation criteria | Clinical constraints | Clinical plans | KBP plans | P valuesa |
|---|---|---|---|---|
| Body Dmax | 115% (0 %) | 109.8% (2.0 %) | 110.8% (2.7 %) | 8.9 × 10⁻² |
| Brainstem Dmax | 27.1 Gy (6.3 Gy) | 20.7 Gy (9.0 Gy) | 18.3 Gy (8.0 Gy) | 1.2 × 10⁻⁴ |
| Cord + 5mm Dmax | 45.0 Gy (4.2 Gy) | 39.4 Gy (8.6 Gy) | 35.7 Gy (7.4 Gy) | 1.5 × 10⁻⁷ |
| Larynx Dmedian | 25.0 Gy (5.1 Gy) | 20.8 Gy (8.9 Gy) | 18.3 Gy (7.8 Gy) | 6.8 × 10⁻⁴ |
| Mandible Dmax | 68.2 Gy (9.1 Gy) | 68.1 Gy (10.1 Gy) | 62.6 Gy (11.5 Gy) | 2.2 × 10⁻⁴ |
| Oral cavity Dmedian | 30.3 Gy (8.1 Gy) | 27.1 Gy (11.9 Gy) | 24.5 Gy (10.6 Gy) | 1.7 × 10⁻³ |
| Parotid Dmedian | 18.0 Gy (7.1 Gy) | 15.5 Gy (8.9 Gy) | 12.1 Gy (6.3 Gy) | 2.8 × 10⁻⁶ |
KBP, Knowledge‐based planning.
The P‐values between KBP plan results and clinical plan results, measured with a paired‐sample t‐test.
An example case benefiting from the new DVH prediction model is shown in Fig. 8. In Fig. 8(a), the DVHs referenced by the proposed model are shown as grey lines. These cases are automatically selected from the augmented dataset containing real cases and synthetic cases based on the similarity metric utilizing the proposed gDTH feature. Interestingly, the majority of reference plans are type‐A–augmented plans, which indicates that the boost PTV in this case has very limited influence on the left parotid DVH. Therefore, these reference DVH curves (grey) have very little volumes go beyond primary dose of 44–50 Gy. As a comparison, the green line represents the DVH predicted by the previous model, which lacks of effectively differentiating the impact of the boost PTV. Instead, it infers the average impact of boost PTV and overestimates in the 50–70 Gy region of the DVH, where boost PTV dose contributes. The blue line, which marks the clinical plan DVH, shows that the planner, without the guidance of the knowledge model, also did not realize that the high‐dose regions for the parotid can be further spared. The magenta line is the prediction by our proposed model, and it predicts significantly better sparing of the 50–70 Gy region, compared with previous model (green) and the clinical plan (blue). The DVH of the replanned with the guidance of the proposed model is shown as the red line, which confirms the extra sparing in 50–70 Gy dose range. This is also reflected in the dose distribution shown in Fig. 8(b) (original clinical plan) and Fig. 8(c) (KBP plan).
Figure 8.
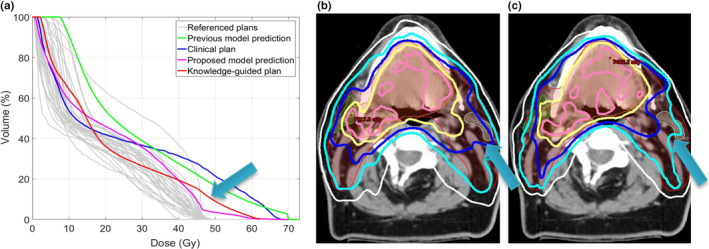
An example case demonstrates plan quality improvement after replanning guided by the proposed model. (a) Left parotid DVH of the original plan (blue), predicted by the previous model (green), the proposed model (magenta with upper and lower bounds), and the DVH of the KBP‐guided plan (red). The DVHs of referenced training cases (grey) are also plotted for reference. (b) Clinical plan dose distribution showing the sparing of the left parotid. (c) Dose distribution of the new plan guided by the proposed model. In both (b) and (c), 73.5 Gy (pink), 70 Gy (yellow), 63 Gy (dark blue), 56 Gy (light blue), and 44 Gy (white) isodose lines are shown. [Color figure can be viewed at wileyonlinelibrary.com]
4. Discussion
The gDTH concept proposed in this study aims to improve the characterization of DVH variances in multiple target plans. It fully represents the distribution of distances from OAR volumes to multiple PTV surfaces. Previously, we characterize the geometrical relation of an OAR to multiple PTVs separately, as shown in Eq. (2). However, the direct combination of individual PTV features does not fully reflect the synergetic effect or cancellation effect of multiple PTVs. In a multi‐PTV plan, the ideal dose distribution for an OAR is heavily influenced by the relative location of all the PTVs, and this information is not fully captured when we extract separated sets of features corresponding to each PTV. This is apparent in Fig. 5, where 5(a) shows the “cancellation effect” of the boost PTV, as it is so far away from the OAR its dosimetric influence is almost negligible in a well‐designed treatment plan, and Fig. 5(b) shows the synergetic effect where boost PTV’s dosimetric influence is almost the same as the primary PTV. The gDTH is capable of capturing these shape variations and thus significantly outperform the previous KBP model in those scenarios. Also of note, the application of gDTH is demonstrated with cases involving two PTVs in this study. However, the concept itself applies to multiple PTVs. Extending to three or more PTVs is straightforward and should not involve redesigning any of the methods presented in this study.
Furthermore, we have enhanced the proposed modeling workflow with a data‐augmentation method that takes effective use of the limited clinical data available and generates synthesized plans for model training. It reduces the number of clinical cases needed to make a robust DVH model. Specifically fitted to this study, we have incorporated two unique data augmentation methods. One addresses the scenario where boost PTV has minimal impact on an OAR’s dose sparing, while the other addresses when the boost PTV reduces in size but the dosimetric impact to an OAR does not decrease with the size. With the addition of our proposed KBP data augmentation method, prediction accuracy was further improved.
Finally, replanning using predictions from the proposed model shows substantial improvement in the number of planning constraints satisfied, compared with original clinical plans. Clinical implications of the improved OAR‐DVH predictions are twofold. First, the improvement in prediction accuracy results in enhanced plan quality, since the best achievable DVH prediction guides planners to generate proper optimization goals, and in turn, more consistently produces plans with optimal OAR sparing while not compromising PTV coverage. Improved plan quality results in less normal‐tissue complications and will have a positive impact on the treatment outcomes. Second, accurate OAR DVH prediction methods improve planning efficiency by enabling efficient automatic treatment planning. The predictions can be directly used to place optimization goals automatically and generate high‐quality plans consistently. Numerous other studies have also demonstrated that KBP with accurate models helps improve clinical plan quality.15, 16, 17, 18, 19, 20, 21, 22, 23
While the gDTH is calculated analytically and accurately, there are uncertainties involved in the statistical distribution of the gDTHs in the population. The number of training cases may be correlated with the uncertainty of the modeling process. The likelihood of finding similar plans in a smaller training dataset would be smaller. This could potentially result in increased prediction uncertainty. However, the proposed data augmentation method is expected to be more effective in such scenarios.
5. Conclusions
The proposed modeling workflow generates accurate and robust DVH predictions when multiple PTVs are involved in a plan. The KBP plans guided by the proposed model demonstrates that the improvement in the DVH prediction model can translate into better plan quality in KBP. KBP with the proposed modeling method can potentially help planners to achieve higher and more consistent plan quality, compared with the current clinical planning process.
Conflict Of Interest
The authors have no conflicts to disclose.
Acknowledgments
This work is partially supported by an NIH grant (#R01CA201212) and a master research grant by Varian Medical Systems.
References
- 1. Nelms BE, Robinson G, Markham J, et al. Variation in external beam treatment plan quality: an inter‐institutional study of planners and planning systems. Pract Radiat Oncol. 2012;2:296–305. [DOI] [PubMed] [Google Scholar]
- 2. Das IJ, Cheng CW, Chopra KL, Mitra RK, Srivastava SP, Glatstein E. Intensity‐modulated radiation therapy dose prescription, recording, and delivery: patterns of variability among institutions and treatment planning systems. J Natl Cancer Inst. 2008;100:300–307. [DOI] [PubMed] [Google Scholar]
- 3. Yuan L, Ge Y, Lee WR, Yin FF, Kirkpatrick JP, Wu QJ. Quantitative analysis of the factors which affect the interpatient organ‐at‐risk dose sparing variation in IMRT plans. Med Phys. 2012;39:6868–6878. [DOI] [PubMed] [Google Scholar]
- 4. Moore KL, Brame RS, Low DA, Mutic S. Experience‐based quality control of clinical intensity‐modulated radiotherapy planning. Int J Radiat Oncol Biol Phys. 2011;81:545–551. [DOI] [PubMed] [Google Scholar]
- 5. Simari P, Wu B, Jacques R, et al. A statistical approach for achievable dose querying in IMRT planning. In: Jiang T, Navab N, Pluim JPW, Viergever MA eds. Medical Image Computing and Computer‐Assisted Intervention – MICCAI 2010: 13th International Conference, Beijing, China, September 20–24, 2010, Proceedings, Part III. Berlin, Heidelberg: Springer; 2010:521‐528. [DOI] [PubMed] [Google Scholar]
- 6. Wu B, McNutt T, Zahurak M, et al. Automated simultaneous integrated boosted‐intensity modulated radiation therapy treatment planning is feasible for head‐and‐neck cancer: A Prospective Clinical Study. Int J Radiat Oncol Biol Phys. 2012;84:e647–e653. [DOI] [PubMed] [Google Scholar]
- 7. Wu B, Ricchetti F, Sanguineti G, et al. Patient geometry‐driven information retrieval for IMRT treatment plan quality control. Med Phys. 2009;36:5497–5505. [DOI] [PubMed] [Google Scholar]
- 8. Kazhdan M, Simari P, McNutt T, et al. A shape relationship descriptor for radiation therapy planning. Med Image Comput Comput‐Assist. 2009;12:100–108. [DOI] [PubMed] [Google Scholar]
- 9. Wu B, Ricchetti F, Sanguineti G, et al. Data‐driven approach to generating achievable dose‐volume histogram objectives in intensity‐modulated radiotherapy planning. Int J Radiat Oncol Biol Phys. 2011;79:1241–1247. [DOI] [PubMed] [Google Scholar]
- 10. Shiraishi S, Moore KL. Knowledge‐based prediction of three‐dimensional dose distributions for external beam radiotherapy. Med Phys. 2016;43:378–387. [DOI] [PubMed] [Google Scholar]
- 11. Zhu X, Ge Y, Li T, Thongphiew D, Yin F‐F, Wu QJ. A planning quality evaluation tool for prostate adaptive IMRT based on machine learning. Med Phys. 2011;38:719–726. [DOI] [PubMed] [Google Scholar]
- 12. Appenzoller LM, Michalski JM, Thorstad WL, Mutic S, Moore KL. Predicting dose‐volume histograms for organs‐at‐risk in IMRT planning. Med Phys. 2012;39:7446–7461. [DOI] [PubMed] [Google Scholar]
- 13. Varian Medical Systems . DVH Estimation Algorithm. In: Eclipse Photon and Electron Algorithms Reference Guide. 2014:220–229. [Google Scholar]
- 14. Good D, Lo J, Lee WR, Wu QJ, Yin FF, Das SK. A knowledge‐based approach to improving and homogenizing intensity modulated radiation therapy planning quality among treatment centers: an example application to prostate cancer planning. Int J Radiat Oncol Biol Phys. 2013;87:176–181. [DOI] [PubMed] [Google Scholar]
- 15. Berry SL, Ma R, Boczkowski A, Jackson A, Zhang P, Hunt M. Evaluating inter‐campus plan consistency using a knowledge based planning model. Radiother Oncol. 2016;120:349–355. [DOI] [PMC free article] [PubMed] [Google Scholar]
- 16. Chang ATY, Hung AWM, Cheung FWK, et al. Comparison of planning quality and efficiency between conventional and knowledge‐based algorithms in nasopharyngeal cancer patients using intensity modulated radiation therapy. Int J Radiat Oncol Biol Phys. 2016;95:981–990. [DOI] [PubMed] [Google Scholar]
- 17. Delaney AR, Tol JP, Dahele M, Cuijpers J, Slotman BJ, Verbakel WF. Effect of dosimetric outliers on the performance of a commercial knowledge‐based planning solution. Int J Radiat Oncol Biol Phys. 2016;94:469–477. [DOI] [PubMed] [Google Scholar]
- 18. Tol JP, Delaney AR, Dahele M, Slotman BJ, Verbakel WF. Evaluation of a knowledge‐based planning solution for head and neck cancer. Int J Radiat Oncol Biol Phys. 2015;91:612–620. [DOI] [PubMed] [Google Scholar]
- 19. Tol JP, Dahele M, Delaney AR, Slotman BJ, Verbakel WF. Can knowledge‐based DVH predictions be used for automated, individualized quality assurance of radiotherapy treatment plans? Radiat Oncol. 2015;10:234. [DOI] [PMC free article] [PubMed] [Google Scholar]
- 20. Fogliata A, Nicolini G, Clivio A, et al. A broad scope knowledge based model for optimization of VMAT in esophageal cancer: validation and assessment of plan quality among different treatment centers. Radiat Oncol. 2015;10:220. [DOI] [PMC free article] [PubMed] [Google Scholar]
- 21. Fogliata A, Belosi F, Clivio A, et al. On the pre‐clinical validation of a commercial model‐based optimisation engine: application to volumetric modulated arc therapy for patients with lung or prostate cancer. Radiother Oncol. 2014;113:385–391. [DOI] [PubMed] [Google Scholar]
- 22. Wu H, Jiang F, Yue H, Zhang H, Wang K, Zhang Y. Applying a RapidPlan model trained on a technique and orientation to another: a feasibility and dosimetric evaluation. Radiat Oncol. 2016;11:108. [DOI] [PMC free article] [PubMed] [Google Scholar]
- 23. Hussein M, South CP, Barry MA, et al. Clinical validation and benchmarking of knowledge‐based IMRT and VMAT treatment planning in pelvic anatomy. Radiother Oncol. 2016;120:473–479. [DOI] [PubMed] [Google Scholar]
- 24. Wu B, Kusters M, Kunze‐Busch M, et al. Cross‐institutional knowledge‐based planning (KBP) implementation and its performance comparison to Auto‐Planning Engine (APE). Radiother Oncol. 2017;123:57–62. [DOI] [PubMed] [Google Scholar]
- 25. Lian J, Yuan L, Ge Y, et al. Modeling the dosimetry of organ‐at‐risk in head and neck IMRT planning: an intertechnique and interinstitutional study. Med Phys. 2013;40:121704. [DOI] [PMC free article] [PubMed] [Google Scholar]
- 26. Eclipse Scripting API Reference Guide for Research Users. Varian Medical Systems. 2015.
- 27. Maaten LJPvd, Hinton GE. Visualizint high‐dimensional data using t‐SNE. J Mach Learn Res. 2008;9:2579–2605. [Google Scholar]
- 28. Yuan L, Wu QJ, Yin F‐F, Jiang Y, Yoo D, Ge Y. Incorporating single‐side sparing in models for predicting parotid dose sparing in head and neck IMRT. Med Phys. 2014;41:021728. [DOI] [PMC free article] [PubMed] [Google Scholar]


