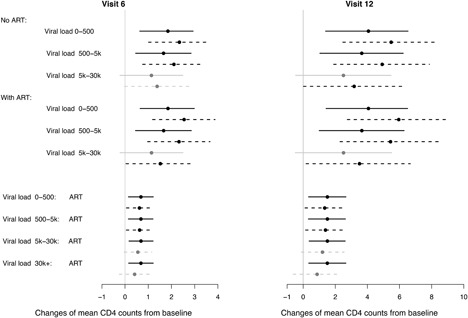
Figure 2.

Results (posterior means and 95% credible intervals) for marginal covariate effects on changes of mean square root CD4 counts from baseline to visits 6 and 12 in the HERS analysis. Top: baseline viral load effects on mean CD4 count changes, given baseline ART status. Bottom: baseline ART status effects on mean CD4 count changes, given baseline viral load levels. Solid lines (—–): 95% credible intervals under the default extrapolation distribution of the SPM; dashed lines (‐ ‐ ‐ ‐ ‐): 95% credible intervals under the extrapolation distribution in the sensitivity analysis. The estimated effects with 95% credible intervals covering zero and not covering zero are in gray and black, respectively.
