

Abstract
Prader−Willi syndrome (PWS) and Angelman syndrome (AS) are distinct mental retardation disorders caused by a deficiency of paternal (PWS) or maternal (AS) contributions for chromosome 15 by either deletion or uniparental disomy (UPD). To further study the molecular mechanisms involved in these disorders and to improve molecular diagnostic methods, we have isolated three dinucleotide repeat markers in the PWS/AS critical region. An Alu-CA PCR method was used to isolate CA-repeat markers directly from yeast artificial chromosome (YAC) clones identified by probes IR4–3R (D15S11), LS6–1 (D15S113), and GABAA receptor B3 (GABRB3). Three markers with 6–11 alleles and 73–83% heterozygosities were identified and analyzed by multiplex PCR. Gene-centromere mapping was performed on a panel of ovarian teratomas of known meiotic origin, and showed the most proximal marker, IR4–3R, to be 13 cM (95% confidence limits: 7–19 cM) from the centromere of chromosome 15. Molecular diagnostic studies were performed on 20 PWS and 9 AS patients. In 17 patients with deletions, the parental origin of deletion was determined. Ten PWS patients were shown to have maternal heterodisomy. Since these markers are only 13 cM from the centromere, heterodisomy indicates that maternal meiosis I nondisjunction is involved in the origin of UPD. In contrast, two paternal disomy cases of AS showed isodisomy for all markers tested along the length of chromosome 15. This suggests a paternal meiosis II nondisjunction event (without crossing over) or, more likely, monosomic conception (due to maternal nondisjunction) followed by chromosome duplication. This latter mechanism would indicate that UPD in PWS and AS may initiate as reciprocal products of maternal nondisjunction events.
INTRODUCTION
Prader–Willi syndrome (PWS) and Angelman syndrome (AS) represent striking examples of genomic imprinting in humans (1). They are distinct mental retardation disorders with very different phenotypic features. PWS is characterized by severe muscular hypotonia and feeding difficulties in infancy, hypogonadism with undescended testes in males, early onset of childhood hyperphagia and consequent obesity, short stature, small hands and feet, almond-shaped eyes, and hypopigmentation (2). AS is characterized by mental retardation of greater severity, microcephaly, seizures, lack of speech development, inappropriate bouts of laughter, ataxic gait, puppet-like upper-limb movements, large mandible, an open mouth with protruding tongue, and hypopigmentation (3, 4). Although these two disorders share almost no clinical features, they are both caused by abnormalities involving the same region of chromosome 15, q11–q13.
Approximately 70% of PWS patients have deletions detectable by high-resolution cytogenetic methods or by molecular methods, and these deletions are universally paternal in origin (5–7). An important, recent, finding is that most of the non-deletion patients show maternal uniparental disomy (UPD) (7, 8). For Angelman syndrome, 65–85% have deletions detectable by cytogenetic or molecular methods, and these are exclusively maternal in origin (9–12). Paternal disomy has been reported in three non-deletion AS cases (13, 14), but unlike PWS, this is an infrequent finding (12, 15). Neither a recognizable deletion nor UPD are found in 15–35% of AS patients. Wagstaff et al. (16) have presented data demonstrating that AS can be inherited as a dominant gene in 15q11 – q13 which is paternally imprinted (i.e., the paternal copy of the gene is normally inactive while the maternally inherited copy is active). This dominant form of AS may explain most familial occurrences of this disorder, and account for most non-deletion cases of AS.
These data are consistent with the hypothesis that at least two genes, both located within 15q11-q13, are involved in the etiology of PWS and AS, and that these genes are differentially imprinted: a PWS gene which is maternally imprinted (inactive on the maternal homologue) and an AS gene which is paternally imprinted (inactive on the paternal homologue).
The size of the common interstitial deletion in PWS/AS is estimated to be 3–4 megabases, at the limits of high-resolution cytogenetic detection. We have recently reported the isolation of yeast artificial chromosome (YAC) clones for nine anonymous DNA markers and one gene within and flanking the PWS/AS critical region (17). Multi-color fluorescence in situ hybridization (FISH) and YAC contig information were used to derive an unambiguous order for all 10 markers. The feasibility of using these YAC clones for detection of microdeletions in PWS and AS patients by FISH was demonstrated. However, FISH alone cannot provide information on the parental origin of deletions nor does it detect UPD.
We now report the isolation and characterization of three highly polymorphic CA dinucleotide repeats within the PWS/AS critical region. A multiplex PCR strategy was used to demonstrate the parental origin of deletions and to detect UPD in PWS and AS. These three markers are located relatively near the centromere of chromosome 15, and therefore, data obtained on UPD is particularly informative regarding the mechanisms of non-disjunction involved in its origin.
RESULTS
Dinucleotide repeat polymorphisms within the PWS/AS critical region
Three CA repeat polymorphisms were identified from YAC clones within the PWS/AS critical region, including A156E1 (identified with primers to IR4–3R at locus D15S11), A229A2 (from LS6–1 at locus D15S113), and B25E9 (from the GABAA receptor B3, GABRB3). These three YAC clones were previously shown to be located at different positions within the critical region: A156E1 in the proximal portion, B25E9 in the distal portion, and A229A2 in the central portion (17). Alu-PCR products from these YACs were screened for CA-repeats by the Alu-CA PCR technique described in Materials and Methods. Three CA repeats with 6–11 alleles and >70% heterozygosities were identified, one from each YAC. Two of these polymorphisms (IR4–3RCA and GABRB3CA) have been reported in part (18, 19).
The primer sequences, product sizes, and heterozygosity values (based on approximately 80 chromosomes) for the three polymorphisms are shown in Table 1. Primers were designed to produce products of sufficiently different sizes to allow simultaneous amplification and detection by multiplex PCR.
Table 1.
Dinucleotide repeat polymorphisms in the Prader-Willi/Angelman critical region
| Probe (YAC) |
Locus | Primer Sequence | Size (bp) |
# Alleles |
Heterozygosity |
|---|---|---|---|---|---|
| 4–3RCA | D15S11 | GACATGAACAGAGGTAAATTGGTGG | 243–263 | 10 | 74% |
| (A156E1) | GCTCTCTAAGATCACTGGATAGG | ||||
| LS6–1CA* | D15S113 | CATGTACTGTTTTATCCCTGTGGC | 130–140 | 6 | 73% |
| (A229A2) | CTGCTGCTTATACTCTTTCTCTATTC | ||||
| GABRB3CA | GABRB3 | CTCTTGTTCCTGTTGCTTTCAATACAC | 181–201 | 11 | 83% |
| (B25E9) | CACTGTGCTAGTAGATTCAGCTC | ||||
EMBL accession no. X68440.
Centromere mapping with ovarian teratomas
To be useful in determining the meiotic origin of nondisjunction events in uniparental disomy, it is important that polymorphic markers be relatively close to the centromere so that recombination events are minimized. There is no known polymorphism corresponding to the centromere region of chromosome 15; thus, standard linkage analysis is not possible to determine the distance between the centromere and markers in the PWS/AS critical region. An alternative approach for mapping genes relative to centromeres, using benign ovarian teratomas, has previously been described (20, 21). Most ovarian teratomas have a normal 46,XX karyotype, but are parthenogenetic, i.e., both sets of chromosomes are derived from the female host. A number of mechanisms have been identified in their origin (22), but the two most common (> 70%), involving failures of meiosis I and II, are useful in gene-centromere mapping. Type I teratomas result from a complete failure of meiosis I, producing heterozygosity for all centromeres. The latter can be detected by cytogenetic heteromorphisms on any chromosome. In the absence of recombination, any polymorphic marker heterozygous in the host will also be heterozygous in the tumor. Type II teratomas result from errors of meiosis n, producing homozygosity for all centromeres. In the absence of recombination, any polymorphic marker heterozygous in the host will be homozygous in the tumor. When recombination occurs, informative markers in type I and type II teratomas are reduced to homozygosity and retain heterozygosity, respectively, with frequencies determined by the map distance between the marker and the centromere. Analytic methods have been developed to determine recombination distances in panels of such tumors of known meiotic origin (20). A panel of ovarian teratomas, currently >115 samples, have been characterized by 10 cytogenetic heteromorphisms and 42 DNA markers (21, 22).
Multiplex PCR was run on 65 informative type I or type II tumors along with DNA from the normal host tissue. Examples of these results are shown in Figure 1 and the data are summarized in Table 2. Of the four hosts shown, three are heterozygous for all three markers, while the fourth is heterozygous for two of the three markers. All four ovarian teratomas shown arose by meiosis II error. For the first tumor (1.2), all markers are reduced to homozygosity, indicating no recombination. For the second tumor (9.2), all three markers are heterozygous, indicating a single recombination event between the centromere and 4–3R. The remaining two examples both show cross-over events between markers within the critical region. Tumor 52.2 is reduced to homozygosity at 4–3R, but is heterozygous at LS6 – 1, indicating a cross-over between these two markers. For tumor 69.2, 4–3R is reduced to homozygosity, while LS6–1 and GABRB3 are heterozygous, again indicating a cross-over between 4–3R and LS6–1.
Figure 1.
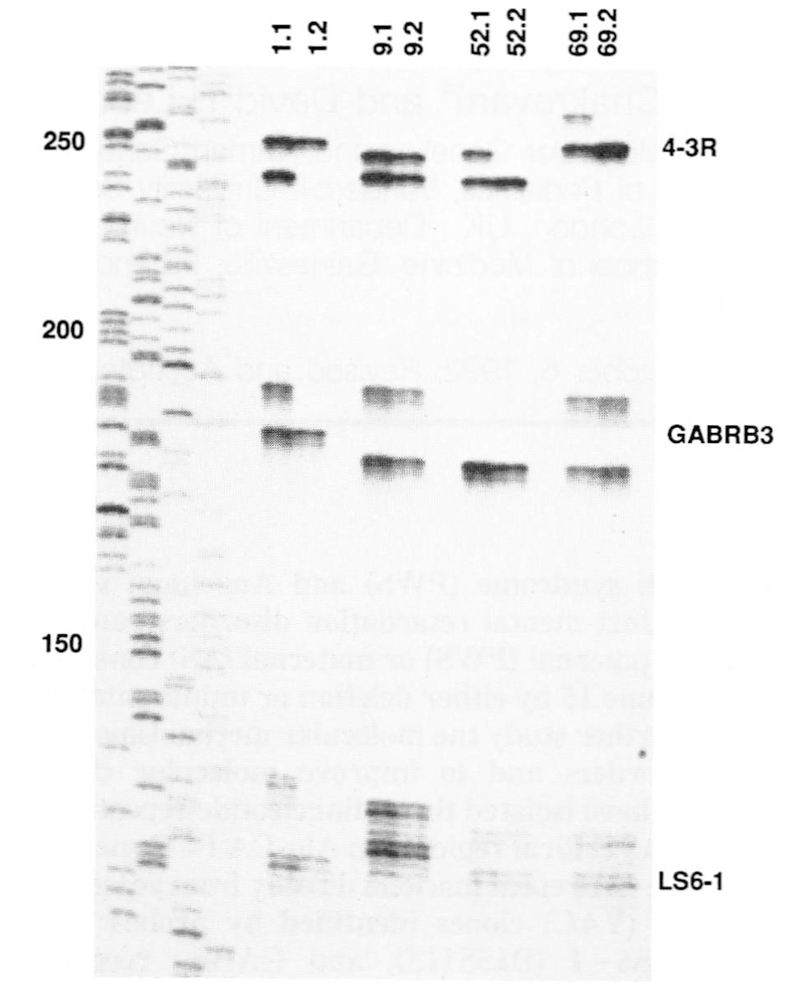
Multiplex PCR of three CA-repeats in the PWS/AS critical region on matched pairs of host-ovarian teratoma DNA samples (host DNA on the left of each pair). Hosts 1.1, 9.1, and 69.1 are heterozygous for all three markers, while 52.1 is heterozygous for 4–3R and LS6–1. Four ovarian teratomas which arose by meiosis II nondisjunction (type II) are shown. Given the order of the three markers as cen-(4–3R)-(LS6–1)-(GABRB3) the genotypes of the teratomas are − − − (1.2), + + + (9.2), − +U (52.2) and − + + (69.2), where + = retained heterozygosity, − = reduction to homozygosity, and U = uninformative. These four ovarian teratomas arose from lack of crossing over (1.2), a recombination event between the centromere and 4−3R (9.2), and, a recombination event between 4−3R and LS6−1 (52.2 and 69.2). Allele sizes range from approximately 130 basepairs (LS6—1) to 260 bp (4−3R) as determined by comparison to the M13mp18 sequencing standard shown to the left. 4−3R shows a prominent band for each allele, with a very faint minor band 2 bp smaller. GABRB3 shows a prominent band for each allele, as well as 2−4 smaller minor bands. LS6−1 has a somewhat more complicated pattern, in which the most prominent band is the second band in the sequence, with one minor band above and 2 or more minor bands below the prominent band.
Table 2.
Gene-centromere mapping of chromosome 15 polymorphisms in ovarian teratomas
| Marker Locus |
Ovarian Teratoma | Multipoint lod score |
Map distance (cM) |
|||
|---|---|---|---|---|---|---|
| Type I | Type II | |||||
| na | +b | n | + | |||
| 15cen | 24 | 24 | 41 | 0 | – | – |
| 4–3R (D15S11) | 17 | 15 | 26 | 7 | 7.14 | 13.0 ± 3.2 |
| LS6–1 (D15S113) | 16 | 14 | 31 | 14 | 11.01 | 3.5 ± 2.5 |
| GABRB3 | 18 | 16 | 36 | 12 | 15.39 | 0.0 |
n = sample size.
+ = number of heterozygous teratomas.
Gene-centromere mapping of chromosome 15 CA-repeat polymorphisms within the PWS/AS critical region on chromosome 15. The marker loci are arranged in their presumed physical order relative to the centromere. 24 ovarian teratomas arising by meiosis I nondisjunction (type I) and 41 arising by meiosis II nondisjunction (type II) were studied. For each locus, the number of informative (heterozygous) hosts and the number of tumors retaining heterozygosity are listed. The map distances, and associated maximum lod scores, for the three intervals 15cen-(4–3R), (4–3R)-(LS6–l) and (LS6–l)-(GABRB3) were estimated from all teratomas by likelihood analysis as described in Materials and Methods.
Table 2 provides the salient data on teratoma mapping. The frequencies of retained heterozygosity for each of the three markers are high (88–89%) for type I tumors and low (27–45%) for type II tumors suggesting that all markers are genetically close to the centromere. We next estimated the intermarker map distances by maximum likelihood from all 65 informative tumors. The map distances for the three intervals 15cen-(4–3R), (4–3R)-(LS6–l) and (LS6–1)-(GABRB3) were 13.0 cM (95% confidence limits (CL): 7–19 cM; lod score = 7.14), 3.5 cM (95% CL: 0–8 cM; lod score = 11.01) and 0.0 cM (lod score = 15.39), respectively. All markers show significant evidence of linkage with the most proximal marker 4–3R being 13 cM from the centromere. It is reassuring that the (4–3R)-(GABRB3) distance estimated from linkage analysis in CEPH families is 3.6 cM (A. Bowcock, personal communication) and almost identical to that estimated from ovarian teratomas. Although map distances were also estimated from type I and type II teratomas separately, the difference was not statistically significant (X2 = 2.46, 2 df, p > 0.25).
Multiplex PCR analysis of PWS and AS patients
The three markers were run in a multiplex reaction to genotype 20 PWS patients, 9 AS patients and their parents. All patients had typical clinical features of PWS or AS (see Materials and Methods). Some of the patients were previously characterized by FISH or by RFLP-dosage analysis (8, 12, 14, 17).
Examples of the analysis of PWS and AS patients are shown in Figure 2 and the data are summarized in Figure 3. Unlike previous RFLP studies which relied heavily on dosage analysis for the characterization of deletions, multiallelic CA-repeat markers have allowed the determination of parental origin of deletion in all cases. For example, patient MM18 is a PWS patient known to have a deletion (Mascari and Nicholls, unpublished). PCR analysis showed a single maternal allele for all three markers, and the consequent failure to inherit a paternal allele for GABRB3 and LS6–1: 4–3R was uninformative (Figure 2). AS127 is an AS patient with known deletion (12). The patient shows a single paternal allele for all three markers, and failure to inherit a maternal allele for 4–3R and LS6–1: GABRB3 was uninformative. For the 17 deletion patients, one marker was informative in 10 cases, two markers in 5 cases and all three markers in 2 cases (Figure 3).
Figure 2.
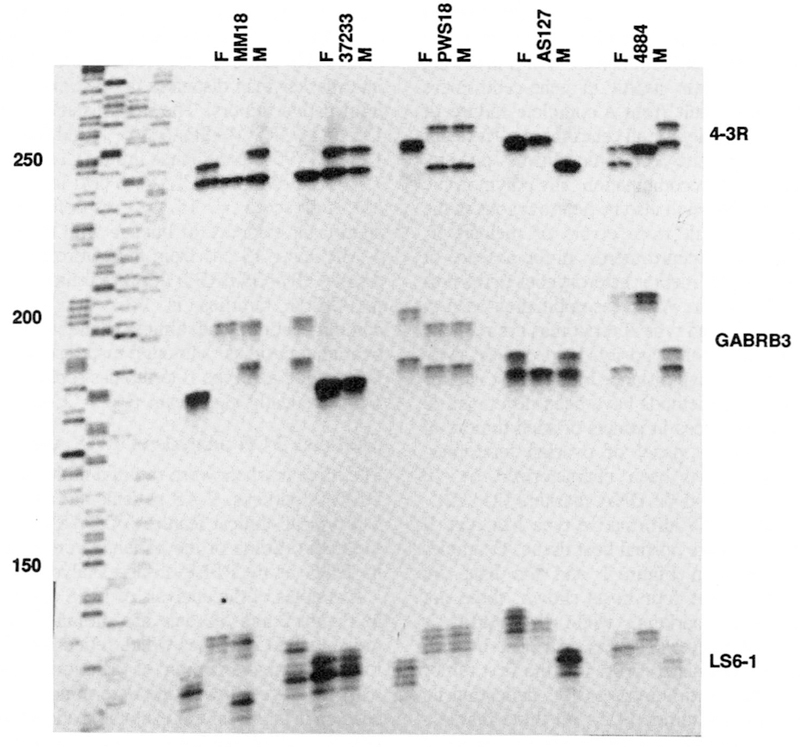
Multiplex PCR analysis of PWS (MM18, 37233, PWS18) and AS (AS127, 4884) patients. For each family, the father is on the left, patient in the middle, and mother on the right. An M13mp18 sequencing standard is shown on the left for size determinations. See text for discussion and inteipretation.
Figure 3.
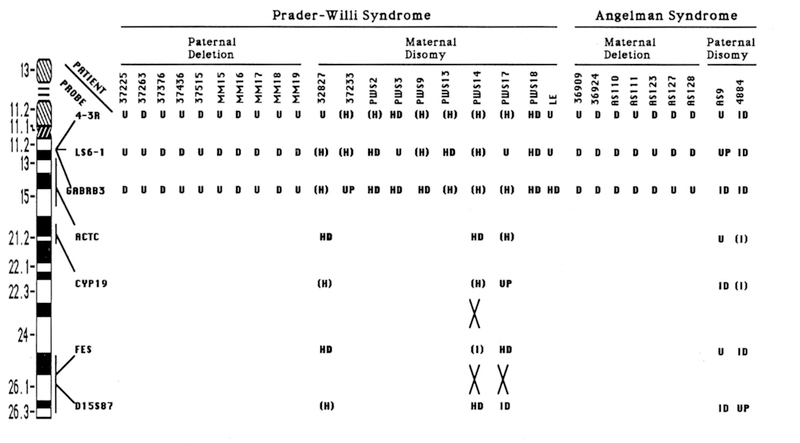
Summary of CA repeat data on PWS and AS patients. The location of each of the CA repeat markers is shown on an idiogram of chromosome 15. For deletion patients, marker results were either uninformative (U) or a deletion (D) was inferred from failure to inherit an allele from one parent after abnormal cytogenetic and FISH data. For UPD patients, results were either U (uninformative), UP (uniparental disomy was indicated by failure to inherit an allele from one parent, but could not distinguish hetero-vs. isodisomy, HD (heterodisomy, two different alleles from the same parent), (H) (heterozygous for the marker, but not informative for uniparental disomy status), ID (isodisomy, inheritance of only one allele from a parent heterozygous at that locus), or (I) (homozygous at that locus, but not informative for uniparental disomy status). Recombination events between markers are indicated by large Xs. Data demonstrating deletions by FISH or RFLP analysis were previously reported for PWS patients 37225, 37263, 37376, 37436, 37515 (17) and for AS patients 36909 and 36924 (17) and AS110, AS111, AS123, AS127, and AS128 (12). Data demonstrating uniparental disomy by RFLP analysis was previously reported for PWS patients PWS2, PWS3, PWS9, PWS13, PWS14, PWS17, and PWS18 (8) and for AS patient AS9 (14).
Ten PWS patients with UPD were studied. In this analysis, heterozygosity confirms there is no deletion present. A fully informative result occurs when the patient is heterozygous for two different maternal alleles, and neither of these alleles is shared with the father: an example is provided by patient PWS 18 (Figure 2). In contrast, patient 37233 is heterozygous and therefore not deleted at 4–3R and LS6–1, but is uninformative for uniparental disomy at these loci since one allele is shared with the father in each case. For GABRB3, the patient has a single maternal allele and failed to inherit either paternal allele. This result is consistent with paternal deletion or maternal disomy. Because the patient is known by FISH to have two copies of GABRB3 (17), this result is interpreted as maternal disomy.
For three PWS patients (32827, PWS 14, and PWS 17), genotypes from the three markers within the critical region were uninformative for UPD (Figure 3). In these cases, four additional microsatellite markers outside the critical region were analyzed and the results are shown in Figure 3. These included ACTC at 15ql3–ql5 (23, 24), CYP19 at 15q21 (25), FES at 15q25–26 (26), and D15S87 at 15q25–q26 (24, 27). At least 2 of the 4 markers tested, outside of the critical region, were informative for maternal disomy in each of these three patients. For PWS17, a crossover was detected between FES and the more distal marker D15S87 as indicated by a reduction to homozygosity at D15S87. For PWS 14, two crossovers were detected: one between ACTC and FES and one between FES and D15S87.
For the 10 PWS patients with maternal disomy, all markers in the critical region which were heterozygous in the mother were also heterozygous in the proband. Heterozygosity for markers close to the centromere indicates a maternal meiosis I nondisjunction event. Since the distance between 4–3R and the centromere was estimated at 13 cM, use of this marker as representative of centromere status will be approximately 90% accurate (87 % assuming MI and ME nondisjunction occurs with equal frequency, >90% assuming MI accounts for the majority of nondisjunction events).
The two cases of AS with paternal disomy showed quite different results. Both patients showed isodisomy for 3–4 markers tested, within the critical region and more distal on chromosome 15. Previous RFLP studies on patient AS9 showed isodisomy for two markers in the critical region (IR4–3R and 3–21) and for two markers outside the critical region (CMW-1 at ql3 and MS620 at q26) (14). These data are consistent with a paternal meiosis II nondisjunction with no recombination, or a monosomic conception (due to maternal nondisjunction) followed by post-zygotic nondisjunction which duplicated the paternal homologue.
DISCUSSION
Molecular studies to date on PWS and AS have relied on Southern blot analysis using conventional RFLP markers with heterozygosity values of 0.4 or less (5), making them only moderately informative for detection of deletion or uniparental disomy. We have recently demonstrated that FISH analysis using yeast artificial chromosome (YAC) clones from the critical region was a reliable method for the detection of deletions (17). However, FISH alone fails to provide information on the parental origin of the deletion and cannot detect uniparental disomy. For detection of uniparental disomy, a simple method based on highly informative polymorphisms performed by PCR would be desirable.
CA dinucleotide repeat polymorphisms are ideal markers for many applications in human genetics because they are multi-allelic, have high polymorphic information content (usually ≥70%), and are PCR-based (23, 28). To develop markers within this region, we used an Alu-CA PCR technique to isolate CA repeats directly from YAC clones. We were successful in isolating one highly polymorphic marker from each of three YACs, ranging from 150–250 kb in size. Since the starting template for our Alu-CA PCR step was limited to the Alu–Alu PCR products from each YAC, only a subset of all CA repeats present in the YACs are represented. However, because of the large number of alleles for each marker and high heterozygosity values, one marker per YAC of this size is an acceptable yield.
Molecular diagnosis by multiplex PCR of CA repeats
Recent studies have shown a remarkable consistency in the size of the deletion in both PWS and AS syndrome, with the majority of patients demonstrating breakpoints contained within single YACs on the proximal and distal side of the deletion (17). These data suggest preferential sites for chromosome breakage at both boundaries of the common deletion interval. Because of this consistency, polymorphic markers within the critical region will reliably detect the majority of deletions. The three CA-repeats developed in this study originate from the proximal, distal, and middle portions of the common deletion interval. Because each of the three markers have heterozygosity values of ≥70%, the probability of detecting a deletion which involves the entire region is extremely high (≥97%).
Using a multiplex PCR reaction, deletions were correctly identified in all 17 PWS and AS patients studied. In addition, all cases were informative as to parental origin of the deletion. Thus, the multiplex PCR analysis is a useful molecular diagnostic tool for identification of deletions in these two disorders. However, PCR alone will not identify the rare cases of PWS or AS which result from subtle balanced translocations in one of the parents. Several such translocations have now been reported, usually involving chromosome 15 and another acrocentric chromosome (29–31). FISH analysis will likely become the method of choice for characterization of deletion events, as it can distinguish de novo interstitial deletions versus unbalanced translocations segregating from parental balanced rearrangements.
Detection of UPD and its mechanism of origin
The multiplex PCR of three CA repeats within the critical region was also useful in the identification of UPD in PWS and AS patients. These three markers alone were informative for UPD in 7/10 PWS patients and in 2/2 AS patients. In 3 PWS patients, additional polymorphic markers had to be tested because the three markers within the critical region were not fully informative. One or two additional CA repeats with high informativeness could be added to the current multiplex of three markers in order to make the system fully informative in the majority of cases.
Centromere mapping was employed to determine the genetic distance between the critical region markers and the chromosome 15 centromere. The observed distance of 13 cM between the centromere and IR4–3R is somewhat higher than expected, given the estimated physical distance (one metaphase band or approximately 5 Mbp). However, this is consistent with previous investigations of meiotic chiasmata in males in which Saadallah and Hulten (34) noted that 90% of chromosome 15 bivalents showed two chiasmata, one always located near the distal q telomere and the other located proximally near the centromere. This observation was taken as evidence against the commonly-held belief that chiasmata never occur near the centromeres of human chromosomes.
We considered the possibility that the apparent increase in recombination could be due to mistyping of the teratomas in their original classification as type I or type II tumors, or mistyping in the analysis of the three CA-repeat markers. However, the classification of the teratomas showing recombination events was based on an average of 3.7 informative markers, and multiplex PCR analysis provides simultaneous information on other markers which would identify sample misidentification or other errors (35). Thus, mistyping errors are unlikely.
Several mechanisms have been proposed for the origin of uniparental disomy in humans (32, 33), and include: 1) gamete complementation, in which a nullosomic gamete and disomic gamete are fused, 2) trisomy to disomy, in which a meiotic nondisjunction event in one parent contributes two chromosomes to a trisomic conceptus, followed by post-zygotic loss of the other parent’s homologue, and 3) monosomy to disomy, in which a nullosomic and normal gamete are fused, followed by a post-zygotic nondisjunction event which duplicates the monosomic chromosome. Mechanisms 1 and 2 both predict some degree of heterozygosity along the length of the chromosome involved, and are impossible to distinguish from each other unless the trisomic cell line is observed in a mosaic state. One would predict heterozygosity for markers near the centromere in meiosis I errors, and heterozygosity for more distal markers in the case of meiosis II errors.
Assuming that the genetic distance of 13 cM is accurate, the current markers can be used to distinguish meiosis I from meiosis II nondisjunction events with an accuracy of ≥87% (since meiosis I errors are known to be more frequent than meiosis II errors, this is a conservative estimate). In our analysis, 10/10 PWS patients showed heterodisomy, consistent with maternal meiosis I nondisjunction. These results are similar to those reported by others (7, 8), in which the majority of PWS with UPD showed heterodisomy. In this group, an increased maternal age was detected, again consistent with maternal meiosis I non-disjunction.
In support of mechanism 2, two recent case reports provide direct evidence for trisomic conception leading to uniparental disomy (36, 37). In both cases, trisomy 15 (mosaic in one case; non-mosaic in the other) was observed in chorion villus cells at prenatal diagnosis for advanced maternal age, while only normal cells were detected at follow-up amniocentesis. At birth, both infants showed clinical features of Prader–Willi syndrome and DNA analysis documented maternal disomy.
Thus, all data at present on UPD in PWS are consistent with mechanism 2: advanced maternal age leads to an increased risk of meiosis I nondisjunction and trisomic conception (Figure 4). The majority of these conceptions would likely result in spontaneous abortion, unless a second event occurred in which one of the 15 homologues was lost. If the paternal homologue is lost (one-third chance), maternal disomy results in the phenotype of PWS.
Figure 4.
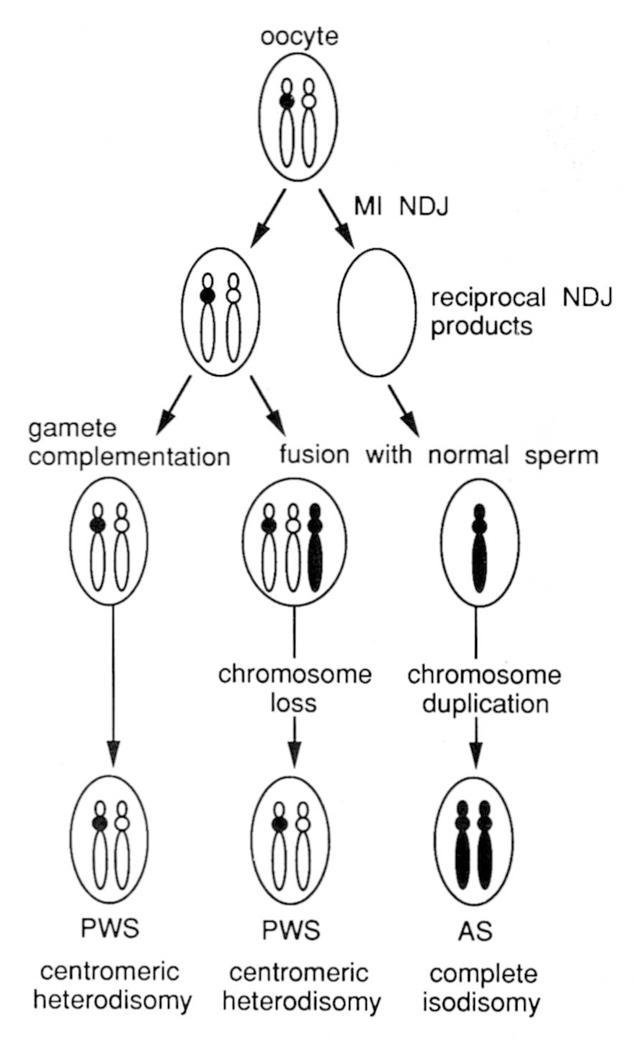
Proposed model for the mechanism of uniparental disomy in PWS and AS resulting from reciprocal products of maternal meisosis I (MI) nondisjunction (NDJ) events. Maternal chromosome 15 homologues are shown in white, with the centromeres of the two different homologues either white or black. Disomic and monosomic gametes are produced as a result of MI NDJ. The disomic egg may be fertilized by a sperm which is nullosomic for chromosome 15 (gamete complementation), or by a normal sperm to produce trisomy 15. The nullosomic egg is fertilized by a normal sperm to produce monosomy 15. Chromosome loss in the trisomic conceptus or chromosome duplication in the monosomic conceptus may occur as postzygotic events which ‘rescue’ otherwise lethal conditions. Both gamete complementation and trisomy → disomy mechanisms of maternal disomy predict heterozygosity for centromeric markers, while distal markers may be heterozygous or homozygous depending on recombination events. Paternal disomy in AS arising by the monosomy → disomy model will exhibit homozygosity for all markers on the chromosome (complete isodisomy).
For AS, the situation appears to be different from PWS. In our two cases, isodisomy was observed for all markers tested along the length of chromosome 15. These results can be explained by gamete complementation (mechanism 1) or trisomy to disomy (mechanism 2), but would require a meiosis II nondisjunction event and no recombination. Mechanism 3, monosomy to disomy, predicts homozygosity for all markers along the entire length of the chromosome, and seems to be a more likely explanation. This has been the preferred explanation for several previous UPD reports in which complete isodisomy was observed (33, 38). This kind of somatic selection has been observed in two cases of isodisomy for chromosome 21, in which a constitutional abnormality of chromosome 21 was present at birth but was lost and replaced by a duplicated copy of the normal 21 in later life (39). Such somatic events are also common in certain cancers such as retinoblastoma, in which loss of heterozygosity is associated with the presence of two copies of the homologue bearing the rb mutation (40).
Four other cases of paternal disomy are known in AS, one with heterodisomy and three with isodisomy (13; W.Robinson, personal communication). It is intriguing that 5/6 AS cases show complete isodisomy when the majority of PWS show heterodisomy. It is tempting to speculate that maternal nondisjunction is the primary event in both PWS and AS, followed by ‘rescue’ of the trisomic (PWS) or monosomic (AS) conceptus by a second nondisjunction event (Figure 4). If this were true, then paternal disomy cases of AS would also be associated with increased maternal age. The two cases reported here have maternal ages of 33 (AS9) and 31 (4884), consistent with this prediction.
Although maternal disomy in PWS and paternal disomy in AS may initiate from reciprocal products of maternal nondisjunction events, maternal disomy in PWS appears far more common than paternal disomy in AS. This is likely due to several factors. It may be that a trisomy 15 conceptus has greater viability in early fetal development, providing more opportunity for the second mitotic nondisjunction event to occur. Monosomy 15 may be lethal extremely early, so that the second event must occur at a very early stage. It may also be the case that chromosome loss (by mitotic nondisjunction or anaphase lag) is more common than chromosome gain (by mitotic nondisjunction only).
It will be of great interest to gather additional data on paternal disomy in AS to confirm the apparent excess of isodisomy and to determine whether a maternal age effect is present. It will also be interesting to determine whether maternal meiosis I non-disjunction errors are the primary events in UPD for other human chromosomes and are therefore maternal age related. Since all autosomal monosomies and most trisomies are lethal prenatally, a secondary post-zygotic event which restores disomy will be subject to strong positive selection in vivo. UPD for some human chromosomes may also be lethal, and this could be a currently undetected cause of spontaneous abortion. However, UPD for other chromosomes is likely to be viable, with some producing abnormal phenotypes and others producing no phenotype at all. As methods for the analysis of microsatellite polymorphisms improve and eventually become automated, it may be feasible to routinely screen advanced maternal age patients undergoing amniocentesis or CVS for UPD of all human chromosomes.
MATERIALS AND METHODS
Patients
Studies were performed on a total of 20 PWS and 9 AS patients, all of which had typical clinical features of these disorders. Most patients have been previously described in other reports, as indicated in the legend to Figure 3. Peripheral blood samples or lymphoblastoid cell lines were obtained for the patient and both parents for DNA isolation by routine methods.
Identification and cloning of CA repeat polymorphisms
We previously reported the isolation of 51 YAC clones within and flanking the common deletion interval for PWS and AS (17). To develop highly polymorphic dinucleotide repeat polymorphisms within this region, a cloning strategy was carried out which was modified from that of Feener et al. (41). To identify CA-repeat loci, we chose three YACs from the proximal, distal, and middle portion of the critical region. YAC A156E1 is a 250 kb YAC identified with primers to probe IR4–3R (D15S11); YAC B25E9 is a 150 kb YAC identified with primers to GABRB3; YAC A229A2 is a 250 kb YAC isolated with primers to LS6–1 (D15S113). The steps of the protocol included 1) generation of Alu PCR products from each YAC, 2) a second PCR amplification using Alu-CA or Alu-GT primers on the Alu-PCR products obtained in the first step, followed by sub-cloning and sequencing of the Alu-CA or Alu-GT products to generate unique primers flanking the CA repeat. In theory, this step should generate PCR products from both sides of the CA repeat and allow identification of unique primers flanking the repeat. In practice, the efficiency of step 2 was rather low, and only one side of the flanking sequence could be obtained. To obtain a PCR product from the other side, a third PCR step was required using the unique primer generated in step 2 and an Alu primer. Products from this step were also sub-cloned and sequenced to obtain a second unique primer on the opposite flanking side of the CA repeat.
The first step of the protocol was to generate Alu PCR products of each YAC (42). DNA from each of the three YACs was amplified with two different Alu primers individually or in combination as follows: a) PDJ34 alone, [TG-AGC(C/T)(G/A)(A/T)GAT(C/T)(G/A)(C/T)(G/A)CCA(C/T)TGCACTCCAGCC TGGG] (43), b) 2484 alone, [AGGAGTGAGCCACCGCACCCAGCC] (17), or c) use of PDJ34 and 2484 together in the same reaction. PCR was performed as previously described (17). PDJ34 and 2484 were used at final concentrations of 0.1 μM and 0.3 μM, respectively, in 100 μl reactions containing ~0.5 μg YAC DNA, 250 μM each dNTP, 10 mM Tris–HCl pH 8.4, 50 mM KCl, 1.2 mM MgCl2, and 2.5 units of Thermits aquaticus polymerase (Perkin-Elmer Cetus). Initial denaturation was at 95 °C for 4 min, followed by 35 cycles of denaturation at 94 °C for 1 min, annealing at 55°C for 1 min, extension at 72°C for 4 min and a final extension at 72°C for 7 min.
Each of these Alu-PCR reactions yielded approximately 3–5 major products, as well as additional minor (faint) bands. For the second step of the protocol, the Alu PCR products for each YAC were pooled together (5 ng of PDJ34 product or 5 ng of 2484 product and 10 ng of PDJ34/2484 product) and screened for CA repeats by PCR using the previously described dinucleotide repeat primers BAM-CA [CCCGGATCCACACACACACACACACAC] and BAM-TG [CCCGGATCCTGTGTG TGTGTGTGTGTG] (41). Each of these two primers was used in a PCR reaction with Alu primers PDJ34 and 2484. The PCR was performed in various combinations (BAM-CA/PDJ34, BAM-CA/2484, BAM-TG/PDJ34 and BAM-TG/2484). BAM-CA and BAM-TG were used at final concentrations of 1 μM, PDJ34 at 0.1 μM and 2484 at 0.3 μM. The PCR reaction conditions were the same as described above. The PCR products were then incubated with 1 unit of DNA polymerase I (Klenow enzyme, Boehringer, Mannheim) at 37°C for 20 minutes to fill in the 3′ ends, incubated at 65°C for 10 min to inactivate the enzyme, and precipitated (44). The Alu-CA or Alu-TG PCR fragments were separated from Alu–Alu products on an Ethidium Bromide stained 1% agarose gel in TBE.
Each of these PCR reactions yielded the original Alu-PCR products plus an average of 2–3 new bands produced by the Alu-CA or Alu-GT amplification. These new fragments were excised from the gel and sub-cloned into pBluescript SK+ (Stratagene). Dideoxy sequencing was performed on each subclone using the Sequenase version 2.0 kit (United States Biochemical Corporation). In order to maximize the potential for polymorphic content, only clones which showed 10 or more CA repeats in their sequence were studied further. For these clones, oligonucleotide primers were synthesized on an Applied Biosystems DNA synthesizer (model 380B) from the sequences of either the CA or TG strand. On average, three unique primers were constructed per YAC. These three primers were then tested in combinations with each other to determine if any two amplified the same CA repeat. Unfortunately, this was not the case for any of the CA repeats, indicating sequence had been obtained on only one side for each.
To obtain the flanking sequence from the other side of the CA repeat for each clone, a third PCR reaction was performed using each unique primer in combination with one of the two Alu primers. For this reaction, 0.5 μg of YAC DNA or 10 ng of combined Alu products from the YAC were used as template. The PCR was performed in two combinations (unique primer/PDJ34 and unique primer/2484) with PDJ34 and 2484 alone as controls. The concentration of unique primers was 0.5–1 μM, and the PCR conditions were the same as above. The Klenow treated Alu-unique primer fragments were separated from Alu–Alu fragments on an agarose gel, and were subcloned and sequenced as described above to generate a unique primer from the other side of the CA repeat.
Other microsatellite repeats on chromosome 15
Three new dinucleotide repeats, 4–3RCA, LS6–1CA and GABRB3CA, were identified by the Alu-CA PCR method described above (Table 1 and refs. 18, 19). In addition to these three markers within the PWS/AS critical region, four previously described microsatellite markers from outside the critical region on chromosome 15 were used in the analysis of some UPD patients. The location of these markers on chromosome 15 is shown in Figure 3. ACTC is a CA-repeat located in the cardiac muscle actin gene at 15q13–q15 (23, 24); CYP19 is a (TTTA)n repeat located at 15q21.1 (25); FES is a (ATTT)n repeat in an intron of the human c-fes proto-oncogene located at 15q25-qter (26). D15S87 is a CA-repeat (27) which has been mapped distal to FES by linkage mapping in CEPH pedigrees (24).
PCR analysis
Genomic DNA of the patients was prepared directly from peripheral blood leukocytes or from Epstein–Barr virus-transformed lymphoblastoid cell lines. The three markers within the critical region, 4–3RCA, LS6–1CA and GABRB3CA, were used in a multiplex PCR reaction according to our previously described methods (35). The other four markers outside the critical region were run on a subset of patients and were amplified individually. One strand of each primer pair was end-labeled for 1–2 hours at 37°C in a volume of 10 μl containing 10 μM primer, 0.025 mCi [32P]ATP (Amersham) at 3000 Ci/mmol, 10 mM MgCl2, 5 mM DTT, 50 mM Tris–HC1, pH 7.6, and 9 units of T4 polynucleotide kinase (Pharmacia). Without further separation of the unincorporated nucleotides, the kinased reaction mixture was added to the PCR buffer mix.
The PCR reactions were performed in a total volume of 20 μl using 25 ng of genomic DNA in 250 μM each of the dNTPs, 10 mM Tris–Hcl pH 8.4, 50 mM Kcl, 1.2 mM MgCl2, and 0.5 units of Thermus aquaticus DNA polymerase (Perkin Elmer Cetus). The primers were added to each multiplex PCR mixture with the final primer concentration as follows: 0.2 μM for 4–3RCA, 0.15 μM for LS6–1CA, and 0.2 μM for GABRB3CA. The four other markers were amplified as single PCR reactions with primer concentrations as follows: 0.2 μM for CYP19, 0.4 μM for ACTC, 0.3 μM for FES and 0.4 μM for D15S87.
For multiplex or single PCR reactions, initial denaturation was at 95°C for 4 min followed by 25 cycles of denaturation at 94°C for 1 min, annealing at 55°C min for 2 min, extension at 72°C for 2 min and a final extension of 72°C for 7 min. Two microliters of each reaction was mixed with 1 μl formamide-loading buffer (45), heated at 95°C for 2 min, put on ice for 30 second and then loaded onto a 6% polyacrylamide/7 M urea gel. DNA fragments were size-fractionated on a 33×40-cm gel at 70 watts until the tracking dye, xylene cyanol FF or Bromphenol blue, reached the bottom of the gel. After electrophoresis, the wet gel was wrapped with Reynolds 914 film and exposed to Kodak XAR-5 X-ray film for 6–24 hrs at 70°C with an intensifying screen.
Gene-centromere mapping
DNA samples from ovarian teratomas arising by whole genome meiosis I nondisjunction (type I, 24 samples) and meiosis II nondisjunction (type n, 41 samples), and the correpsonding 65 hosts were genotyped at the three CA-repeat loci 4–3R, LS6–1 and GABRB3. The above sample sizes refer to those that were informative for at least one or more marker loci. A total of 105 ovarian teratomas were genotyped of which 2 were uninformative for chromosome 15 markers, 5 samples were contaminated with normal non-tumor tissue; 33 tumors had either a mitotic origin or were due to whole genome endoreduplication and were uninformative for linkage (21, 22).
For map analysis, we assumed the gene order 15cen-(4–3R)-(LS6–l)-(GABRB3) and assumed that recombination events occurred in each interval independently of other intervals. The latter assumption is not crucial for small map distances as we have estimated.
For ovarian teratoma mapping we used the following probabilities derived in Chakravarti and Slaugenhaupt (46):
Pr { distal marker + | proximal marker + } = 1 – y/2 and, Pr { distal marker + | proximal marker − } = y, where + = heterozygous, – = homozygous, Pr = probability, | = ‘conditional on’, and y = tetratype frequency. The likelihood of an individual teratoma was calculated as the product of the above relevant probabilities. Thus, the likelihood of a type I teratoma with genotype (+) + − + for the markers (15cen), 4–3R, LS6–1 and GABRB3 is (1 – y1/2)(y2/2)y3 where y1, y2, and y3 are the adjacent interlocus distances. The likelihood of the data L(y1, y2, y3) was evaluated as the product of the likelihoods of each of the 65 teratomas. For calculating lod scores we used the formula (shown for interval 1):
where are the maximum likelihood estimates and yi = 2/3 for no linkage (see ref. 46).
The map distances for each interval and the associated lod score for linkage between adjacent markers were estimated by maximum likelihood. For multiple markers the likelihood function was evaluated as described in Chakravarti et al. (ref. 20, pg. 58, equation [7]) and the maximum likelihood parameter estimates and their asymptotic standard errors were calculated using MENDEL (47). Map analysis was performed on type I and type II tumors separately, and on all 65 tumors taken together. Since no double crossovers were identified, final map distances in centiMorgans were calculated assuming complete chiasmata interference, i.e. y = 2×map distance.
ACKNOWLEDGEMENTS
This work was supported by grants from the National Institutes of Health (HD20619 and HG(XX)24 to D.H.L.; HG00344 to A.C.), the Beneficia Foundation (to D.H.L.) and the American Heart Association, Florida Affiliate (to R.D.N.). The collection and cytogenetic characterization of the ovarian teratomas was supported by NCI grant CA43882. R.D.N. is a Pew Scholar in the Biomedical Sciences and is supported by a Basil O’Connor Starter Scholar Research Award from the March of Dimes Birth Defects Foundation.
REFERENCES
- 1.Hali JG (1990) Am. J. Hum. Genet, 46, 857 – 873. [PMC free article] [PubMed] [Google Scholar]
- 2.Butler MG (1990) Am. J. Med. Genet. 35, 319–332. [DOI] [PMC free article] [PubMed] [Google Scholar]
- 3.Williams CA, Gray BA, Hendrickson JE, Stone JW and Cantu ES(1989) Am. J. Med. Genet. 32, 339 – 345. [DOI] [PubMed] [Google Scholar]
- 4.Clayton-Smith J and Pembrey ME (1992) J. Med. Genet. 29, 412–415. [DOI] [PMC free article] [PubMed] [Google Scholar]
- 5.Nicholls RD, Knoll JH, Glatt K, Hersh JH, Brewster TD, Graham JM, Wurster-Hill D, Wharton R and Latt SA (1989) Am. J. Med. Genet. 33, 66 –77. [DOI] [PubMed] [Google Scholar]
- 6.Hamabe J, Fukushima Y, Harada N, Abe K, Matsuo N, Nagai T, Yoshioka A, Tonoki H, Tsukima R and Niikawa N (1991) Am. J. Med. Genet. 41, 54 – 63. [DOI] [PubMed] [Google Scholar]
- 7.Robinson WP, Bottani A, Yagang X, Balakrishman J, Binkirt F, Manchler M, Prader A and Schinzel A (1991) Am. J. Hum. Genet. 49, 1219–1234. [PMC free article] [PubMed] [Google Scholar]
- 8.Mascari MJ, Gottlieb W, Rogan PK, Butler MG, Waller DA, Armour JAL, Jeffreys AJ, Ladda RL and Nicholls RD (1992) New Engl. J. Med. 326, 1599–1607. [DOI] [PMC free article] [PubMed] [Google Scholar]
- 9.Knoll JHM, Nicholls RD, Magenis RE, Graham JM, Lalande M and Latt SA (1989) Am. J. Med. Genet. 32, 285 –290. [DOI] [PubMed] [Google Scholar]
- 10.Williams CA, Zori RT, Stone JW, Gray BA, Cantu ES and Ostrer H (1990) Am. J. Med. Genet. 35, 350–353. [DOI] [PubMed] [Google Scholar]
- 11.Hamabe J, Kuroki Y, Imaizumi K, Sugimoto T, Fukushima Y, Yamaguchi A, Izumikawa Y and Niikawa N (1991) Am. J. Med. Genet. 41, 64–68. [DOI] [PubMed] [Google Scholar]
- 12.Zackowski JL, Nicholls RD, Gray BA, Bent-Williams A, Gottlieb W, Harris PJ, Waters MF, Driscoll DJ, Zori RT and Williams CA (1992) Am. J. Med. Genet, in press. [DOI] [PubMed] [Google Scholar]
- 13.Malcolm S, Clayton-Smith J, Nichols M, Robb S, Webb T, Armour JAL, Jeffreys AJ and Pembrey ME (1991) Lancet 337, 694–697. [DOI] [PubMed] [Google Scholar]
- 14.Nicholls RD, Pai GS, Gottlieb W and Cantu ES (1992) Annals Neur. in press. [DOI] [PubMed] [Google Scholar]
- 15.Knoll JHM, Glatt KA, Nicholls RD, Malcolm S and Lalande M (1991) Am. J. Hum. Genet. 48, 16–21. [PMC free article] [PubMed] [Google Scholar]
- 16.Wagstaff J, Knoll JHM, Glatt KA, Shugart YY, Sommer A and Lalande M (1992) Nature Genet. 1, 291–294. [DOI] [PubMed] [Google Scholar]
- 17.Kuwano A, Mutirangura A, Dittrich B, Buiting K, Horsthemke B, Saitoh S, Niikawa N, Ledbetter SA, Chinault AC and Ledbetter DH (1992) Hum. Molec. Genet. 1, 417–425. [DOI] [PubMed] [Google Scholar]
- 18.Mutirangura A, Ledbetter SA, Chinault AC and Ledbetter DH (1992) Hum. Molec. Genet. 1, 67. [DOI] [PubMed] [Google Scholar]
- 19.Mutirangura A, Kuwano A, Ledbetter SA, Chinault AC and Ledbetter DH (1992) Hum. Molec. Genet. 1, 139. [DOI] [PubMed] [Google Scholar]
- 20.Chakravarti A, Majumder PP, Slaugenhaupt SA, Deka R, Warren BAC, Surti U, Ferrell RE and Antonarakis SE (1989) in Hassold TJ and Epstein CJ (eds), Molecular and Cytogenetic Studies of Non-Disjunction. Alan R. Liss, New York: pp. 45–79. [Google Scholar]
- 21.Deka R, Chakravarti A, Surti U, Hauselman E, Reefer J, Majumder PP and Ferrell RE (1990) Am. J. Hum. Genet. 47, 644–655. [PMC free article] [PubMed] [Google Scholar]
- 22.Surti U, Hoffner L, Chakravarti A and Ferrell RE (1990) Am. J. Hum. Genet. 47, 635–643. [PMC free article] [PubMed] [Google Scholar]
- 23.Litt M and Luty JA (1989) Am. J. Hum. Genet. 44, 397–401. [PMC free article] [PubMed] [Google Scholar]
- 24.Donlon TA (1992) Cytogenet. Cell Genet, in press. [PubMed] [Google Scholar]
- 25.Polymeropoulos MH, Xiao H, Rath DS and Merill CR (1991) Nucleic Acids Res. 19, 195. [DOI] [PMC free article] [PubMed] [Google Scholar]
- 26.Polymeropoulos MH, Rath DS, Xiao H and Merril CR (1991) Nucleic Acids Res. 19, 4018. [PMC free article] [PubMed] [Google Scholar]
- 27.Weber JL, Kwitek AE and May PE (1990) Nucleic Acids Res. 18, 4640. [PMC free article] [PubMed] [Google Scholar]
- 28.Weber JL and May PE (1989) Am. J. Hum. Genet. 44, 388–396. [PMC free article] [PubMed] [Google Scholar]
- 29.Hasegawa T, Hara M, Ando M, Osawa M, Fukuyama Y, Takahashi M and Yamada K (1984) Hum. Genet. 65, 325–330. [DOI] [PubMed] [Google Scholar]
- 30.Fernandez F, Berry C and Mutton D (1987) Archives of Disease in Childhood 62, 841–843. [DOI] [PMC free article] [PubMed] [Google Scholar]
- 31.Hulten M (1991) Lancet 338, 638–639. [DOI] [PubMed] [Google Scholar]
- 32.Engel E (1980) Am. J. Med. Genet. 6, 137–143. [DOI] [PubMed] [Google Scholar]
- 33.Spence JE, Perciaccante RG, Greig GM, Willard HF, Ledbetter DH, Hejtmancik JF, Pollack MS, O’Brien WE and Beaudet AL (1988) Am. J. Hum. Genet. 42, 217–226. [PMC free article] [PubMed] [Google Scholar]
- 34.Saadallah N and Hulten M (1983) J. Med. Genet. 20, 290–299. [DOI] [PMC free article] [PubMed] [Google Scholar]
- 35.Huang TH-M, Cottingham RW Jr, , Ledbetter DH and Zoghbi HY (1992) Genomics 13, 375 –380. [DOI] [PubMed] [Google Scholar]
- 36.Purvis-Smith SG, Saville T, Manass S, Yip M-Y, Lam-Po-Tang PRL, Duffy B, Johnston H, Leigh D and McDonald B (1992) Am. J. Hum. Genet. 50, 1348–1350. [PMC free article] [PubMed] [Google Scholar]
- 37.Cassidy SB, Lai L-W, Erickson RP, Magnuson L, Thomas E, Gendron R and Herrmann J (1992) Am. J. Hum. Genet, in press. [PMC free article] [PubMed] [Google Scholar]
- 38.Voss R, Ben-Simon E, Avital A, Godfrey S, Zlotogora J, Dagan J, Tikochinski Y and Hillel J (1989) Am. J. Hum. Genet. 45, 373–380. [PMC free article] [PubMed] [Google Scholar]
- 39.Petersen MB, Bartsch 0, Adelsberger PA, Mikkelsen M, Schwinger E and Antonarakis S (1992) Genomics 13, 269–274. [DOI] [PubMed] [Google Scholar]
- 40.Lasko D and Cavenee W (1991) Annu. Rev. Genet. 25, 281–314. [DOI] [PubMed] [Google Scholar]
- 41.Feener CA, Boyce FM and Kunkel LM (1991) Am. J. Hum. Genet. 48, 621–627. [PMC free article] [PubMed] [Google Scholar]
- 42.Nelson DL, Ballabio A, Victoria MF, Pieretti M, Bies RD, Gibbs RA, Maley JA, Chinault AC, Webster TD and Caskey CT (1991) Proc. Natl. Acad. Sci. USA 88, 6157–6161. [DOI] [PMC free article] [PubMed] [Google Scholar]
- 43.Breukel C, Wijnen J, Tops C, Klift H.v/d., Dauwerse H and Meera Khan P (1990) Nucleic Acids Res. 18, 3097. [DOI] [PMC free article] [PubMed] [Google Scholar]
- 44.Ledbetter SA, Heras JG and Ledbetter DH (1990b) Genomics 8, 614–622. [DOI] [PubMed] [Google Scholar]
- 45.Sambrook J, Fritsch EF. and Maniatis T (1989) Molecular Cloning —A Laboratory Manual. Cold Spring Harbor Laboratory Press, Cold Spring Harbor, NY. [Google Scholar]
- 46.Chakravarti A Slaugenhaupt SA (1987) Genomics 1, 35–42. [DOI] [PubMed] [Google Scholar]
- 47.Lange K, Weeks D and Boehnke M (1988) Genetic Epidemiology 5, 471–472. [DOI] [PubMed] [Google Scholar]