Abstract
Accumulating evidence has indicated that immune regulatory cells are involved in the establishment of tumoral immune evasion. However, the role of regulatory B cells (Bregs) in this remains unclear. Here, we identified a role for Bregs in immune evasion in gastric cancer (GC) patients. The frequency of peripheral Bregs was significantly higher in GC patients than in healthy controls (P = 0.0023). Moreover, the frequency of CD19+CD24hiCD27+ B cells in GC tissue was significantly higher than in peripheral blood and healthy gastric tissue. Carboxyfluorescein succinimidyl ester labeling revealed that CD19+CD24hiCD27+ B cells could suppress the proliferation of autologous CD4+ T cells. Moreover, CD19+CD24hiCD27+ B cells inhibited the production of interferon-gamma by CD4+ T cells. Double staining immunohistochemistry of interleukin-10 and CD19 revealed 5-year overall survival rates of 65.4% and 13.3% in BregLow and BregHigh groups, respectively (P < 0.0001). Multivariate analysis indicated that the frequency of Bregs was an independent prognostic indicator in GC patients. Taken together, our results show the existence of Bregs in GC tissue, and indicate that they are significantly correlated with the prognosis of GC patients.
Subject terms: Gastric cancer, Tumour immunology
Introduction
Gastric cancer (GC) is one of the most common malignancies and ranks second among all cancer-related deaths worldwide1. Recently, it was shown that the antibody to programmed cell death protein 1, known as the immune checkpoint inhibitor, is effective in the treatment of unresectable advanced and recurrent GC2. This clearly indicates that effective immunity to GC cells can be induced in GC patients, which improves their prognosis.
The expression of tumor rejection antigens such as MAGE 1–3 and the presence of tumor-specific cytotoxic T cells have been reported in GC patients3,4, but the spontaneous rejection of established GC is rarely seen. Furthermore, the efficacy of immune checkpoint inhibitors is still limited2, possibly because of tumoral immune evasion. Some mechanisms responsible for tumoral immune evasion in GC patients include the production of immune suppressive cytokines, such as interleukin (IL)-10 and transforming growth factor-beta 1, by tumor cells and other cells exist at the tumor microenviroment5,6, and the impaired function of immune cells including CD8+ T cells and natural killer cells7. The presence of immune regulatory cells is also important in tumoral immune evasion. One of the most characterized immune regulatory cells are regulatory T cells (Treg), whose levels are increased in both peripheral blood and tumor tissue of GC patients where they are associated with tumoral immune evasion8.
B lymphocytes play a central role in humoral immunity through the production of immunoglobulin. Recently, a subset of B cells, regulatory B cells (Bregs), was demonstrated to exert immunoregulatory functions through production of the immunosuppressive cytokine IL-109. Although most Breg studies have focused on autoimmune mouse models and patients with autoimmune diseases, several mouse cancer studies have also revealed the existence of protumorigenic Bregs10–12. At present, however, the subset composition and function of Bregs in human cancer including GC are largely unclear. Therefore, we undertook the present study to evaluate Bregs in GC to assess possible mechanisms for immune evasion by Bregs.
Results
Bregs in peripheral blood
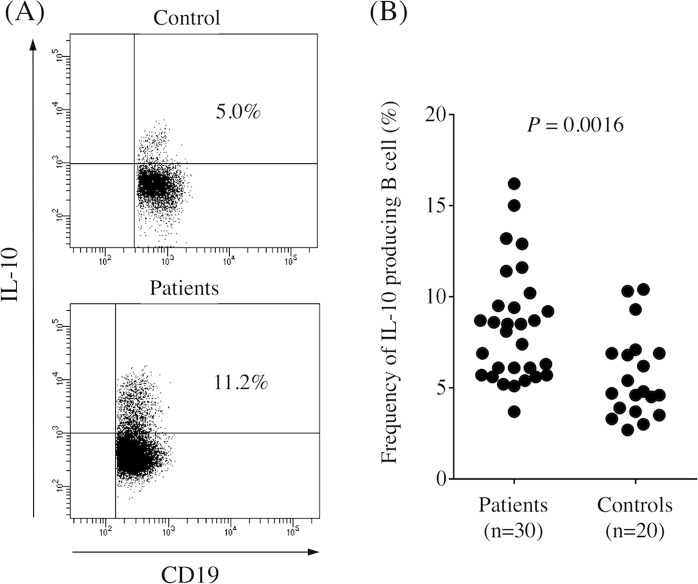
Bregs exert important immunoregulatory functions through production of the immunosuppressive cytokine IL-10, so we first determined the frequency of IL-10-producing B cells (Bregs) in the peripheral blood obtained from controls and GC patients. The frequency of Bregs was significantly higher in GC patients than in controls (Fig. 1, P = 0.0016). Table 1 shows that there was no significant correlation between the frequency of Bregs and clinicopathologic characteristics. We found that the frequency of Bregs significantly decreased 1 month after surgery compared with prior to the operation (Fig. 2, P < 0.0001).
Figure 1.
(A) Representative image of regulatory B cells in control and gastric cancer patients. (B) Percentage of CD19+IL-10+cells among CD19+ B cells in peripheral blood obtained from gastric cancer patients and healthy controls. The frequency of Bregs was significantly higher in gastric cancer patients than in healthy controls (P = 0.0016).
Table 1.
Frequency of peripheral Bregs and clinicopathological variables in gastric cancer patients.
| Variable | Bregs (%) | P value |
|---|---|---|
| Age | 0.175 | |
| <75 (n = 21) | 8.77 ± 0.71 | |
| ≥75 (n = 9) | 7.04 ± 0.93 | |
| Sex | 0.973 | |
| Male (n = 21) | 8.27 ± 0.67 | |
| Female (n = 9) | 8.22 ± 1.19 | |
| Histologya | 0.484 | |
| Differentiated (n = 15) | 7.84 ± 0.64 | |
| Undifferentiated (n = 15) | 8.67 ± 0.97 | |
| Depth of invasionb | 0.121 | |
| T1 (n = 17) | 9.04 ± 0.82 | |
| T2/3/4 (n = 13) | 7.22 ± 0.74 | |
| Lymph node metastasis | 0.995 | |
| Absent (n = 18) | 8.25 ± 0.69 | |
| Present (n = 12) | 8.26 ± 1.05 | |
| Lymphatic invasion | 0.554 | |
| Absent (n = 12) | 7.83 ± 0.77 | |
| Present (n = 18) | 8.54 ± 0.83 | |
| Vascular invasion | 0.473 | |
| Absent (n = 16) | 8.65 ± 0.78 | |
| Present (n = 14) | 7.80 ± 0.88 | |
| Stage | 0.498 | |
| I (n = 19) | 8.56 ± 0.76 | |
| II/III/IV (n = 11) | 7.73 ± 0.89 |
aDifferentiated, papillary, or tubular adenocarcinoma; undifferentiated, poorly differentiated, or mucinous adenocarcinoma, or signet-ring cell carcinoma.
bDepth of invasion: T1, tumor invasion of the lamina propria or submucosa; T2, tumor invasion of the muscularis propria; T3, tumor invasion of the subserosa; T4, tumor penetration of the serosa or tumor invasion of adjacent organs.
All results are expressed as the mean ± SD.
Figure 2.
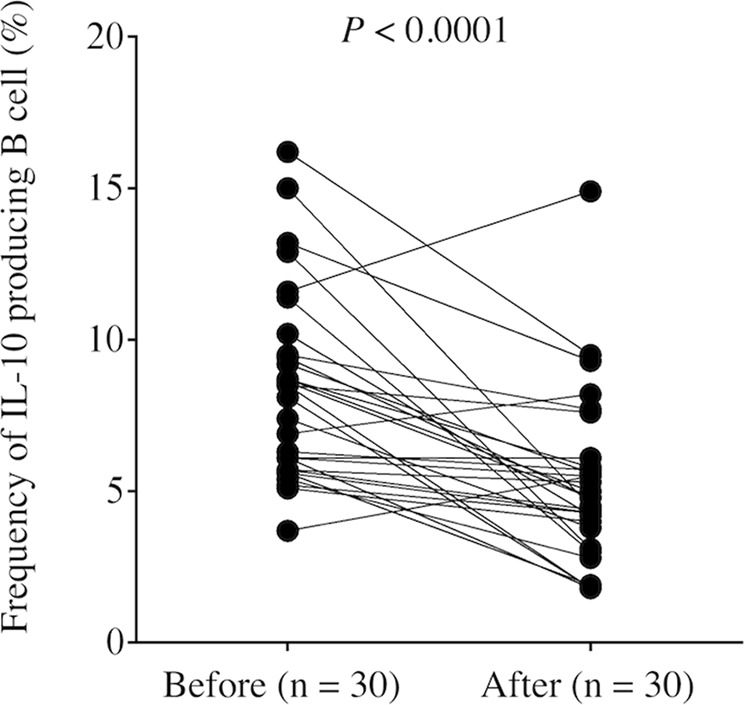
The frequency of Bregs in peripheral blood was significantly decreased 1 month after surgery compared with before the operation (P < 0.0001).
Surface markers of Bregs
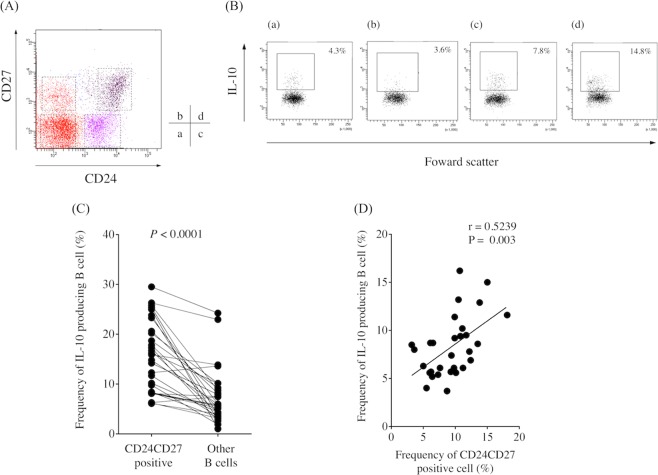
We examined the expression of surface markers, including CD25, CD39, CD73, CD80, and CD86, in IL-10-producing B cells and non-IL-10-producing B cells and found no difference between them (Supplementary Fig. 1). Previous studies demonstrated that human Bregs were contained in the CD19+CD24hiCD27+ B cell subset13. In this study, flow cytometry analysis revealed that the CD19+CD24hiCD27+ B cell subset existed in PBMCs obtained from GC patients (Fig. 3A). Moreover, the frequency of IL-10-producing B cells was significantly higher in the CD19+CD24+CD27+ B cell subset than in other subsets (Fig. 3B,C). IL-10-producing B cells were also significantly higher in number in the CD19+CD24+CD27+ B cell subset than in the CD19+CD24+CD27− B cell subset (Supplementary Fig. 2). Furthermore, we detected a significant positive correlation between the frequency of IL-10-producing B cells and the frequency of CD19+CD24+CD27+ B cells, indicating that Bregs were enriched in the CD19+CD24+CD27+ B cell subset in GC patients (Fig. 3D).
Figure 3.
(A) Representative image of the frequency of regulatory B cells according to CD24 and CD27 expression in gastric cancer patients. (B) The frequency of IL-10-producing B cells in (a) CD19+CD24-CD27- B cells, (b) CD19+CD24-CD27+ B cells, (c) CD19+CD24+CD27− B cells, and (d) CD19+CD24hiCD27+ B cells. (C) The frequency of IL-10-producing B cells was significantly higher in the CD19+CD24hiCD27+ B cell subset than in other subsets (P < 0.0001). (D) A significant positive correlation was detected between the frequency of IL-10-producing B cells and the frequency of CD19+CD24hiCD27+ B cells (r = 0.5309, P = 0.0021).
Bregs in GC tissue
We previously demonstrated that immune suppression was stronger in the tumor site than in the peripheral blood of GC patients7,14,15. Therefore, to determine if the same phenomenon occurs regarding Bregs, we obtained PBMCs, normal gastric mucosa, and GC tissue from the same patients and determined the frequency of CD19+CD24hiCD27+ B cells in peripheral blood, normal gastric tissue, and GC tissue. The frequency of CD19+CD24hiCD27+ B cells was significantly higher in GC tissue than in peripheral blood and healthy gastric tissue (Fig. 4), indicating that CD19+CD24hiCD27+ B cells containing Bregs are abundant in GC tissue.
Figure 4.
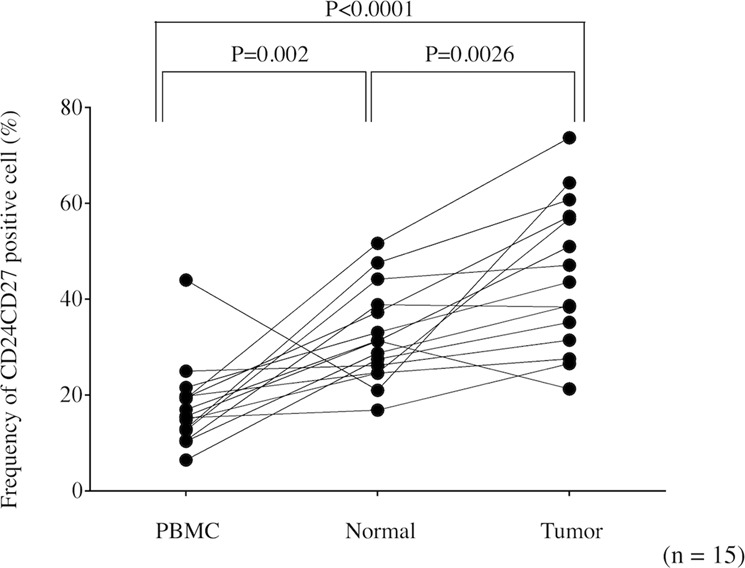
The frequency of the CD19+CD24hiCD27+ B cell subset among CD19+ B cells in peripheral blood, healthy gastric tissue, and cancer tissue. The frequency of CD19+CD24hiCD27+ B cells among CD19+ B cells was significantly higher in gastric cancer tissue than in peripheral blood and healthy gastric tissue.
The CD19+CD24hiCD27+ B cell population exerts immunoregulatory functions
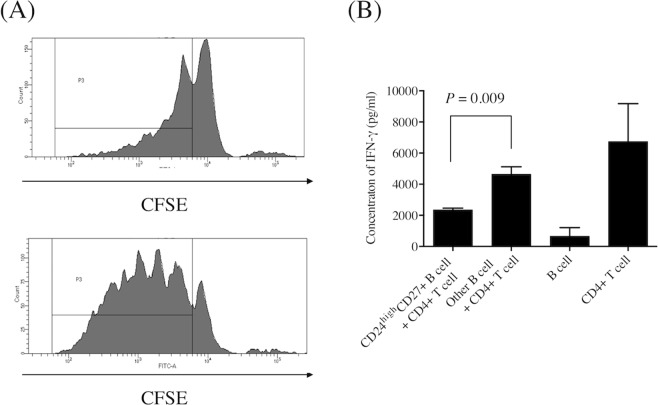
The CFSE experiment revealed that CD19+CD24hiCD27+ B cells were able to suppress the proliferation of autologous CD4+ T cells (Fig. 5A). Moreover, ELISA demonstrated that CD19+CD24hiCD27+ B cells inhibited the production of IFN-gamma by autologous CD4+ T cells (Fig. 5B). We also confirmed that CD19+CD24hiCD27+ B cells inhibited IFN-gamma production by autologous CD4+ T cells using flow cytometry (Supplementary Fig. 3). However, apoptosis assay revealed that CD19+CD24hiCD27+ B cells have no effect on apoptosis of CD4+ T cells (Supplementary Fig. 4). These results clearly demonstrated that the CD19+CD24hiCD27+ B cell population contains cells that exert important immunoregulatory functions.
Figure 5.
(A) Carboxyfluorescein succinimidyl ester cell division assay. The proliferation of CD4+ T cells co-cultured with CD19+CD24hiCD27+ B cells (upper panel) was lower than that of CD4+ T cells co-cultured with other B cells (lower panel). Image is representative of three experiments. The gate P3 indicates proliferated CD4+ T cells. (B) Enzyme-linked immunosorbent assay showing that IFN-gamma production by CD4+ T cells co-cultured with CD19+CD24hiCD27+ B cells was significantly lower than that of CD4+ T cells co-cultured with other B cells (n = 3).
Bregs worsen the prognosis of GC cancer patients
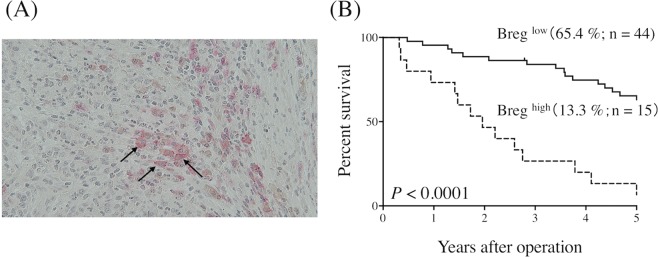
Finally, we determined the correlation between the frequency of Bregs and prognosis in GC patients. To this end, we performed double staining immunohistochemistry of IL-10 and CD19 (Fig. 6A). The frequency of Bregs, represented by the ratio of the number of cells positive for both CD19 and IL-10 to the number of cells positive for CD19, was 13.9 ± 7.8%. There was no significant correlation between the frequency of Bregs and clinicopathologic characteristics (Table 2). ROC analysis indicated an optimal cutoff value of 19.35% for the highest Youden index. Based on this, patients were divided into BregLow (<19.35%) and BregHigh (≥19.35%) groups. Five-year OS rates were significantly different between the two groups, at 65.4% and 13.3%, respectively (P < 0.0001, Fig. 6B). Univariate analysis indicated that tumor size, lymph node metastasis, lymphatic invasion, and the frequency of Bregs were significantly associated with OS (Table 3). Finally, multivariate analysis indicated that the frequency of Bregs was an independent prognostic indicator of GC patient survival, along with lymph node metastasis (Table 3).
Figure 6.
(A) Representative image of regulatory B cells (arrows) in gastric cancer tissue following double staining immunohistochemistry (pink, CD19; brown, IL-10; magnification 400×). (B) The prognosis of patients with a marked infiltration of regulatory B cells was significantly worse than that of those with a slight infiltration of regulatory B cells (P < 0.0001).
Table 2.
Frequency of tumor-infiltrating Bregs and clinicopathological variables in gastric cancer patients.
| Variable | Bregs (%) | P value |
|---|---|---|
| Age | 0.09 | |
| <75 (n = 40) | 12.8 ± 7.73 | |
| ≥75 (n = 19) | 16.4 ± 7.49 | |
| Sex | 0.11 | |
| Male (n = 36) | 15.2 ± 8.15 | |
| Female (n = 23) | 11.9 ± 6.87 | |
| Histologya | 0.876 | |
| Differentiated (n = 21) | 14.2 ± 7.12 | |
| Undifferentiated (n = 38) | 13.8 ± 8.22 | |
| Depth of invasionb | 0.479 | |
| T1/2 (n = 20) | 12.9 ± 7.71 | |
| T3/4 (n = 39) | 14.5 ± 7.88 | |
| Lymph node metastasis | 0.09 | |
| Absent (n = 17) | 11.2 ± 5.88 | |
| Present (n = 42) | 15.0 ± 8.25 | |
| Lymphatic invasion | 0.181 | |
| ly 0/1 (n = 23) | 12.2 ± 6.39 | |
| ly 2/3 (n = 36) | 15.0 ± 8.47 | |
| Vascular invasion | 0.322 | |
| v 0/1 (n = 31) | 14.9 ± 8.26 | |
| v 2/3 (n = 28) | 12.9 ± 7.22 | |
| Stage | 0.125 | |
| I /II (n = 28) | 12.3 ± 7.20 | |
| III/IV (n = 31) | 15.4 ± 8.11 |
See Table 1 for details of histology and depth of invasion.
All results are expressed as the mean ± SD.
Table 3.
Univariate and multivariate analysis of factors prognostic for overall survival in patients with GC.
| Univariate analysis | Multivariate analysis | |||||
|---|---|---|---|---|---|---|
| Hazard ratio | 95% CI | P value | Hazard ratio | 95% CI | P value | |
| Gender (male vs. female) | 0.565 | 0.285–1.12 | 0.1 | |||
| Agea | 1.025 | 0.995–1.06 | 0.1 | |||
| Histology (undifferentiated vs. differentiated) | 1.018 | 0.499–2.06 | 0.96 | |||
| Tumor sizea | 1.122 | 1.04–1.22 | 0.005 | 1.052 | 0.952–1.16 | 0.32 |
| Depth of invasion (T2 – T4) | 1.305 | 0.849–2.01 | 0.23 | |||
| Lymph node metastasis (N0 – N3)b | 1.982 | 1.43–2.75 | 0.0005 | 2.022 | 1.43–2.86 | 0.0006 |
| Lymphatic invasion (Ly0 – Ly3)c | 1.772 | 1.14–2.77 | 0.012 | 1.063 | 0.627–1.80 | 0.82 |
| Venous invasion (V0 – V3)d | 0.973 | 0.639–1.48 | 0.9 | |||
| Regulatory B cell (BregHigh vs. BregLow) | 5.012 | 2.40–10.45 | <0.0001 | 4.985 | 2.36–10.54 | <0.0001 |
aContinuous variables
bN0: no regional lymph node metastases; N1: Metastasis in 1–2 regional lymph nodes; N2: Metastasis in 3–6 regional lymph nodes; N3; Metastasis in ≥7 regional lymph nodes.
cLymphatic invasion: Ly0–Ly3, grade of lymphatic invasion.
dVenous invasion: V0–V3, grade of venous invasion.
See Table 1 for details of histology and depth of invasion.
CI: confidence interval.
Discussion
An increase in immune cells with negative immune regulatory functions, including Tregs, myeloid-derived suppressor cells, and CD4+NKG2D+ T cells, has been demonstrated in cancer patients. Of importance is that these immune regulatory cells impaired host immunity against cancer cells16–20, resulting in tumor progression and poor prognosis. In the current study, we found that IL-10-producing Bregs, another type of immunosuppressive cell, were increased in the peripheral blood of GC patients compared with controls, indicating that Bregs are closely associated with immune evasion in GC.
One of the most important issues of Bregs research is identifying markers. In the case of mice, Evans et al. defined Bregs as CD19+CD21hiCD23hiIgMhiCD24hi 21, while Yanaba et al. demonstrated that they were contained in the CD19+CD5+CD1dhi population22. However, although these populations contained Bregs, the phenotyping strategies did not uniquely identify them. In the case of human Bregs, Blair et al. demonstrated that human CD19+CD24hiCD38hi B cells, which normally defines human transitional B cells, exhibit regulatory capacity through the production of IL-10 in healthy individuals23. Furthermore, Iwata et al. demonstrated that Bregs were predominantly found within the CD19+CD24hiCD27+ B-cell subpopulation13. However, as for mouse Bregs, no phenotype has been identified to uniquely identify human Bregs to date.
In the present study, we confirmed that the CD19+CD24hiCD27+ B cell population contained cells that suppressed the proliferation of CD4+ T cells and inhibited the secretion of IFN-gamma by autologous CD4+ T cells, indicating that the CD19+CD24hiCD27+ B cell population contained Bregs. However, the frequency of Bregs was not high even in the CD19+CD24hiCD27+ B cell subset, and Bregs were also contained in other populations, indicating that this phenotyping strategy could not uniquely identify Bregs. Therefore, other identifying strategies are urgently required to progress Bregs research.
We also found that the frequency of Bregs significantly decreased 1 month after surgery, and that CD19+CD24hiCD27+ B cells containing Bregs were significantly higher in GC tissue than in peripheral blood and healthy gastric tissue. This indicated that some cancer cell factors might affect the number of Bregs. In this regard, Olkhanud et al. demonstrated that the intraperitoneal injection of supernatant obtained from the culture of tumor cells could promote Breg accumulation, indicating that the secretion of soluble factors by tumor cells is responsible for increases in Breg24. Although the detailed mechanisms of Breg increases in GC patients remain unclear, it is likely that they are similar to those observed in the mouse model.
With regard to the correlation between Bregs and cancer progression, increased numbers of Treg cells were shown to be related to poor survival in patients with hepatocellular carcinoma25 and ovarian cancer16. This shows that immune suppression is closely associated with tumor progression. In support of this, we found that increased numbers of Bregs were significantly correlated with poor prognosis in GC patients although there was no significant correlation between the frequency of Bregs and clinicopathologic characteristics in the current study. In this regard, recurrence usually arises from micrometastases that cannot be detected by ordinary diagnostics such as ultrasonography, computed tomography, and positron emission tomography. It is likely that immune suppression by Bregs induces the growth of residual cancer cells, which eventually results in recurrence after operation. To the best of our knowledge, ours is the first demonstration of a significant correlation between Bregs and prognosis in GC.
The close correlation between Bregs and prognosis suggests that Bregs are attractive targets for GC treatment. Olkhanud et al. demonstrated that Bregs, defined as CD19+CD25+B220+ B cells, were closely linked with cancer progression in the mouse mammary adenocarcinoma 4T1 cancer model24. Importantly, injections of an anti-B220 antibody decreased the B220 population in lymph nodes and spleens of this model, resulting in the significant decrease of lung metastases during a mammary carcinoma challenge. This clearly indicated that targeting Bregs was effective for the treatment of cancer. It was also recently demonstrated that Bregs express programmed death-ligand 1, which is closely associated with immunoregulatory function26, and it is likely that they express other molecules with similar functions. Immunotherapy that targets these molecules might therefore provide a breakthrough in the treatment of GC. Further studies are required to determine the potential of targeting Bregs in the treatment of GC.
In conclusion, Bregs exist in GC tissue and were significantly correlated with the prognosis of GC patients. Immunotherapy that targets Bregs could therefore provide a novel form of GC treatment.
Methods
Patients and healthy donors
Thirty patients (21 males and 9 females; mean age, 67.8 ± 13.4 years), treated at Tottori University Hospital (Yonago, Japan) and pathologically diagnosed with gastric adenocarcinoma, were enrolled in this study. None of the patients had received radiotherapy, chemotherapy, or other medical interventions before surgery. The study protocol was approved by the Institutional Review Board at Tottori University Hospital. All procedures followed were in accordance with the ethical standards of the responsible committee on human experimentation (institutional and national) and with the Helsinki Declaration of 1964 and later versions. Informed consent was obtained from all participants for inclusion in the study. Healthy age-matched controls (n = 20; 14 males and 6 females; mean age, 68.8 ± 11.4 years) were also recruited. Immunohistochemical analysis was performed using paraffin-embedded GC samples from 59 patients who underwent gastrectomy at Tottori University Hospital from 2003 to 2011. Clinicopathologic findings were determined according to the Japanese classification of GC27.
Preparation of peripheral blood mononuclear cells (PBMCs)
Heparinized blood was obtained from patients and controls, and PBMCs were isolated by centrifugation using a Ficoll–Paque (Pharmacia, Uppsala, Sweden) gradient.
Isolation of tumor-infiltrating lymphocytes
Fresh tumor tissues and normal gastric mucosa obtained from a site in the resected specimen that was as far away as possible from the tumor were washed with RPMI-1640 medium (Lonza, Basel, Switzerland), cut into small pieces, and digested with 0.1% collagenase IV (Worthington, Lakewood, NJ), 0.002% DNase I (Worthington), and 0.01% hyaluronidase (Worthington) at 37 °C for 45 min. The resulting cell suspensions were filtered through a mesh filter (BD Falcon, Franklin Lakes, NJ, USA).
Flow cytometry analysis and cell sorting
Fluorescence-activated cell sorting analysis was performed using a BD LSRFortessa™ (BD Biosciences, San Jose, CA). The following antibodies were used to classify cells: anti-CD19-fluorescein isothiocyanate (FITC) (Miltenyi Biotec, Friedrich Gladbach, Germany), anti-CD3-allophycocyanin (APC), anti-CD4-APC, anti-CD4-phycoerythrin (PE), anti-CD24-peridinin chlorophyll protein complex-Cy 5.5 (PerCP Cy5.5), anti-CD25-APC, anti-CD27-PE, anti-CD39- brilliant violet 421 (BV421), anti-CD45-V500, anti-CD73-APC, anti-IFN-γ-BV421, and anti-IL-10-BV421 (all from BD PharMingen, Franklin Lakes, NJ), anti-CD80-APC, anti-CD86-APC monoclonal antibody (mAb) (Biolegend, San Diego, CA), Annexin V- FITC (BD PharMingen), and DAPI (Cell Biolabs, San Diego, CA). The CD19+CD24hiCD27+ B cell subset was sorted using a Moflo XDP cell sorter (Beckman Coulter, Brea, CA) with 90% to 95% purities.
Media
Culture medium consisting of RPMI 1640, 1% L-glutamine, 1% penicillin/streptomycin, and 10% heat-inactivated fetal calf serum (FCS) (all from Lonza) was used.
Intracellular cytokine staining of IL-10
PBMCs were resuspended (2 × 10⁶ cells/mL) in medium and cultured in the presence of CpG (ODN M362, 10 μg/mL; Enzo Life Sciences, Farmingdale, NY) and CD40L (1 μg/mL; Miltenyi Biotec) for 24 h in 48-well flat-bottom plates. Nineteen h after stimulation, phorbol 12-myristate 13-acetate (PMA; 50 ng/mL; Wako, Osaka, Japan), ionomycin (1 μg/mL; Wako), and Golgiplug (Becton Dickinson, Franklin Lakes, NJ) were added to the culture. Twenty-four h after stimulation, cells were harvested and stained with anti-CD19-FITC, anti-CD24-PerCP Cy5.5, and anti-CD27-PE mAbs, then fixed and permeabilized with BD Cytofix/Cytoperm solution (BD Biosciences), and stained with anti-IL-10 mAb.
Carboxyfluorescein succinimidyl ester (CFSE) labeling and proliferation assay
Cell proliferation was determined using CFSE dilution assays. CD4+ T cells were positively selected with anti-CD4 microbeads. For staining with CFSE (Invitrogen, Carlsbad, CA), CD4+ T cells at 1 × 10⁶ cells/ml in phosphate-buffered saline (PBS) were incubated with 5 μM CFSE for 10 min at 37 °C. Staining was terminated by adding RPMI 1640 containing 10% FCS at 4 °C, followed by one wash with PBS. CFSE-labeled CD4+ T cells were then seeded in 96-well plates (3.5 × 10⁵ cells/well; Nunc A/S, Roskilde, Denmark), and either CD19+CD24hiCD27+ B cells or other B cells were added at a ratio of 1:1. CpG (ODN M362, 10 μg/mL; Enzo Life Sciences), CD40L (1 μg/mL; Miltenyi Biotec), phorbol 12-myristate 13-acetate (50 ng/mL; Wako), and ionomycin (1 μg/mL; Wako) were also added to each plate. CD4+ T cells were profiled by CFSE labeling after 5 days of incubation. Unstained cells were included in all experiments and were used to set the compensations on the flow cytometer.
Measurement of interferon (IFN)-γ
CD4+ T cells were seeded in 96-well plates (3.5 × 10⁵ cells/well; Nunc A/S). Either CD19+CD24hiCD27+ B cells or other B cells were added at a ratio of 1:1, and CpG and CD40Lwere added to each plate to stimulate B cells. The supernatant and cells of each well were used for enzyme-linked immunosorbent assay (ELISA) and intracellular cytokine staining of IFN-γ, respectively. For ELISA, PMA and ionomycin were added to the culture 19 h after the stimulation of CpG and CD40L. The supernatant was collected 24 h after stimulation, and IFN-γ concentrations for duplicate samples were quantified using IFN-γ Quantikine ELISA kits (R&D systems, Minneapolis, MN) following the manufacturer’s protocols. For intracellular cytokine staining of IFN-γ, PMA, ionomycin, and Golgiplug were added to the culture 19 h after the stimulation of CpG and CD40L. Twenty-four h after stimulation, cells were harvested and stained with anti-CD4-APC mAbs, then fixed and permeabilized with BD Cytofix/Cytoperm solution, and stained with anti-IFN-γ mAb.
Apoptosis assay
CD4+ T cells and either CD19+CD24hiCD27+ B cells or other B cells were cultured in the same conditions as mentioned above. Then, the cells were collected, stained with anti-CD3-APC and anti-CD4-PE mAbs, Annexin V-FITC, and DAPI, and analyzed by flow cytometry.
Immunohistochemical analysis
Tissue samples were fixed in formalin and embedded in paraffin. Serial sections were cut at 4 µm, dewaxed, deparaffinized in xylene, and rehydrated through a graded alcohol series. For retrieval of CD19 and IL-10, the sections were boiled for 20 min in a microwave oven in 10 mM Tris-1 ethylenediaminetetraacetic acid buffer (pH 9.0). The samples were incubated in 3% hydrogen peroxidase for 30 min to block endogenous peroxidases and in Block Ace (DS Pharma Biomedical, Osaka, Japan) for 30 min to prevent nonspecific antigen binding. The slides were subsequently incubated with primary antibodies (mouse anti-CD19 [Clone LE-CD19; DAKO, Santa Clara, CA; 1:200 dilution] and rabbit anti-IL-10 [Clone D13A11; Cell Signaling Technology, Danvers, MA; 1:50 dilution]) overnight at 4 °C. They were then incubated with alkaline phosphatase (AP)-conjugated goat anti-mouse polymer and horseradish peroxidase (HRP)-conjugated anti-rabbit polymer secondary antibodies (MACH 2 double stain®; Biocare Medical, Pacheco, CA, USA) for 30 min. Staining was visualized with HRP substrate (ImmPACT DAB®; Vector Laboratories, Burlingame, CA), which was visible as a brown color, and AP substrate (ImmPACT Vector Red®; Vector Laboratories), which was visible as a red color, and counterstained with Mayer’s hematoxylin. The presence of cells positive for CD19 and IL-10 on each slide was determined in a blinded manner. Five high-power fields were randomly selected, and the number of cells positive for both CD19 and IL-10 and those positive for CD19 in these fields was counted.
Statistical analysis
Differences in clinicopathologic characteristics and frequency of Bregs between groups were evaluated using either paired t-tests or the Mann–Whitney U test. The Youden index was calculated using receiver operating characteristic (ROC) analysis to determine optimal cutoffs for Breg in the survival analysis. Overall survival (OS) was calculated according to the Kaplan–Meier method and compared using the log-rank test. Cox proportional hazards models were used for both univariate and multivariate analyses, and multivariate analysis used the factors with P < 0.1 in the univariate analysis. A P value < 0.05 was considered to indicate statistical significance. GraphPad Prism (GraphPad Software, Inc., La Jolla, CA) and Stat View (Abacus Concepts, Inc., Berkeley, CA) software were used for statistical analyses.
Supplementary information
Acknowledgements
We thank Sarah Williams, PhD, from Edanz Group (www.edanzediting.com) for editing a draft of this manuscript. This work was supported by JSPS KAKENHI Grant Number JP16K10498.
Author Contributions
Y.M. participated in the design of the study, experiments, analysis and interpretation of data, and drafting the article. H.S. participated in the design of the study, interpretation of data, revising the article, and final approval of the version. S.S., Y.K., Y.S., K.M., T.M., Y.F., K.A., Y.M., T.S. and Y.N. participated in experiments. Y.F. participated in revising the article.
Competing Interests
The authors declare no competing interests.
Footnotes
Publisher’s note: Springer Nature remains neutral with regard to jurisdictional claims in published maps and institutional affiliations.
Supplementary information
Supplementary information accompanies this paper at 10.1038/s41598-019-49581-4.
References
- 1.Jemal A, et al. Global cancer statistics. CA: a cancer journal for clinicians. 2011;61:69–90. doi: 10.3322/caac.20107. [DOI] [PubMed] [Google Scholar]
- 2.Kang YK, et al. Nivolumab in patients with advanced gastric or gastro-oesophageal junction cancer refractory to, or intolerant of, at least two previous chemotherapy regimens (ONO-4538-12, ATTRACTION-2): a randomised, double-blind, placebo-controlled, phase 3 trial. Lancet (London, England) 2017;390:2461–2471. doi: 10.1016/s0140-6736(17)31827-5. [DOI] [PubMed] [Google Scholar]
- 3.Inoue H, et al. The expression of tumor-rejection antigen “MAGE” genes in human gastric carcinoma. Gastroenterology. 1995;109:1522–1525. doi: 10.1016/0016-5085(95)90639-8. [DOI] [PubMed] [Google Scholar]
- 4.Hoshino T, et al. HLA class-I-restricted and tumor-specific CTL in tumor-infiltrating lymphocytes of patients with gastric cancer. International journal of cancer. 1997;70:631–638. doi: 10.1002/(SICI)1097-0215(19970317)70:6<631::AID-IJC1>3.0.CO;2-W. [DOI] [PubMed] [Google Scholar]
- 5.Sakamoto T, et al. Interleukin-10 expression significantly correlates with minor CD8+ T-cell infiltration and high microvessel density in patients with gastric cancer. International journal of cancer. 2006;118:1909–1914. doi: 10.1002/ijc.21598. [DOI] [PubMed] [Google Scholar]
- 6.Saito H, et al. The expression of transforming growth factor-beta1 is significantly correlated with the expression of vascular endothelial growth factor and poor prognosis of patients with advanced gastric carcinoma. Cancer. 1999;86:1455–1462. doi: 10.1002/(SICI)1097-0142(19991015)86:8<1455::AID-CNCR11>3.0.CO;2-L. [DOI] [PubMed] [Google Scholar]
- 7.Saito H, Takaya S, Osaki T, Ikeguchi M. Increased apoptosis and elevated Fas expression in circulating natural killer cells in gastric cancer patients. Gastric cancer: official journal of the International Gastric Cancer Association and the Japanese Gastric Cancer Association. 2013;16:473–479. doi: 10.1007/s10120-012-0210-1. [DOI] [PubMed] [Google Scholar]
- 8.Ichihara F, et al. Increased populations of regulatory T cells in peripheral blood and tumor-infiltrating lymphocytes in patients with gastric and esophageal cancers. Clinical cancer research: an official journal of the American Association for Cancer Research. 2003;9:4404–4408. [PubMed] [Google Scholar]
- 9.Mauri C, Bosma A. Immune regulatory function of B cells. Annual review of immunology. 2012;30:221–241. doi: 10.1146/annurev-immunol-020711-074934. [DOI] [PubMed] [Google Scholar]
- 10.Shah S, et al. Increased rejection of primary tumors in mice lacking B cells: inhibition of anti-tumor CTL and TH1 cytokine responses by B cells. International journal of cancer. 2005;117:574–586. doi: 10.1002/ijc.21177. [DOI] [PubMed] [Google Scholar]
- 11.Zhang Y, et al. B lymphocyte inhibition of anti-tumor response depends on expansion of Treg but is independent of B-cell IL-10 secretion. Cancer immunology, immunotherapy: CII. 2013;62:87–99. doi: 10.1007/s00262-012-1313-6. [DOI] [PMC free article] [PubMed] [Google Scholar]
- 12.Pylayeva-Gupta Y, et al. IL35-Producing B Cells Promote the Development of Pancreatic Neoplasia. Cancer discovery. 2016;6:247–255. doi: 10.1158/2159-8290.cd-15-0843. [DOI] [PMC free article] [PubMed] [Google Scholar]
- 13.Iwata Y, et al. Characterization of a rare IL-10-competent B-cell subset in humans that parallels mouse regulatory B10 cells. Blood. 2011;117:530–541. doi: 10.1182/blood-2010-07-294249. [DOI] [PMC free article] [PubMed] [Google Scholar]
- 14.Osaki T, et al. Decreased NKG2D expression on CD8+ T cell is involved in immune evasion in patients with gastric cancer. Clinical cancer research: an official journal of the American Association for Cancer Research. 2007;13:382–387. doi: 10.1158/1078-0432.ccr-06-1454. [DOI] [PubMed] [Google Scholar]
- 15.Saito H, Kuroda H, Matsunaga T, Osaki T, Ikeguchi M. Increased PD-1 expression on CD4+ and CD8+ T cells is involved in immune evasion in gastric cancer. Journal of surgical oncology. 2013;107:517–522. doi: 10.1002/jso.23281. [DOI] [PubMed] [Google Scholar]
- 16.Curiel TJ, et al. Specific recruitment of regulatory T cells in ovarian carcinoma fosters immune privilege and predicts reduced survival. Nature medicine. 2004;10:942–949. doi: 10.1038/nm1093. [DOI] [PubMed] [Google Scholar]
- 17.Woo Edward Y., Yeh Heidi, Chu Christina S., Schlienger Katia, Carroll Richard G., Riley James L., Kaiser Larry R., June Carl H. Cutting Edge: Regulatory T Cells from Lung Cancer Patients Directly Inhibit Autologous T Cell Proliferation. The Journal of Immunology. 2002;168(9):4272–4276. doi: 10.4049/jimmunol.168.9.4272. [DOI] [PubMed] [Google Scholar]
- 18.Ochoa AC, Zea AH, Hernandez C, Rodriguez PC. Arginase, prostaglandins, and myeloid-derived suppressor cells in renal cell carcinoma. Clinical cancer research: an official journal of the American Association for Cancer Research. 2007;13:721s–726s. doi: 10.1158/1078-0432.ccr-06-2197. [DOI] [PubMed] [Google Scholar]
- 19.Hoechst B, et al. A new population of myeloid-derived suppressor cells in hepatocellular carcinoma patients induces CD4(+)CD25(+)Foxp3(+) T cells. Gastroenterology. 2008;135:234–243. doi: 10.1053/j.gastro.2008.03.020. [DOI] [PubMed] [Google Scholar]
- 20.Groh V, Smythe K, Dai Z, Spies T. Fas-ligand-mediated paracrine T cell regulation by the receptor NKG2D in tumor immunity. Nature immunology. 2006;7:755–762. doi: 10.1038/ni1350. [DOI] [PubMed] [Google Scholar]
- 21.Evans Jamie G., Chavez-Rueda Karina A., Eddaoudi Ayad, Meyer-Bahlburg Almut, Rawlings David J., Ehrenstein Michael R., Mauri Claudia. Novel Suppressive Function of Transitional 2 B Cells in Experimental Arthritis. The Journal of Immunology. 2007;178(12):7868–7878. doi: 10.4049/jimmunol.178.12.7868. [DOI] [PubMed] [Google Scholar]
- 22.Yanaba K, et al. A regulatory B cell subset with a unique CD1dhiCD5+ phenotype controls T cell-dependent inflammatory responses. Immunity. 2008;28:639–650. doi: 10.1016/j.immuni.2008.03.017. [DOI] [PubMed] [Google Scholar]
- 23.Blair PA, et al. CD19(+)CD24(hi)CD38(hi) B cells exhibit regulatory capacity in healthy individuals but are functionally impaired in systemic Lupus Erythematosus patients. Immunity. 2010;32:129–140. doi: 10.1016/j.immuni.2009.11.009. [DOI] [PubMed] [Google Scholar]
- 24.Olkhanud PB, et al. Tumor-evoked regulatory B cells promote breast cancer metastasis by converting resting CD4(+) T cells to T-regulatory cells. Cancer research. 2011;71:3505–3515. doi: 10.1158/0008-5472.can-10-4316. [DOI] [PMC free article] [PubMed] [Google Scholar]
- 25.Fu J, et al. Increased regulatory T cells correlate with CD8 T-cell impairment and poor survival in hepatocellular carcinoma patients. Gastroenterology. 2007;132:2328–2339. doi: 10.1053/j.gastro.2007.03.102. [DOI] [PubMed] [Google Scholar]
- 26.Shalapour S, et al. Inflammation-induced IgA+ cells dismantle anti-liver cancer immunity. Nature. 2017;551:340–345. doi: 10.1038/nature24302. [DOI] [PMC free article] [PubMed] [Google Scholar]
- 27.Japanese Gastric Cancer Association Japanese classification of gastric carcinoma: 3rd English edition. Gastric cancer: official journal of the International Gastric Cancer Association and the Japanese Gastric Cancer Association. 2011;14:101–112. doi: 10.1007/s10120-011-0041-5. [DOI] [PubMed] [Google Scholar]
Associated Data
This section collects any data citations, data availability statements, or supplementary materials included in this article.


