Abstract
Background
Glycemic variability (GV) induces coronary microcirculatory disturbance and myocardial damage in diabetic patients with acute myocardial infarction. However, in nondiabetic acute myocardial infarction patients, the relationship between GV and myocardial damage remains unclear.
Patients and methods
We investigated GV with a continuous glucose monitoring system in nondiabetic ST-segment elevation myocardial infarction patients treated with emergent percutaneous coronary intervention. GV was expressed as the mean amplitude of glycemic excursions (MAGE). Myocardial damage was estimated by myocardial blush grade and ST-segment resolution (STRes). STRes was defined as complete (>70%), partial (30–70%), or none (<30%).
Results
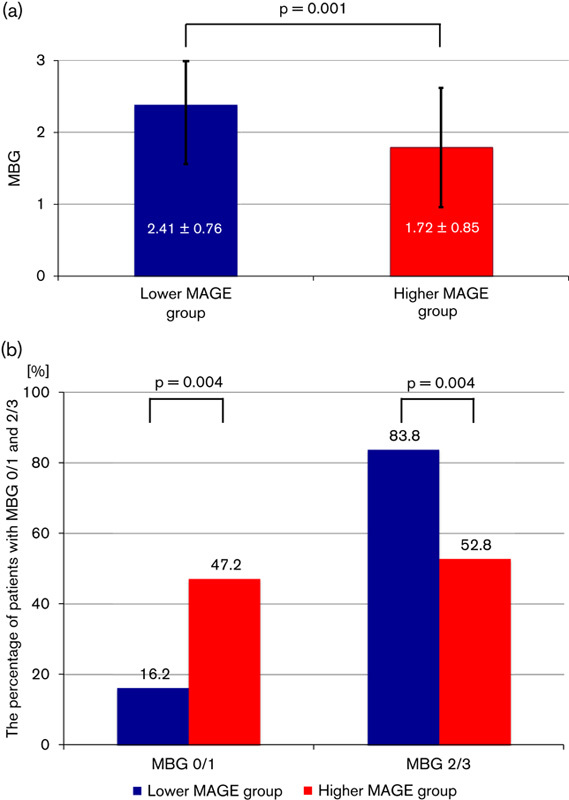
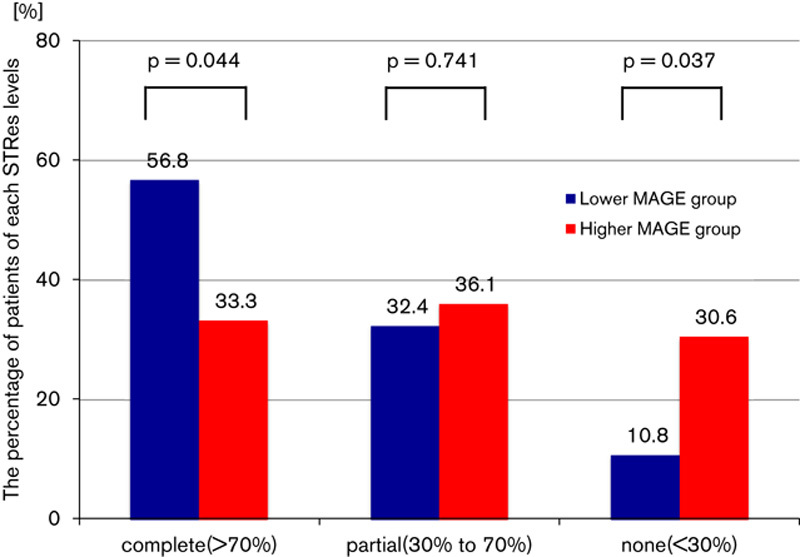
Consecutive patients (n=73) were enrolled and classified into a lower or higher MAGE group on the basis of the median MAGE. The higher MAGE group showed lower levels of myocardial blush grade (2.41±0.76 vs. 1.72±0.85, P=0.001) and STRes (complete: 56.8 vs. 33.3%, P=0.044; partial: 32.4 vs. 36.1%, P=0.741; none: 10.8 vs. 30.6%, P=0.037).
Conclusion
GV was associated with myocardial damage after percutaneous coronary intervention in nondiabetic ST-segment elevation myocardial infarction patients.
Keywords: acute myocardial infarction, glycemic variability, myocardial damage
Introduction
Hyperglycemia is associated not only with the incidence of acute myocardial infarction (AMI), but also with coronary microcirculatory disturbance and myocardial damage after percutaneous coronary intervention (PCI), which leads to a poor prognosis in patients with diabetes mellitus (DM) 1. Some studies have shown that increased glycemic variability (GV) seems to have more deleterious effects than chronic hyperglycemia in the development of vascular endothelial dysfunction, as acute glucose swings increase oxidative stress 2,3. Recently, high GV has been attracting much attention for the prevention of myocardial damage and improving prognosis.
There are several reports on GV and myocardial damage in AMI patients including both diabetic patients and nondiabetic patients 4,5. In fact, about 30% of AMI patients were diagnosed with DM, and about half of the others with no history of DM showed impaired glucose tolerance (IGT) 6. IGT is common in AMI patients and results in worse outcomes than normal glucose tolerance 7–9. However, the relationship between GV and myocardial damage, excluding diabetic AMI patients, has not been studied and remains unclear. It is clinically important to clarify whether GV is associated with the amount of myocardial damage after successful PCI, even in nondiabetic patients.
A continuous glucose monitoring system (CGMS) allows the measurement of glucose levels in real time throughout the day and night. It also allows the evaluation of GV by calculation of the mean amplitude of glycemic excursions (MAGE) 10. This is the first study to investigate the relationship between GV analyzed by a CGMS and myocardial damage that focused only on nondiabetic AMI patients.
Patients and methods
Patients
This study was a cross-sectional study of patients with nondiabetic, ST-segment elevation myocardial infarction (STEMI), who were treated with emergent PCI for the first time at Yamanashi Prefectural Central Hospital (Japan). Consecutive STEMI patients who underwent emergent successful PCI were screened for eligibility, only if both their symptom-onset-to-hospitalization time and door-to-balloon time were within 120 min. We divided the patients into a lower MAGE group and a higher MAGE group on the basis of the median MAGE determined by the CGMS, and then compared myocardial damage between the two groups. Myocardial blush grade (MBG) and ST-segment resolution (STRes), after PCI, were used to estimate myocardial damage.
Exclusion criteria were as follows: in-hospital death, history of AMI or PCI, no stenting or failed PCI, DM, medication for postprandial hyperglycemia, less than 20 or over 80 years old, cardiogenic shock (Killip class IV), respiratory failure, malignant tumor, malnutrition, active inflammatory disease, pregnancy, interruption or failure of the CGMS, and refusal to give informed consent.
On admission, plasma glucose (PG) was measured, and dual antiplatelet therapy [acetylsalicylic acid 100 mg/day (initial dose: 300 mg) and clopidogrel 75 mg/day (initial dose: 300 mg) or prasugrel 3.75 mg/day (initial dose: 20 mg)] and a strong statin were prescribed to all patients. The serum creatine phosphokinase-MB (CPK-MB) was routinely measured, every 6 h from immediately after emergent PCI, until peak levels were observed.
The study protocol was approved by the ethics committee of Yamanashi Prefectural Central Hospital (ID: 26–12), and all patients gave written informed consent before emergent PCI.
ECG analysis
STEMI was defined as chest pain lasting for at least 30 min accompanied by new ST-segment elevation and a rise in CPK-MB (above twice the upper limit of normal) and cardiac-specific troponin T (>99th percentile of a normal reference population). The ECG criteria to define ST-segment elevation were as follows: new ST-segment elevation more than 0.1 mV at 20 ms after the J point in at least two limb leads, or more than 0.2 mV in two contiguous precordial leads 11. Patients with left bundle-branch block or a paced rhythm were excluded.
The sum of ST-segment elevation was measured in leads I, aVL and V1–V6 for anterior AMI, and leads II, III, aVF, V5 and V6 for nonanterior AMI. The percent resolution of the sum of ST-segment elevation from baseline to 60 min after PCI was calculated, and STRes was classified as complete, partial, or none on the basis of Schroder’s method 12,13. Complete STRes was defined as at least 70% resolution of the initial sum of ST-segment elevation, partial STRes was defined as 30–70% resolution and none was defined as less than 30% resolution.
Oral glucose tolerance test
All patients underwent a standard 75-g oral glucose tolerance test the next morning while wearing the CGMS. After an overnight fast, venous blood samples were taken for measurement of fasting PG, fasting immunoreactive insulin (IRI) and PG at 60 and 120 min after the glucose load (60 and 120 min PG). Glycated hemoglobin, creatinine, estimated glomerular filtration rate, triglycerides, high-density lipoprotein cholesterol, low-density lipoprotein cholesterol, the ratio of eicosapentaenoic acid to total arachidonic acid, and high-sensitivity C-reactive protein were measured simultaneously. Oxidized low-density lipoprotein cholesterol (ox-LDLc) was also measured as an oxidative stress marker from blood collected at this time. On the basis of the results of the 75-g oral glucose tolerance test, the patients were classified as DM, IGT, impaired fasting glucose, or normal glucose tolerance according to the criteria of the American Diabetes Association 14. Patients with DM were excluded. The homeostasis model assessment of insulin resistance (HOMA-IR) and β-cell function (HOMA-β) score were calculated using the following formulas: HOMA-IR=(fasting PG×fasting IRI)/405; HOMA-β=(fasting IRI×360)/(fasting PG−63).
Continuous glucose monitoring protocol
All patients underwent continuous glucose monitoring (CGM) for 48 h during the subacute period (7–10 days after emergent PCI and admission) using a CGMS (iPro2; Medtronic, Minneapolis, Minnesota, USA). The CGMS sensor was inserted under the skin to measure glucose levels in tissue fluid. We calibrated the CGMS with finger sticks four times per day (Onetouch Ultravue; Johnson & Johnson, New Brunswick, New Jersey, USA) to ensure optimal accuracy of the glucose sensor. Energy-controlled meals were served (25–28 kcal/kg of ideal body weight). The recorded 48-h CGM data were independently analyzed by two cardiologists who were blinded to the MBG and STRes data of each patient (Fig. 1). The SD, mean, minimum, and maximum PG during CGM were recorded. Time in hypoglycemia was defined as the time when PG levels were less than 70 mg/dl. The MAGE was calculated as the average value of the blood glucose fluctuation range that exceeded 1 SD of the mean glucose 15.
Fig. 1.

Glycemic variability measured using a continuous glucose monitoring system. The continuous glucose monitoring system can visualize glycemic variability. The mean amplitude of glycemic excursions was calculated by measuring the arithmetic mean of the difference between consecutive peaks and nadirs when that difference was more than 1 SD of the mean glucose (arrows).
Quantitative coronary angiography and myocardial blush grade
QCA of the target plaque was analyzed using the Allura Xper FD 10/10, interventional tools Rel.8 (Philips, Amsterdam, The Netherlands). An intravascular ultrasound (IVUS) catheter (Opticross, iLab system; Boston Scientific, Natick, Massachusetts, USA) was also used for all target lesion analysis.
MBG was defined according to the Zwolle criteria 16. Blush grade was divided into grades 0–3, with grade 0 indicative of no blush and grade 3 indicative of normal blush. Grade 1 blush was defined as minimal blush, and grade 2 as moderate blush, comparable with that obtained during angiography of a contralateral or ipsilateral non-infarct-related coronary artery. Epicardial coronary flow was graded according to the TIMI classification 17,18. Successful PCI was defined as TIMI 2 or 3. The final TIMI flow grade and MBG were systematically analyzed by two different cardiologists on the basis of the final angiographic images obtained at the completion of emergent PCI. The synergy between PCI with Taxus and cardiac surgery (SYNTAX) score was also calculated by them 19.
Statistical analysis
A Student’s t-test was used to compare differences between two groups for variables with a normal distribution, and a Mann–Whitney U-test was used for variables with a skewed distribution (high-sensitivity C-reactive protein). Categorical variables were compared by a χ2-test. Continuous variables were described as the mean±SD. All statistical tests were two tailed, and P value less than 0.05 was considered significant. IBM SPSS, version 21.0 (SPSS Inc., Chicago, Illinois, USA) was used for all statistical analyses.
Results
Baseline characteristics
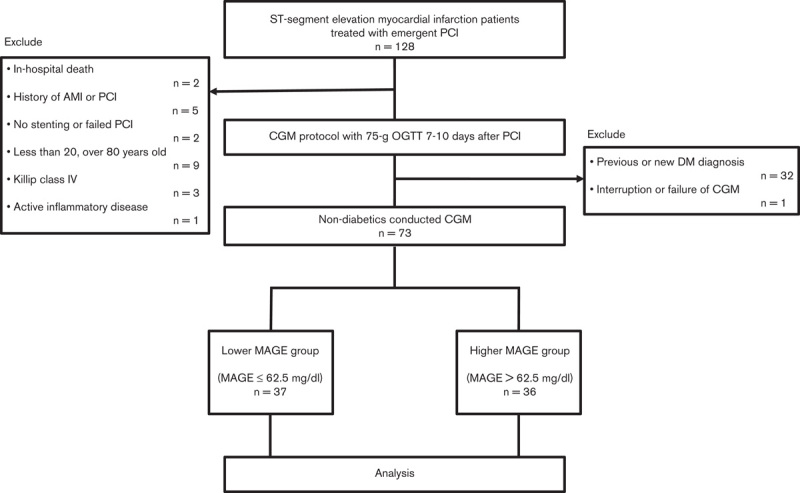
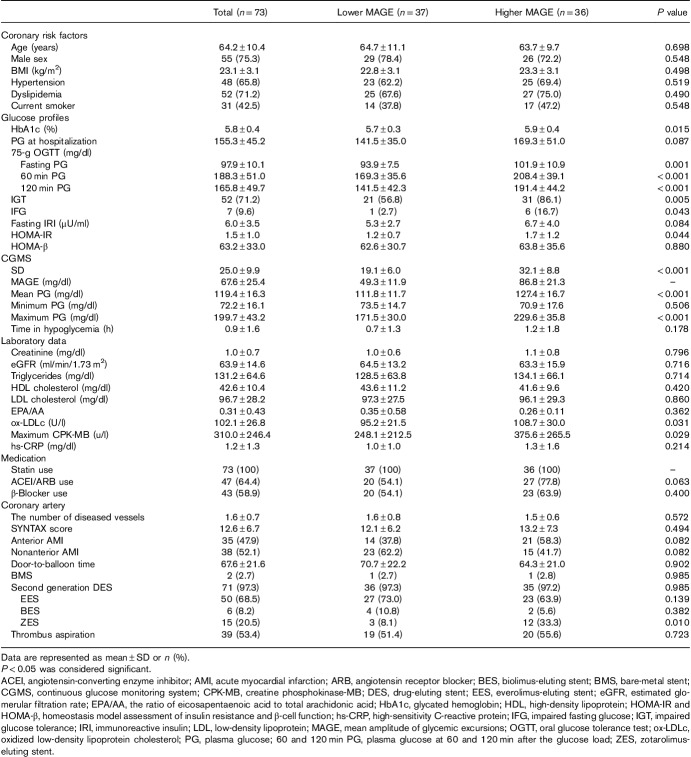
A total of 128 STEMI patients were treated with emergent PCI between 1 July 2013, and 1 July 2015, and were enrolled in this study. After screening for eligibility, 73 nondiabetic patients who had CGM were analyzed. Mean symptom-onset-to-hospitalization time was 68.5±30.4 min, and mean door-to-balloon time was 67.6±21.6 min. According to the median MAGE (62.5 mg/dl), patients were divided into two groups: a lower MAGE group (n=37, MAGE≤62.5 mg/dl) and a higher MAGE group (n=36, MAGE>62.5 mg/dl) (Fig. 2). The baseline patient characteristics of the two groups are summarized in Table 1. The higher MAGE group showed greater levels of glycated hemoglobin, fasting PG, 60 and 120 min PG, HOMA-IR, maximum CPK-MB and ox-LDLc. The mean and maximum PG during CGM were also elevated in the higher MAGE group. There were no significant differences in minimum PG during CGM and time in hypoglycemia. The percentages of both IGT and impaired fasting glucose were greater in the higher MAGE group. Almost all patients had second generation drug-eluting stents implanted; bare-metal stents were implanted in only two patients. Everolimus-eluting stents and biolimus-eluting stents were used equally between the two groups. The use of zotarolimus-eluting stents was greater in the higher MAGE group. There were no significant differences in age, male sex, BMI, hypertension, dyslipidemia, current smoker, culprit lesion, the number of diseased vessels, SYNTAX score, or medication use between the two groups (Table 1).
Fig. 2.

Study population. Consecutive patients (n=128) who had ST-segment elevation myocardial infarction treated with emergent percutaneous coronary intervention (PCI) were enrolled. Seventy-three eligible patients underwent continuous glucose monitoring (CGM) and were classified into a lower mean amplitude of glycemic excursions (MAGE) group or a higher MAGE group on the basis of the median MAGE (62.5 mg/dl). AMI, acute myocardial infarction; DM, diabetes mellitus; OGTT, oral glucose tolerance test.
Table 1.
Baseline characteristics
Myocardial blush grade and ST-segment resolution
The higher MAGE group showed significantly lower levels of MBG (2.41±0.76 vs. 1.72±0.85, P=0.001) (Fig. 3a). There were more patients who showed MBG 2 or 3 (the better myocardial blush) in the lower MAGE group (83.8 vs. 52.8%, P=0.004). In contrast, there were more patients who showed MBG 0 or 1 (the worse myocardial blush) in the higher MAGE group (16.2 vs. 47.2%, P=0.004) (Fig. 3b). The results of the STRes analysis are shown in Fig. 4. Although there was no significant difference in the incidence of partial resolution between the two groups (32.4 vs. 36.1%, P=0.741), there were significant differences in the percentage of patients classified as complete and none. A lower incidence of complete STRes was found in the higher MAGE group (56.8 vs. 33.3%, P=0.044), and this group also showed a greater incidence of no resolution (10.8 vs. 30.6%, P=0.037) (Fig. 4). MAGE was associated with microcirculatory disturbance and myocardial damage after PCI in nondiabetic STEMI patients.
Fig. 3.

Results of myocardial blush grade (MBG). (a) The mean±SD of MBGs are shown. (b) The percentage of patients with MBG 2 or 3 (the better myocardial blush) and MBG 0 or 1 (the worse myocardial blush) are shown. The higher mean amplitude of glycemic excursions (MAGE) group showed significantly lower levels of MBG.
Fig. 4.

Results of ST-segment resolution (STRes). Complete STRes was defined as at least 70% resolution of the initial sum of ST-segment elevation, partial STRes was defined as 30–70% resolution and none was defined as less than 30% resolution. There were significant differences in the complete and none categories of STRes. The higher mean amplitude of glycemic excursions (MAGE) group showed lower levels of STRes.
Discussion
Myocardial damage
The present study showed that GV during the subacute phase after PCI was associated with coronary microcirculatory disturbance and the amount of myocardial damage in nondiabetic STEMI patients. In this study, myocardial damage after PCI was estimated with MBG and STRes, which are noninvasive, inexpensive and reliable indicators that have been clinically validated. Reflecting myocardial damage, maximum CPK-MB value was also significantly higher in the higher MAGE group. Tsuchida et al. 4 also evaluated myocardial damage in 63 STEMI patients (including 33 nondiabetic patients) with STRes and reported that MAGE was significantly higher in the group with STRes less than 30%. However, we did not address the potential mechanisms of the relationship between GV and myocardial damage in nondiabetic AMI patients.
Several mechanisms for the effect of GV on myocardial damage were considered. First, acute hyperglycemia abolishes the effect of ischemic preconditioning, which is an independent predictor of myocardial damage 20. This is thought to be caused by attenuation of mitochondrial ATP-regulated potassium channel activation 21.
A second hypothesis for the effect of GV on myocardial damage is that there was distal embolization caused by PCI, which caused microcirculatory disturbance in the higher MAGE group. Exposure to daily higher GV can impair vascular plaque stability. Gohbara et al. 22 examined the relationship between GV measured by CGM during the stable phase after AMI and plaque vulnerability measured by optical coherence tomography in nonculprit vessels. In their subgroup analysis of nondiabetic patients (n=35), thin-cap fibroatheroma was identified in 26% of the patients, and MAGE was a significant predictor of thin-cap fibroatheroma. Thus, because of the relationship between GV and plaque vulnerability, patients with higher GV may develop microcirculatory disturbance because of more distal embolization after reperfusion therapy.
A third hypothesis is that increased GV may enhance myocardial damage caused by reperfusion injury. Acute hyperglycemia has been shown to be associated with the no-reflow phenomena (reperfusion injury) after PCI in patients with STEMI 23. Of course, reperfusion therapy by itself rapidly causes endothelial dysfunction and microcirculatory disturbance 24. In diabetic patients, GV induces the generation of oxygen-free radicals and activation of protein kinase C 25, and these are two of the causes of reperfusion injury. Teraguchi et al. 5 reported a negative relationship between GV during the acute phase of AMI and the myocardial salvage area after PCI in both nondiabetic patients (n=24) and diabetic patients (n=14). Furthermore, GV was significantly associated with an oxidative stress marker 5. Monnier et al. 3 and Abeer et al. 26 also reported that GV correlated with an oxidative stress marker in patients with DM. In the present study, ox-LDLc, an oxidative stress marker was significantly greater in the higher MAGE group. Thus, oxidative stress activated by acute hyperglycemia may induce endothelial dysfunction and impair myocardial salvage even in nondiabetic patients.
Study limitations
First, this study was a small, cross-sectional study conducted at a single center. Therefore, there were the possibilities of several biases and misidentification of causality. This study clarified the relationship between GV and myocardial damage in nondiabetic STEMI patients. We believe that high GV causes deleterious effects on myocardial damage after PCI. Nevertheless, the possibility that a large amount of myocardial damage and neurohormonal stress of AMI increases GV even in the subacute phase might be considered. Second, we excluded some patients, as mentioned earlier, and it remains uncertain whether the present results can be applied to these patients. Third, the types of implanted stents were not consistent. Detailed follow-up analysis of the culprit lesion that required stenting with IVUS or optical coherence tomography was not performed in all cases. Thus, it is unknown whether the difference in stent type affected the results. In addition, IVUS assessment of plaque vulnerability was excluded from analysis because the conditions were not uniform across patients. Fourth, although MAGE was calculated from CGMS data during the subacute phase of AMI after PCI, a residual inflammatory response may have affected GV. In addition, a patient’s diet in the hospital could differ from their ordinary diet, which could have also influenced GV. We used a 48-h period to determine MAGE after the condition of all patients had stabilized. Given that patients had energy-controlled meals during hospitalization, the present results might have underestimated the association between MAGE and myocardial damage. Under those conditions, however, a significant association was noted between MAGE and myocardial damage in the present study.
Conclusion
GV was related to microcirculatory disturbance and myocardial damage after PCI in nondiabetic STEMI patients.
Abolishment of ischemic preconditioning, plaque vulnerability, and oxidative stress because of high GV may cause deleterious effects on myocardial damage. Even in nondiabetic AMI patients, high GV may be an important target for prevention of myocardial damage.
Alternatively, a large amount of myocardial damage may be expressed as high GV. MAGE is useful for the estimation of myocardial damage after PCI in AMI patients.
Acknowledgements
Conflicts of interest
There are no conflicts of interest.
Footnotes
The preliminary analysis of this study has been reported in ESC Congress; 29 August 2016; Rome, Italy.
References
- 1.Ishihara M, Kagawa E, Inoue I, Kawagoe T, Shimatani Y, Kurisu S, et al. Impact of admission hyperglycemia and diabetes mellitus on short- and long-term mortality after acute myocardial infarction in the coronary intervention era. Am J Cardiol 2007; 99:1674–1679. [DOI] [PubMed] [Google Scholar]
- 2.Ceriello A, Esposito K, Piconi L, Ihnat MA, Thorpe JE, Testa R, et al. Oscillating glucose is more deleterious to endothelial function and oxidative stress than mean glucose in normal and type 2 diabetic patients. Diabetes 2008; 57:1349–1354. [DOI] [PubMed] [Google Scholar]
- 3.Monnier L, Mas E, Ginet C, Michel F, Villon L, Cristol JP, Colette C. Activation of oxidative stress by acute glucose fluctuations compared with sustained chronic hyperglycemia in patients with type 2 diabetes. JAMA 2006; 295:1681–1687. [DOI] [PubMed] [Google Scholar]
- 4.Tsuchida K, Nakamura N, Soda S, Sakai R, Nishida K, Hiroki J, et al. Relationship between glucose fluctuations and ST-segment resolution in patients with ST-elevation acute myocardial infarction. Int Heart J 2017; 58:328–334. [DOI] [PubMed] [Google Scholar]
- 5.Teraguchi I, Imanishi T, Ozaki Y, Tanimoto T, Ueyama M, Orii M, et al. Acute-phase glucose fluctuation is negatively correlated with myocardial salvage after acute myocardial infarction. Circ J 2014; 78:170–179. [DOI] [PubMed] [Google Scholar]
- 6.Ishihara M, Inoue I, Kawagoe T, Shimatani Y, Kurisu S, Hata T, et al. Is admission hyperglycaemia in non-diabetic patients with acute myocardial infarction a surrogate for previously undiagnosed abnormal glucose tolerance? Eur Heart J 2006; 27:2413–2419. [DOI] [PubMed] [Google Scholar]
- 7.Tominaga M, Eguchi H, Manaka H, Igarashi K, Kato T, Sekikawa A. Impaired glucose tolerance is a risk factor for cardiovascular disease, but not impaired fasting glucose. The Funagata Diabetes Study. Diabetes Care 1999; 22:920–924. [DOI] [PubMed] [Google Scholar]
- 8.[No authors listed]. Glucose tolerance and mortality: comparison of WHO and American Diabetes Association diagnostic criteria. The DECODE Study Group. European Diabetes Epidemiology Group. Diabetes Epidemiology: collaborative analysis of diagnostic criteria in Europe. Lancet 1999; 354:617–621. [PubMed] [Google Scholar]
- 9.Hanefeld M, Fischer S, Julius U, Schulze J, Schwanebeck U, Schmechel H, et al. Risk factors for myocardial infarction and death in newly detected NIDDM: the Diabetes Intervention Study, 11-year follow-up. Diabetologia 1996; 39:1577–1583. [DOI] [PubMed] [Google Scholar]
- 10.D’Archangelo MJ. New guideline supports the development and evaluation of continuous interstitial glucose monitoring devices. J Diabetes Sci Technol 2008; 2:332–334. [DOI] [PMC free article] [PubMed] [Google Scholar]
- 11.Fu Y, Goodman S, Chang WC, van de Werf F, Granger CB, Armstrong PW. Time to treatment influences the impact of ST-segment resolution on one-year prognosis: insights from the assessment of the safety and efficacy of a new thrombolytic (ASSENT-2) trial. Circulation 2001; 104:2653–2659. [DOI] [PubMed] [Google Scholar]
- 12.Schroder R, Dissmann R, Bruggemann T, Wegscheider K, Linderer T, Tebbe U, Neuhaus KL. Extent of early ST segment elevation resolution: a simple but strong predictor of outcome in patients with acute myocardial infarction. J Am Coll Cardiol 1994; 24:384–391. [DOI] [PubMed] [Google Scholar]
- 13.Schroder R, Wegscheider K, Schroder K, Dissmann R, Meyer-Sabellek W. Extent of early ST segment elevation resolution: a strong predictor of outcome in patients with acute myocardial infarction and a sensitive measure to compare thrombolytic regimens. A substudy of the International Joint Efficacy Comparison of Thrombolytics (INJECT) trial. J Am Coll Cardiol 1995; 26:1657–1664. [DOI] [PubMed] [Google Scholar]
- 14.American Diabetes Association. Diagnosis and classification of diabetes mellitus. Diabetes Care 2013; 36 (Suppl 1):S67–S74. [DOI] [PMC free article] [PubMed] [Google Scholar]
- 15.Service FJ, Molnar GD, Rosevear JW, Ackerman E, Gatewood LC, Taylor WF. Mean amplitude of glycemic excursions, a measure of diabetic instability. Diabetes 1970; 19:644–655. [DOI] [PubMed] [Google Scholar]
- 16.Van’t Hof AW, Liem A, Suryapranata H, Hoorntje JC, de Boer MJ, Zijlstra F. Angiographic assessment of myocardial reperfusion in patients treated with primary angioplasty for acute myocardial infarction: myocardial blush grade. Zwolle Myocardial Infarction Study Group. Circulation 1998; 97:2302–2306. [DOI] [PubMed] [Google Scholar]
- 17.The TIMI Study Group. Comparison of invasive and conservative strategies after treatment with intravenous tissue plasminogen activator in acute myocardial infarction. Results of the thrombolysis in myocardial infarction (TIMI) phase II trial. N Engl J Med 1989; 320:618–627. [DOI] [PubMed] [Google Scholar]
- 18.The TIMI Study Group. The thrombolysis in myocardial infarction (TIMI) trial. Phase I findings. N Engl J Med 1985; 312:932–936. [DOI] [PubMed] [Google Scholar]
- 19.Kappetein AP, Dawkins KD, Mohr FW, Morice MC, Mack MJ, Russell ME, et al. Current percutaneous coronary intervention and coronary artery bypass grafting practices for three-vessel and left main coronary artery disease. Insights from the SYNTAX run-in phase. Eur J Cardiothorac Surg 2006; 29:486–491. [DOI] [PubMed] [Google Scholar]
- 20.Kersten JR, Schmeling TJ, Orth KG, Pagel PS, Warltier DC. Acute hyperglycemia abolishes ischemic preconditioning in vivo. Am J Physiol Heart Circ Physiol 1998; 275:H721–H725. [DOI] [PubMed] [Google Scholar]
- 21.Kersten JR, Montgomery MW, Ghassemi T, Gross ER, Toller WG, Pagel PS, Warltier DC. Diabetes and hyperglycemia impair activation of mitochondrial K(ATP) channels. Am J Physiol Heart Circ Physiol 2001; 280:H1744–H1750. [DOI] [PubMed] [Google Scholar]
- 22.Gohbara M, Hibi K, Mitsuhashi T, Maejima N, Iwahashi N, Kataoka S, et al. Glycemic variability on continuous glucose monitoring system correlates with non-culprit vessel coronary plaque vulnerability in patients with first-episode acute coronary syndrome – optical coherence tomography study. Circ J 2016; 80:202–210. [DOI] [PubMed] [Google Scholar]
- 23.Iwakura K, Ito H, Ikushima M, Kawano S, Okamura A, Asano K, et al. Association between hyperglycemia and the no-reflow phenomenon in patients with acute myocardial infarction. J Am Coll Cardiol 2003; 41:1–7. [DOI] [PubMed] [Google Scholar]
- 24.Ito H. No-reflow phenomenon and prognosis in patients with acute myocardial infarction. Nat Clin Pract Cardiovasc Med 2006; 3:499–506. [DOI] [PubMed] [Google Scholar]
- 25.Di Carli MF, Janisse J, Grunberger G, Ager J. Role of chronic hyperglycemia in the pathogenesis of coronary microvascular dysfunction in diabetes. J Am Coll Cardiol 2003; 41:1387–1393. [DOI] [PubMed] [Google Scholar]
- 26.Abeer AAL, Alsalamony AM, Fatani SH, Kamel HFM. Effect of variable antidiabetic treatments strategy on oxidative stress markers in obese patients with T2DM. Diabetol Metab Syndr 2017; 9:27. [DOI] [PMC free article] [PubMed] [Google Scholar]


