. 2019 Aug 27;8:e47498. doi: 10.7554/eLife.47498

Figure 1. Progression of Alzheimer’s disease at molecular level in the triple transgenic mouse model (PSEN1M146V/APPSwe/MAPTP301L).

(A) Disease progression in 3×Tg-AD mice and corresponding time points (2, 6, 12, 18 months) of sample collection. Four biological replicates per group were collected at each time point. (B) Experimental workflow and sample processing. Half of the collected brain sample was used for preparation of the cryosections for immunohistochemistry. Soluble proteins of the other half were extracted for proteomics analysis. (C) Number of identified, quantified and statistically significant proteins in the dataset. (D) Principal component analysis of soluble brain proteome of 3×Tg-AD and control mice based on their protein expression profile. Principal component one segregates mice by age and accounts for 40.3% of variability in the dataset, while principal component two clusters mice according to their disease status (18.9% of variance). (E) Proteins driving the differences in proteomes between aged, young, diseased and control mice depicted in brown, pink, navy and light blue colors, respectively.

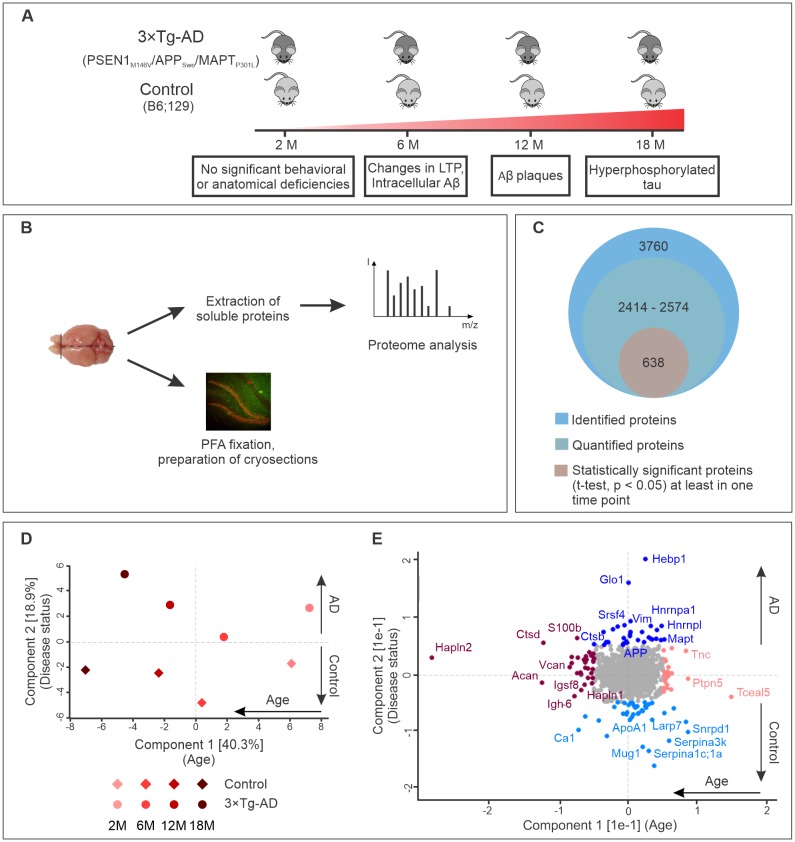
Figure 1.

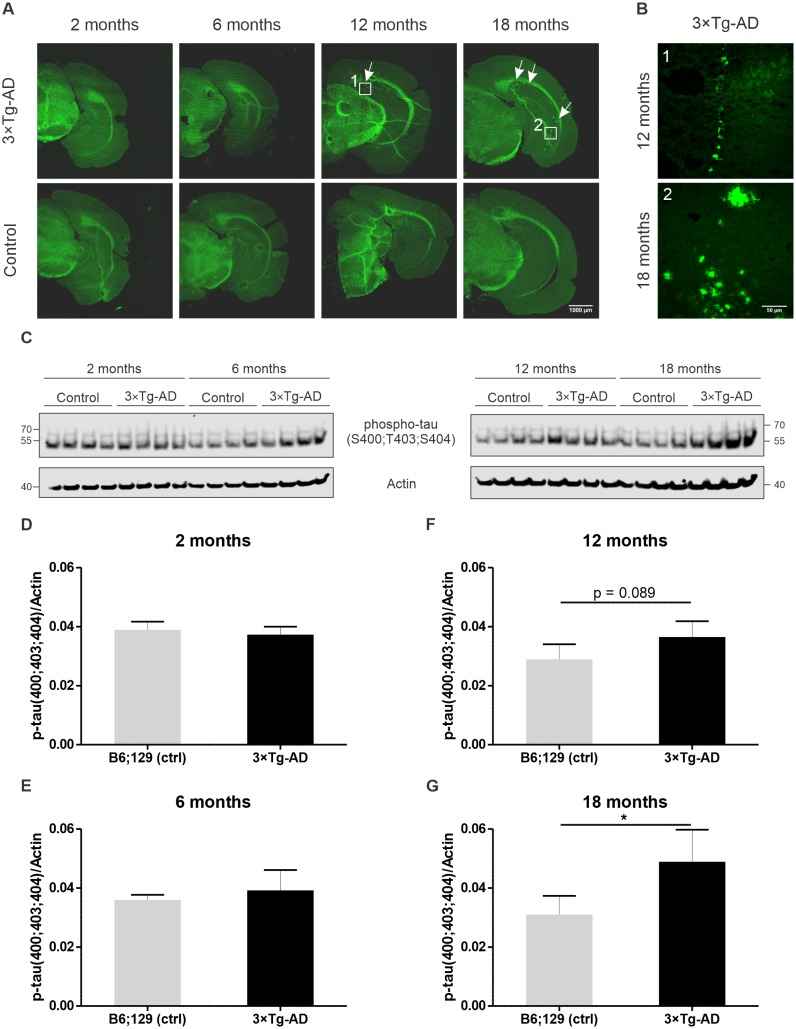
Figure 1—figure supplement 1. Assessment of pathology in 3×Tg-AD mice used in this study.

Figure 1—figure supplement 1.

(A) Thioflavin S staining of brain sections from 3×Tg-AD and control mice was performed for each analyzed time point to monitor the aggregation of fibrillar material with β-pleated sheet conformation. Accumulation of Aβ plaques assayed by thioflavin S staining at each analyzed time point in 3×Tg-AD and control mice. Representative images of coronal sections including the hippocampal formation with the subiculum were acquired. White arrows indicate exemplary Aβ plaques. (B) High magnification images of Aβ plaques in 12 and 18-month-old 3×Tg-AD mice. (C) Assessment of tau phosphorylation at sites S400/T403/S404 by immunoblotting. Soluble fractions of brain proteins obtained from one of the sagittal halves of harvested mouse whole brains (four animals per background and timepoint) were used for the analysis. (D–G) Relative quantification of tau phosphorylation. Slight upregulation of phospho-tau can be observed at the time point 12 months in 3×Tg-AD mice. Significantly different levels of tau phosphorylation were detected at the late stage of the disorder (18 months). All bar charts represent mean ± SD. Statistical significance in the datasets was assessed by Student’s t-test: *p value < 0.05.
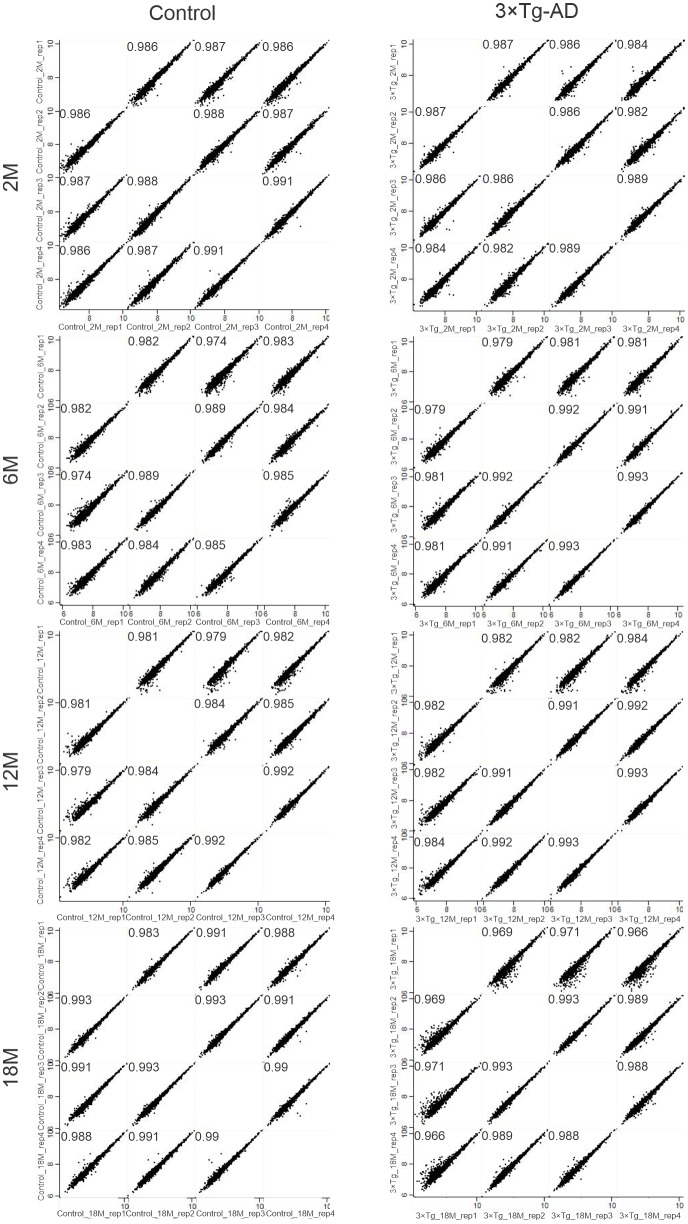
Figure 1—figure supplement 2. Technical reproducibility between biological replicates.

Figure 1—figure supplement 2.

Pearson correlation between biological quadruplicates for each condition and time point.