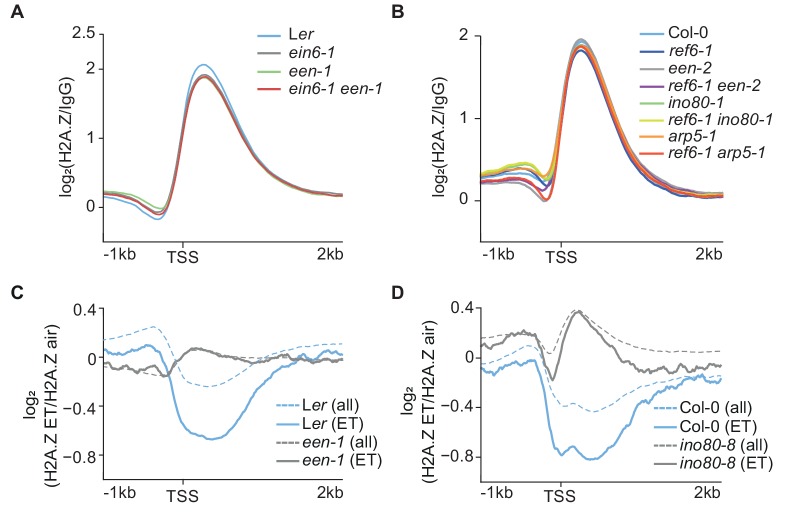
Figure 4. INO80 controls ethylene-induced H2A.Z eviction dynamics.
(A) (B) Aggregated H2A.Z profile of all Arabidopsis genes (TAIR10) in Ler, ein6-1, een-1, ein6-1 een-1 (A) and Col-0, ref6-1, een-2, ref6-1 een-2, ino80-1, ref6-1 ino80-1, arp5-1 and ref6-1 arp5-1 (B) seedlings from 1 kb upstream to 2 kb downstream of the TSS determined by ChIP-seq. (C) (D) ET-induced H2A.Z eviction dynamics are shown as aggregated H2A.Z profiles of 3-day-old etiolated Ler, een-1, Col-0 and ino80-8 seedlings treated for 4 hr with ET gas. Two biological H2A.Z ChIP-seq replicates for Ler and een-1 (C) and one for Col-0 and ino80-8 (D) were analyzed. Profiles visualize the log2 fold change between the respective air and ET-treated H2A.Z ChIP-seq samples from 1 kb upstream to 2 kb downstream of the TSS. 1076 genes that show a robust H2A.Z eviction in response to ET in all replicates (≥1.3 fold SICER comparison, air vs 4 hr ET) are shown as solid lines whereas all genes (TAIR10) are shown as dashed lines.


