

Abstract
The Cdc42 guanosine triphosphatase (GTPase) plays a central role in polarity development in species ranging from yeast to humans. In budding yeast, a specific growth site is selected in the G1 phase. Rsr1, a Ras GTPase, interacts with Cdc42 and its associated proteins to promote polarized growth at the proper bud site. Yet how Rsr1 regulates cell polarization is not fully understood. Here, we show that Rsr1-GDP interacts with the scaffold protein Bem1 in early G1, likely hindering the role of Bem1 in Cdc42 polarization and polarized secretion. Consistent with these in vivo observations, mathematical modeling predicts that Bem1 is unable to promote Cdc42 polarization in early G1 in the presence of Rsr1-GDP. We find that a part of the Bem1 Phox homology domain, which overlaps with a region interacting with the exocyst component Exo70, is necessary for the association of Bem1 with Rsr1-GDP. Overexpression of the GDP-locked Rsr1 interferes with Bem1-dependent Exo70 polarization. We thus propose that Rsr1 functions in spatial and temporal regulation of polarity establishment by associating with distinct polarity factors in its GTP- and GDP-bound states.
INTRODUCTION
The establishment of polarity and proper positioning of the cell division plane are critical for cell proliferation and development. In the budding yeast Saccharomyces cerevisiae, selection of a growth site (i.e., bud site) occurs in a specific pattern depending on cell type and determines the axis of polarized growth. Haploid a and α cells bud in an axial pattern, whereas diploid a/α cells bud in a bipolar pattern (Freifelder, 1960; Hicks et al., 1977; Chant and Pringle, 1995). Selection of a proper bud site depends on cell-type-specific cortical markers and the Rsr1 guanosine triphosphatase (GTPase) module, composed of Rsr1 (also known as Bud1), its GTPase activating protein Bud2, and its GDP-GTP exchange factor (GEF) Bud5 (Bender and Pringle, 1989; Bender, 1993; Chant et al., 1991; Chant and Herskowitz, 1991; Park et al., 1993). These proteins interact with Cdc42 and its regulators to direct organization of the actin cytoskeleton and septin filaments for polarized growth at the selected site (Bi and Park, 2012).
In the absence of spatial cues, yeast cells can still polarize at a single random site. This spontaneous cell polarization (often referred to as symmetry breaking) may occur via positive feedback loops involving the actin cytoskeleton or a Cdc42 signaling network that includes Bem1, the Cdc42 GEF Cdc24, and the Cdc42 effector (p21-activated kinase) (PAK) (Irazoqui et al., 2003; Wedlich-Soldner et al., 2003, 2004; Goryachev and Pokhilko, 2008; Kozubowski et al., 2008). Despite a large number of studies, several aspects of the mechanisms underlying Cdc42 polarization have been under debate (Smith et al., 2013; Woods et al., 2015; Rapali et al., 2017). Although these polarity factors are also required for polarity establishment during spatial cue-directed polarization of wild-type (WT) cells, whether and how similar mechanisms are involved in cell polarization have been less clear, as these studies in spontaneous cell polarization used cells lacking RSR1.
Another important aspect that has been unclear is temporal regulation of polarity establishment. The G1 phase in budding yeast is partitioned into two distinct steps, T1 and T2, by the exit of the transcriptional repressor Whi5 from the nucleus (Di Talia et al., 2007). Yeast cells pass through the cell-cycle commitment point, known as Start, when 50% of Whi5 has exited the nucleus (Doncic et al., 2011). We previously found stepwise activation of Cdc42 in relation to these two steps in G1: Cdc42 is activated by Bud3 in early G1 and subsequently by Cdc24 (Kang et al., 2014). The Rsr1 GTPase module is involved in the first step of Cdc42 polarization in haploid cells (Lee et al., 2015; Kang et al., 2018). Rsr1 also interacts with the polarity proteins: Rsr1-GTP interacts with Cdc24 and Cdc42 (Zheng et al., 1995; Park et al., 1997; Kozminski et al., 2003; Kang et al., 2010) and directs Cdc24 localization to a proper bud site (Park et al., 2002; Shimada et al., 2004). Surprisingly, Rsr1 was found to interact with Bem1 preferentially in its GDP-bound state in vitro (Park et al., 1997), although the physiological significance of this interaction has been unclear.
Bem1 functions as a signaling hub linking many binding partners that interact with its different domains (Bose et al., 2001; Ito et al., 2001; Stahelin et al., 2007; Yamaguchi et al., 2007; Takaku et al., 2010; Liu and Novick, 2014). How could these multiple interactions be temporally regulated? Previous studies have suggested that Cdc24 activity is enhanced by Bem1 (Smith et al., 2013; Rapali et al., 2017), which associates with Cdc24 after Start (Witte et al., 2017). Contrary to these studies, a recent report argues that Bem1 and Cdc24 are active and promote Cdc42 polarization before Start (Moran et al., 2019). In this study, we sought to resolve these discrepancies and answer the following outstanding questions: When does Bem1 function in spatial cue-directed polarization of WT cells? Does Rsr1 indeed have two active states where the GDP-bound form interacts with Bem1 in vivo? If so, what is the functional significance? To address these questions, we examined polarization of proteins including Cdc42-GTP, Cdc24, and Bem1 in haploid and diploid yeast cells as well as interactions between Rsr1 and Bem1 in vivo. Additionally, we used mathematical modeling to address how Rsr1-Bem1 interaction affects Cdc42 polarization. Here we report that Bem1 and Rsr1-GDP interact in early G1. We provide evidence that the association of Rsr1-GDP and Bem1 hinders Bem1-dependent Exo70 localization and may thus prevent premature polarized secretion.
RESULTS
Rsr1-GDP associates with Bem1 in early G1
We confirmed that Rsr1 interacts with Bem1 preferentially in its GDP-bound state in vitro, as previously reported (Park et al., 1997). This GDP-specific association was evident at relatively low levels of Bem1 in vitro, but at higher concentrations, Bem1 exhibited promiscuous interactions with both GTP- and GDP-bound states of Rsr1 (Figure 1Aa). To examine the interaction between Rsr1 and Bem1 in vivo, we performed a bimolecular fluorescence complementation (BiFC) assay, which is based on the recovery of split fluorescent proteins (Hu et al., 2002; Kerppola, 2009). We expressed Bem1 fused to YN (the N-terminal half of yellow fluorescent protein [YFP]) together with YC (the C-terminal half of YFP) fused to WT Rsr1 and mutant Rsr1G12V and Rsr1K16N, which are expected to be in the GTP- and GDP-locked states in vivo, respectively (Ruggieri et al., 1992). YFP fluorescence was observed in haploid cells expressing Bem1-YN and YC-Rsr1K16N (and YC-Rsr1), whereas little fluorescence was detected in cells expressing Bem1-YN and YC-Rsr1G12V. Similarly, Bem1-YN associated with YC-Rsr1K16N but not with YC-Rsr1G12V in diploid cells (Figure 1Ab). The absence of YFP signals in cells expressing Bem1-YN and YC-Rsr1G12V is unlikely due to low levels of expression or instability of the mutant protein because all YC fusions of Rsr1 were present at approximately equal levels (Figure 1A, b and c). Taken together, these observations suggest that Rsr1 indeed associates with Bem1 in its GDP-bound state in vivo.
Figure 1:

Association of Rsr1-GDP with Bem1 during T1. (A) (a) Preferential association of Rsr1-GDP with Bem1 in vitro. GTP[γS] or GDP loaded GST-Rsr1 (∼750 nM) was incubated with His6-Bem1 at each concentration as marked. His6-Bem1 associated with GST-Rsr1 (bound; top panel) and added in each reaction (50% of input; bottom panel) were detected by immunoblotting with polyclonal antibodies against Bem1. (b) BiFC assays in haploid (a) and diploid (a/α) cells expressing YC-Rsr1, YC-Rsr1G12V, or YC-Rsr1K16N, along with Bem1-YN. Arrowheads point to BiFC signal. Bar, 5 µm. (c) The YC fusion proteins of WT and mutant Rsr1 detected with polyclonal anti-GFP antibodies. A nonspecific cross-reacting band (marked with an asterisk) was used as a loading control to normalize the relative YC-Rsr1 protein levels (as indicated with the number in each lane below). (d) Time-lapse images of cells expressing YC-Rsr1K16N, Bem1-YN, and Whi5-RFP at 22°C. Numbers indicate time (min) from the onset of cytokinesis. Bar, 3 μm. (B) (a) FRAP analysis of Bem1-GFP at the division site during T1 (WT, n = 11; rsr1Δ, n = 12; and rsr1K16N, n = 14) or at the incipient bud site during T2 (WT, n = 16; rsr1Δ, n = 13; and rsr1K16N, n = 11). (b) FRAP curves of Bem1-GFP in WT or rsr1K16N cells during T1 or T2. Representative images of cells expressing Bem1-GFP and Whi5-RFP during T1 or T2 are shown.
The BiFC signal from static images of cells expressing Bem1-YN and YC-Rsr1K16N was most evident at the bud neck of large budded cells, at the division site in unbudded cells, and also weakly at the tips of growing buds in some cells (Figure 1Ab). Consistent with these static images, time-lapse images of cells expressing Bem1-YN and YC-Rsr1K16N along with the cell cycle marker Whi5-RFP showed strong BiFC signal at the division site from late M until early G1, although weak fluorescence was also visible at the periphery of large buds (Figure 1Ad). Because a potential caveat of BiFC assays is irreversible association of fusion proteins (Kerppola, 2009), we next used fluorescence recovery after photobleaching (FRAP) to address when in the cell cycle Rsr1-GDP interacts with Bem1 near the division site. If Bem1 associates with Rsr1 at a specific stage in G1, dynamics of Bem1-GFP might be different in rsr1 mutants compared with WT during T1 or T2. Indeed, we found that Bem1-GFP recovers faster after photobleaching in rsr1Δ cells than in WT during T1 (i.e., when Whi5 was in the nucleus), while Bem1-GFP dynamics were similar during T2 in these cells (Figure 1Ba). These data suggest that Rsr1 interacts with Bem1 during T1 but not after the T1–T2 transition. Interestingly, Bem1-GFP exhibited slower dynamics during T2 in rsr1K16N cells than in WT (Figure 1B), suggesting that expression of the constitutively GDP-bound or nucleotide-empty Rsr1 may continue to hold Bem1 longer in G1.
Bem1 polarizes in early G1 but may not function before start
While our results discussed above suggest that Rsr1-GDP is likely to associate with Bem1 in early G1, it has been unclear when in the G1 phase Bem1 polarizes in haploid cells. Even in diploid cells, which were often used to investigate Cdc42 polarization during symmetry breaking (i.e., in rsr1Δ cells), when Bem1 associates with Cdc24 during polarity establishment has been under debate (Witte et al., 2017; Moran et al., 2019). To clarify these discrepancies and to gain insight into the timing of Bem1’s function in spatial cue-directed cell polarization, we examined Bem1 localization together with Whi5-GFP or other polarity markers, Cdc24-GFP and PBD-RFP (the p21-binding domain (PBD) fused to tdTomato, a biosensor for Cdc42-GTP) (Ozbudak et al., 2005; Tong et al., 2007; Okada et al., 2013) throughout the G1 phase. Our analyses focused on daughter cells, which have longer T1 length compared with mother cells. Bem1-RFP localized to the division site shortly after Whi5-GFP entered the nucleus and then to the incipient bud site around the T1–T2 transition (Figure 2Aa), and this localization pattern appeared overlapping with the Cdc42-GTP cluster throughout G1 in WT haploid cells (Supplemental Figure S1; see below). Colocalization of Bem1-RFP with Cdc24-GFP to the incipient bud site was evident during T2 (Figure 2Ba), when the majority of Cdc24 exited the nucleus, as expected from Cdc24 localization in haploid cells (Toenjes et al., 1999; Nern and Arkowitz, 2000; Shimada et al., 2000). Nonetheless, we observed weak Cdc24-GFP signal around the division site during T1 (Figure 2Ba) and also detected the bimolecular fluorescent complex of Cdc24-Bem1 at the division site in large-budded cells (Figure 2Bc), suggesting that a minor portion of Cdc24 is able to interact with Bem1 in T1.
Figure 2:

Localization of Bem1 together with Whi5 or Cdc24 in haploid cells. (A) Time-lapse images of Bem1-RFP and Whi5-GFP in (a) WT and (b) rsr1K16N cells at 30°C. Asterisks mark T1–T2 transition in daughter cells. Numbers indicate time (min) relative to the onset of cytokinesis (t = 0). Bars, 3 μm. (c) Peak Bem1-RFP localized intensity during T1 or T2 is plotted for individual daughter cells (WT, n = 20; rsr1Δ, n = 7; and rsr1K16N, n = 24). (B) Bem1-RFP and Cdc24-GFP in (a) WT and (b) rsr1Δ cells at 22°C. Numbers indicate time (min) relative to the onset of cytokinesis (t = 0). An arrow in a points to weak Cdc24-GFP signal at the division site. Bar, 3 μm. (c) BiFC assays in haploid WT cells expressing Bem1-YN and Cdc24-YC. Arrowheads point to BiFC signal at the division site of large-budded cells. Bar, 5 μm.
Because we observed the association between Rsr1-GDP and Bem1 (see above), we asked whether the localization of Bem1 during early G1 depends on Rsr1. We quantified the local Bem1-RFP intensity near the division site during G1 in haploid WT and rsr1 mutants after time-lapse imaging (see Figure 2, A and B). These analyses indicated that the Bem1-RFP peak intensity was reduced in rsr1Δ cells during T1 compared with those in WT and rsr1K16N cells, whereas it was about the same in these cells during T2 (Figure 2Ac). These results suggest that Bem1 localization during T1 depends on Rsr1-GDP, consistent with the association of Bem1 and Rsr1-GDP. However, Bem1 localization to the division site is not completely abolished in rsr1Δ during T1 (Figure 2Bb), likely due to the presence of other Bem1-interacting protein(s) during this time window.
We next examined localization of Bem1 and these polarity factors in diploid cells to determine how Rsr1 might affect their polarization. In WT daughter cells, Bem1 localized to the division site and to the distal pole (i.e., the pole distal to the birth scar) during T1, whereas it became polarized solely at the distal pole after T1–T2 transition (Supplemental Figures S2a and S3Bb). In diploid rsr1Δ and rsr1K16N cells, Bem1 localized to the cell division site as in WT cells, but its localization to the distal pole became evident only after T1–T2 transition (Supplemental Figures S2, b and c, and S3, Ac and Bb). Unlike Bem1, Cdc24 localization to the distal pole was not evident in T1 in the majority of WT daughter cells (Supplemental Figure S3, Aa and Bc), and colocalization of Bem1 and Cdc24 to the distal pole of daughter cells was evident only when the incipient bud site was established after T1–T2 transition (Supplemental Figure S3Ab, red arrow). Interestingly, however, this distal-pole localization of Bem1 and Cdc24 in late G1 was also observed in daughter cells of rsr1 mutants (Supplemental Figure S3A, b and c), consistent with Cdc42 polarization after Start (see Supplemental Figure S4) and the distal-pole budding of diploid WT and rsr1Δ daughter cells (Michelitch and Chant, 1996). Importantly, even though Bem1 and Cdc24 localizes to the division site in diploid WT as well as rsr1 mutant cells during early G1 (Supplemental Figure S3), the Cdc42-GTP signal (monitored by PBD-RFP) was not evident around the division site during T1 in rsr1Δ cells despite some sporadic appearance of Cdc42-GTP cluster (Supplemental Figure S4; see below). These observations suggest that Bem1 and Cdc24 are unlikely to be functionally active in Cdc42 polarization before Start.
Cdc42 polarization and bud emergence are delayed in cells expressing GDP-locked Rsr1
As described above, we observed little Cdc42 polarization around the division site in diploid rsr1Δ cells during early G1, despite colocalization of Bem1 and Cdc24 to the division site. Why is Bem1 unable to activate Cdc24 in early G1? We hypothesized that the association of Rsr1-GDP with Bem1 in early G1 might hinder Bem1’s function and thus prevent premature activation of Cdc24 until Start. If this were the case, Cdc42 polarization during T2 might be delayed in rsr1K16N cells, which express the constitutively GDP-bound Rsr1. To test this idea, we monitored Cdc42-GTP polarization in WT and rsr1 mutants expressing PBD-RFP and Whi5-GFP. Consistent with previous reports (Atkins et al., 2013; Okada et al., 2013; Kang et al., 2014; Lee et al., 2015), the Cdc42-GTP level was minimum at the onset of cytokinesis but started to increase soon after cytokinesis (Figure 3Aa). From analyses of the PBD-RFP cluster, we estimated the time span from the T1–T2 transition until the Cdc42-GTP level peaked during T2 in daughter cells (Figure 3Ba). The Cdc42-GTP level reached a maximum slightly earlier in rsr1Δ cells after the T1–T2 transition but was particularly delayed in rsr1K16N cells––on average 4 min later––compared with WT cells (Figure 3B). Similarly, the maximum Cdc42 polarization during T2 was established ∼6 min later in the diploid rsr1K16N daughter cells compared with the WT diploid daughters (Supplemental Figure S4). Taken together, these results suggest that the expression of GDP-locked Rsr1 delays Cdc42 polarization, although the peak level of Cdc42-GTP cluster during T2 was about the same among these strains.
Figure 3:

Cdc42 polarization in the second phase is delayed in cells expressing GDP-locked Rsr1. (A) Time-lapse images of PBD-RFP and Whi5-GFP in (a) WT and (b) rsr1K16N cells at 30°C. Numbers indicate time (min) from the onset of cytokinesis (t = 0). Bars, 3 μm. Green and red arrowheads denote the T1–T2 transition point and the time at which the Cdc42-GTP cluster reaches a maximum value during T2, respectively, in daughter cells. (B) (a) The time interval between the T1–T2 transition point and when Cdc42-GTP peaks during T2 (marked with a blue bracket on the scheme) is quantified for individual daughter cells of WT (n = 13), rsr1Δ (n = 15), and rsr1K16N (n = 27). (b) Representative graphs of Cdc42-GTP polarization in daughter cells. Values were normalized to the peak Cdc42-GTP level during T2. (C) (a) Length of T1 and T2 (min) in individual daughter cells. (b) Correlation analysis of T2 length and the peak Cdc42-GTP arrival time after T1–T2 transition in rsr1K16N cells (n = 27).
What could be the consequence of delayed Cdc42 polarization during T2? We postulated that delayed Cdc42 polarization in rsr1K16N cells might result in delayed bud emergence. Indeed, we observed that T2 was longer in rsr1K16N cells compared with WT or rsr1Δ cells, while the average T1 length was similar among all these strains despite cell-to-cell variations in both haploid and diploid cells (Figure 3Ca; Supplemental Figure S4Ca). Remarkably, the T2 length in individual cells positively correlated with the time when the Cdc42-GTP cluster reached its peak level in T2 in both haploid and diploid rsr1K16N daughter cells (Figure 3Cb; Supplemental Figure S4Cb). These observations suggest that expression of GDP-locked Rsr1 in haploid and diploid daughter cells leads to a delay in bud emergence.
Computer simulations recapitulate inhibition of Cdc42 polarization by Rsr1-GDP
It was somewhat surprising to find that Rsr1-GDP might hinder Cdc42 polarization, given the positive role of Rsr1 in Cdc42 polarization (Lee et al., 2015; Kang et al., 2018). To gain insight into the significance of the Rsr1-Bem1 interaction in Cdc42 polarization, we next employed mathematical modeling. We considered a cross-section of a cell representing the plasma membrane as a one-dimensional domain in which the landmark cue is located at the center (Figure 4Aa). We implemented a number of observations and assumptions in our modeling using reaction-diffusion equations (Figure 4A; see Materials and Methods). First, we assumed that the total number of each signaling molecule, such as Cdc42 and Rsr1, in the whole cell remains constant in time (Altschuler et al., 2008; Howell et al., 2009; Lo et al., 2013). Second, the activation rate of Cdc42 depends on Bud3, which links to the spatial cue and Rsr1 during T1 (Kang et al., 2014; Lee et al., 2015), while the activation rate of Cdc42 during T2 is likely to depend on Cdc24 and thus the Bem1/Cdc42 complex via positive feedback (Goryachev and Pokhilko, 2008). Third, Rsr1-GDP may interact with Bem1 to inhibit the Bem1-mediated feedback during T1 (see above), but this interaction may be reduced during T2 since Bem1 is likely to join the polarity complex after Start (Witte et al., 2017). Finally, Cdc42-GTP binds with Gic1/2, which likely stabilizes the Cdc42 cluster, promoting Cdc42 polarization (Kang et al., 2018).
Figure 4:

Modeling Cdc42 polarization in WT and rsr1 mutants. (A) (a) The one-dimensional computational domain representing the cross-section of the cell membrane. (b) The scheme represents the Cdc42 and Rsr1 cycles functioning during T1 and T2. (B) The dynamics of (a) the peak value of Cdc42-GTP and (b) integrated level of Cdc42-GTP cluster in WT, rsr1Δ and GDP-locked rsr1 with different levels (β14) of Bem1-mediated feedback during T1.
To address the question whether Bem1-mediated feedback affects Cdc42 polarization during T1 or only after Start, we compared our simulations of Cdc42 polarization dynamics in WT, rsr1Δ, and a GDP-locked rsr1 mutant with different levels of Bem1-mediated feedback strength (represented by β14) during T1. In rsr1Δ cells, both [Rsr1GTP] and [Rsr1GDP] equal to zero. In cells expressing the GDP-locked Rsr1, the activation rate of Rsr1 was set to zero, as Rsr1 is present constitutively in the GDP-bound state. We assumed that the GDP-locked Rsr1 persistently interferes with Bem1-mediated feedback during T2 but at a lower level compared with its effect during T1. Ten simulations for each scenario (Figure 4Ba) uncovered two important features regarding Cdc42 polarization. Regardless of the Bem1-mediated feedback, Cdc42 polarization during T2 is mostly delayed in the presence of GDP-locked Rsr1, consistent with the results observed in live-cell imaging (see Figure 3 and Supplemental Figure S4). Interestingly, when strongest Bem1-mediated feedback was assumed (β14 = 20 min-1; Figure 4Ba), Cdc42 polarization in the absence of Rsr1 most closely mimicked in vivo observations of rsr1Δ cells, that is, sporadic appearance of the Cdc42-GTP cluster during T1 and slightly earlier arrival of the Cdc42-GTP peak during T2 in rsr1Δ cells than in WT cells (Lee et al., 2015; see Figure 3 and Supplemental Figure S4). Yet the simulations for WT cells are about the same, regardless of the level of Bem1-mediated feedback (Figure 4Ba). Since we quantified Cdc42 polarization cluster (rather than the peak Cdc42-GTP level along the plasma membrane) from our in vivo images, we compared the integrated level of the Cdc42-GTP cluster for each scenario. These simulations of WT and rsr1 mutants also revealed Cdc42 polarization dynamics similar to those when the peak Cdc42-GTP was analyzed (Figure 4Bb). Taken together, our modeling supports our results from live-cell imaging that Rsr1-GDP inhibits Bem1-mediated positive feedback in WT cells during T1. This modeling also implies that Bem1 could function in Cdc42 polarization during T1 if Rsr1-GDP were not present.
Rsr1-GDP may not interfere with the Bem1-Cdc24 interaction
Since we observed a delay in Cdc42 polarization in rsr1K16N cells (see above), we considered the possibility that the interaction between Bem1 and Rsr1-GDP may limit the number of free Bem1 protein in the cell, reducing the Bem1-Cdc24 association. To test this idea, we determined by BiFC assays how the Bem1-Cdc24 association was affected by overexpression of the GDP-locked Rsr1 (Rsr1K16N). While Bem1-YN interacted with Cdc24-YC, as expected, we found that overexpression of Rsr1K16N did not have any obvious effect on the BiFC signals (Figure 5A).
Figure 5:

Overexpression of the GDP-locked Rsr1 does not affect Bem1-Cdc24 interaction. (A) (a) BiFC assays in haploid BEM1-YN CDC24-YC carrying YEp13 or YEp13-Rsr1K16N. Bar, 5 µm. (b) BiFC signal was quantified from three separate experiments (n = 60–170 for each sample per experiment). (B) (a) Diagram of visible IP assay to test Cdc24-Bem1 interaction. (b) Images of beads from visible IP assays using lysates from the BEM1-RFP CDC24-GFP strain carrying YEp13 or YEp13-Rsr1K16N and from the BEM1-RFP strain (as a control) as marked. (c) Ratio of mean intensity of Bem1-RFP over Cdc24-GFP from individual captures of multiple beads.
Next, we used a “visible” immunoprecipitation (VIP) assay (Katoh et al., 2015), which combines immunoprecipitation and microscopy, to examine whether overexpression of Rsr1K16N affects the Cdc24-Bem1 interaction. When lysates prepared from cells expressing both Cdc24-GFP and Bem1-RFP were subjected to pull-down assays using agarose beads bound to a GFP nanobody (see Materials and Methods), both Cdc24-GFP and Bem1-RFP were visible on the beads, indicating that Bem1-RFP was efficiently brought down with Cdc24-GFP. When the same strain carrying a multicopy Rsr1K16N plasmid or an empty vector was subjected to VIP assays, Bem1-RFP was recovered similarly, unlike in a control reaction in which cell lysates containing only Bem1-RFP were used (Figure 5B). Collectively, these results suggest that Cdc24-Bem1 interaction is not disrupted by overexpression of Rsr1-GDP.
Bem1 binds to Rsr1-GDP via its Phox homology (PX) domain
As discussed above, Rsr1 may control proper timing of the second phase of Cdc42 polarization by interacting with Bem1. How does Rsr1 regulate Bem1? Bem1 is known to interact with Cdc24 via its PB1 domain (Ito et al., 2001) and with Cdc42 and Ste20 through its second SH3 domain and the C-terminal flanking region (amino acids 159–251) (Bose et al., 2001; Yamaguchi et al., 2007; Takaku et al., 2010). The Bem1 PX domain contains a region that interacts with phosphoinositides (Stahelin et al., 2007). A region containing both the PX and PB1 domain (amino acids 309–510) of Bem1 has been shown to interact with the exocyst component Exo70 (Liu and Novick, 2014) (Figure 6Aa). To gain insight into the mechanism by which Rsr1 regulates Bem1, we first determined by BiFC assays which region of Bem1 binds to Rsr1-GDP. We found that a deletion of the C-terminal half (amino acids 345–408) of the PX domain almost completely abolished the BiFC signal, while a deletion of its N-terminal half (amino acids 281–345) slightly reduced the BiFC signal (Figure 6). In contrast, deletions of either the first or the second SH3 domain or the PB1 domain did not result in an obvious defect in Bem1-YN association with YC-Rsr1K16N. Similarly, the K482A mutation in the PB1 domain, which disrupts the interaction between Bem1 and Cdc24 (Ito et al., 2001), did not affect the Bem1-Rsr1 interaction (Supplemental Figure S5). These results indicate that the C-terminal half of the Bem1 PX domain is required for interaction with Rsr1K16N.
Figure 6:

Bem1 interacts with Rsr1-GDP likely via its PX domain. (A) (a) Diagram of Bem1 protein domains and known interactions (see text). (b, c) BiFC assays in haploid cells expressing YC-Rsr1K16N, YC-Rsr1G12V, or YC-Cdc42 along with (b) bem1ΔNPX-YN or (c) bem1ΔCPX-YN. See a scheme on the right for each deletion. Bar, 5 µm. (B) Normalized BiFC signal intensity in individual cells expressing YC-Rsr1K16N and Bem1-YN (large-budded, n = 43; unbudded, n = 94), bem1ΔNPX-YN (large-budded, n = 51; unbudded, n = 32), or bem1ΔCPX-YN (large-budded, n = 63; unbudded, n = 100).
Rsr1-GDP hinders Bem1-dependent Exo70 polarization
Interestingly, the C-terminal PX domain of Bem1, which is necessary for interaction with Rsr1, overlaps with the region that mediates actin-independent localization of Exo70 (Liu and Novick, 2014). Thus, we asked whether the association of Bem1 with Rsr1-GDP inhibits Bem1 from promoting Exo70 localization. To test this, we examined how overexpression of Rsr1K16N affects Exo70 polarization in cells transiently inhibited for actin polymerization to block actin-dependent delivery of Exo70. We imaged cells expressing Exo70-RFP (and Whi5-GFP) carrying a multicopy Rsr1K16N plasmid or a vector control after treatment with latrunculin A (LatA), an actin assembly inhibitor (Ayscough et al., 1997), and analyzed Exo70 localization in these cells at different cell cycle stages. Exo70 polarization was not affected by overexpression of Rsr1K16N in cells with a small bud or unbudded cells in T1. In contrast, overexpression of Rsr1K16N did cause decreased polarized localization of Exo70 in mock-treated (dimethyl sulfoxide: DMSO) unbudded cells in T2, and this decrease was even more pronounced in LatA-treated cells in T2 (Figure 7A; Supplemental Figure S6).
Figure 7:

Rsr1-GDP hinders Bem1-dependent Exo70 polarization and polarized secretion. (A) WT haploid cells expressing Exo70-RFP and Whi5-GFP and carrying each plasmid as marked (x-axis) were treated with LatA or DMSO. The percentage of cells with polarized Exo70-RFP (n = 100–270 for each sample per experiment) was determined from static images. Representative images of cells expressing Exo70-RFP and Whi5-GFP are shown for each cell cycle stage analyzed. Student’s t tests were used, with the following notation: ns (not significant) for p ≥ 0.05, *p < 0.05, **p < 0.01, and ***p < 0.001. (B) (a) BiFC assays in the haploid BEM1-YN EXO70-YC strain carrying YEp13, YEp13-Rsr1K16N, or YEp13-Rsr1G12V. Bar, 5 µm. (b) Large-budded, unbudded, or small-budded cells with BiFC signal was quantified from three separate experiments (n = 50–130 for each sample per experiment). (C) (a) Quantification of the time interval (min) from the T1–T2 transition to initial GFP-Sec4 polarization in individual daughter cells of haploid WT (n = 13), rsr1Δ (n = 17), and rsr1K16N (n = 36). (b) Representative graphs of GFP-Sec4 accumulation at the polarity site in individual daughter cells over time after the T1–T2 transition.
In a second approach, we used BiFC assays to determine how overexpression of Rsr1K16N affects the Bem1-Exo70 interaction. We observed strong BiFC signals in cells expressing Bem1-YN and Exo70-YC, indicating the Bem1-Exo70 association, as expected from a previous study (Liu and Novick, 2014). When these cells were examined after transforming with a multicopy plasmid expressing the GTP- or GDP-locked Rsr1 or a vector control, we found that the number of large budded or unbudded cells with positive BiFC signals decreased in cells with YEp-Rsr1K16N but not with YEp-Rsr1G12V or the empty vector (Figure 7B). These results indicate that overexpression of the GDP-locked Rsr1 specifically interferes with the Bem1 and Exo70 interaction in large-budded and unbudded cells but not after bud emergence.
Polarized secretion is delayed in cells expressing the GDP-locked Rsr1
How does expression of the GDP-locked Rsr1 delay bud emergence? A recent report suggests that the timing of bud emergence is governed by the onset of polarized secretion (Lai et al., 2018). As discussed above, overexpression of rsr1K16N inhibits actin-independent Exo70 localization during T2 by interfering with the interaction between Bem1 and Exo70. Exo70 mediates targeting and tethering of vesicles to the polarity site and is thus needed for directing polarized secretion to the incipient bud site (Boyd et al., 2004; He et al., 2007). We postulated that the constitutively GDP-bound Rsr1 might continue to hold Bem1 into T2, resulting in delayed polarized secretion toward the bud site and consequently delayed bud emergence. To test this idea further, we compared timing of polarized secretion using the Rab GTPase GFP-Sec4, together with Whi5-RFP, in WT and rsr1 mutants by time-lapse imaging (Supplemental Figure S7). The onset of Sec4 polarization was evident ∼10 min after the T1–T2 transition in WT cells but was delayed in rsr1K16N cells by 4 min (Figure 7C), suggesting that the interaction between Bem1 and Rsr1-GDP indeed affects the timing of polarized secretion.
DISCUSSION
Rsr1 is involved in the spatial control of polarity establishment by interacting with multiple polarity factors in its GTP-bound state (see Bi and Park, 2012, and references therein). Rsr1 also plays a critical role in Cdc42 polarization before Start (Lee et al., 2015; Kang et al., 2018). In this study, we present in vivo evidence, supported by mathematical modeling, for the role of Rsr1 in temporal regulation of polarity establishment via its association with Bem1 in its GDP-bound state. Our findings answer some outstanding questions regarding Bem1-mediated Cdc42 polarization, while raising new ones.
Our live-cell imaging and FRAP analyses reported here suggest that Rsr1-GDP and Bem1 likely interact in early G1, whereas the interaction may be negligible after Start. How this interaction is regulated in correlation with cell cycle progression remains an open question. One possibility might be that more Rsr1 is converted to the GTP-bound state after Start and thus less Bem1 associates with Rsr1, but the cell-cycle-dependent regulation of Rsr1 is currently unknown. Previous studies propose that Bem1 may be phosphorylated by Cdc28 (Holt et al., 2009) and may not be active until after Start (Witte et al., 2017), suggesting that Bem1 could be modified at Start and thus no longer interact with Rsr1-GDP. When and how Bem1 functions in polarity establishment has been under debate (Smith et al., 2013; Woods et al., 2015; Rapali et al., 2017; Witte et al., 2017; Kang et al., 2018; Moran et al., 2019). Our data presented in this study suggest that Bem1-mediated positive feedback is unlikely operating before Start. Intriguingly, we observed colocalization of Bem1 and Cdc24 in early G1, consistent with a recent report (Moran et al. 2019), and an interaction of these proteins by a BiFC assay in large-budded cells (see Figure 2). However, our in vivo analyses of Cdc42 polarization as well as computational modeling suggest that Bem1 is unlikely functionally active in Cdc42 polarization during early G1 despite its localization. In fact, Bem1 polarizes to the division site in early G1 in haploid and diploid rsr1Δ or rsr1K16N cells but no clear Cdc42-GTP polarization is evident at the site (see Supplemental Figures S2–S4). Moreover, computational modeling suggests that Bem1-mediated feedback can affect pre-Start Cdc42 polarization only if Rsr1 is absent (see Figure 4B). Consistent with these findings, previous studies observed stepwise Cdc42 activation by Bud3 and Cdc24 during T1 and T2, respectively, in haploid cells (Kang et al., 2014) and two modes of the cell-cycle-dependent Cdc42 activation in diploid cells (Witte et al., 2017). In contrast, another study (Moran et al., 2019) argues that both Bem1 and Cdc24 are involved in pre-Start polarization of Cdc42. The reason for this different conclusion of Moran et al. (2019) is not clear, but we speculate that their use of hydroxyurea (HU) treatment of cells might have led to different observations. Arresting cells in early S phase with HU was found to increase Whi5 concentration (Neurohr et al., 2018), and thus HU treatment might have resulted in longer T1 in the subsequent cell cycle after release, likely affecting localization of the polarity factors. Additional studies are required to distinguish these different models and to fully understand the underlying mechanism of Cdc42 polarization.
Cdc42 polarization during T2 is delayed in rsr1K16N cells but not in rsr1Δ cells (see Figure 3; Supplemental Figure S4), indicating that the constitutive expression of Rsr1-GDP hinders Cdc42 polarization. How Rsr1-GDP interferes with Cdc42 polarization remains unclear. We favor the idea that the majority of Bem1 protein normally associates with Rsr1-GDP (and Cdc24) during different phases of G1 in WT cells (see above), but the constitutive expression of Rsr1-GDP keeps Bem1 bound to Rsr1 and thus hinders Cdc42 polarization continuously after Start. Alternatively, Bem1 may interact with these proteins simultaneously, since the Bem1 domain that associates with Cdc24, Rsr1-GDP, or Cdc42 does not overlap. Bem1’s interaction with Rsr1-GDP might, however, interfere with its ability to stimulate Cdc24 activity (Smith et al., 2013; Rapali et al., 2017). In fact, we did not find any evidence that Rsr1-GDP interferes with the Cdc24-Bem1 interaction in two different assays (see Figure 5). Instead, we find that Rsr1-GDP interacts with Bem1 via a region overlapping with the domain that mediates actin-independent localization of Exo70 (Liu and Novick, 2014) and that Rsr1-GDP likely inhibits premature Bem1-mediated Exo70 polarization.
Our findings in this study suggest that Rsr1 plays a delicate role in the coordination of spatial and temporal events leading to bud emergence by associating with distinct polarity factors in its GTP- and GDP-bound states. On the basis of previous reports and findings from this study, we propose a model whereby Rsr1 plays a dual role in polarity establishment (Figure 8): in early G1, the Rsr1 GTPase cycle may be involved in linking the spatial landmark to Cdc42 polarization in haploid cells (Kang et al., 2014, 2018; Lee et al., 2015). Gic1 and Gic2 share a partially redundant role with Rsr1 in Cdc42 polarization during T1 (Kang et al., 2018). Rsr1-GDP associates with Bem1 during T1, and this interaction may inhibit Bem1-mediated positive feedback until Start and ensure the proper timing of polarized secretion for bud emergence (this study). After Start, more Rsr1 may be converted to the GTP-bound form, and/or Bem1 may be modified (Witte et al., 2017) so that Bem1 no longer associates with Rsr1 (this study) and promotes Cdc42 polarization (Irazoqui et al., 2003; Wedlich-Soldner et al., 2004; Goryachev and Pokhilko, 2008; Kozubowski et al., 2008) and Exo70 polarization (Liu and Novick, 2014), leading to polarized secretion to the incipient bud site. The interaction between Rsr1-GDP and Bem1 may ensure proper timing of polarized secretion and thus bud emergence. While Rsr1-GDP associates with Bem1 and delays Cdc42 polarization in diploid cells as well (this study), Rsr1 appears less critical in selection of a proper bud site in diploid daughter cells. Diploid cells polarize almost exclusively to the distal pole even in the absence of Rsr1 during their first budding event (Michelitch and Chant, 1996; this study). Thus distal-pole polarization in diploid daughter cells likely occurs via a mechanism that does not involve Rsr1, but further investigation is required to fully understand the underlying mechanism of cell polarization in different cell types.
Figure 8:

Model for the role of Rsr1 during biphasic Cdc42 polarization. In early G1, Rsr1-GDP associates with Bem1 so that Bem1-mediated positive feedback and Exo70 recruitment may not occur until Start. In mid–late G1, more Rsr1 may be converted to the GTP-bound state, and/or Bem1 may be modified, and thus Bem1 no longer associates with Rsr1 and promotes Cdc42 polarization and polarized secretion to the incipient bud site (see text).
MATERIALS AND METHODS
Strains, plasmids, and general methods
Standard methods of yeast genetics, DNA manipulation, and growth conditions were used (Guthrie and Fink, 1991). Yeast strains were grown in the appropriate synthetic medium containing 2% dextrose as a carbon source. To maintain plasmids, strains were cultured in synthetic medium lacking the appropriate nutrient(s) (e.g., SC-Ura). Yeast strains and plasmids used in this study are listed in Supplemental Tables S1 and S2, respectively, with a brief description of construction methods.
Microscopy and image analysis
Cells were grown in synthetic medium overnight and then freshly subcultured for 3–4 h in the same medium. Time-lapse imaging was performed essentially as previously described (Kang et al., 2014; Miller et al., 2017) using a spinning disk confocal microscope (Ultra-VIEW VoX CSU-X1 system; PerkinElmer) equipped with a 100×, 1.4 NA Plan Apochromat objective lens (Nikon); 440-, 488-, 515-, and 561-nm solid-state lasers (Modular Laser System 2.0; PerkinElmer); and a back-thinned electron-multiplying charge-coupled device (EM CCD) camera (ImagEM C9100-13; Hamamatsu Photonics) on an inverted microscope (Ti-E; Nikon). Images in Figures 5 and 7 and Supplemental Figure S6 were captured on the same inverted microscope but with EM CCD camera (ImageEM X2 C9100-23B; Hamamatsu Photonics). For most time-lapse imaging, images were captured (9 z stacks, 0.3 μm step for haploid cells; 11 z stacks, 0.4 μm step for diploid cells) every 3 or 5 min using cells mounted on an agarose slab at either room temperature or 30°C, as indicated in the figure legends.
Image processing and analyses were performed using ImageJ (National Institutes of Health). Figures are generated using maximum intensity projections of z stacks for fluorescent images and a single middle z-section for DIC images. The nuclear Whi5-GFP or Whi5-RFP intensity was measured by drawing a circular region of interest (ROI) that included the Whi5 signal in the nucleus using summed intensity projection images after background subtraction. The T1–T2 transition was marked when the Whi5 intensity in the nucleus was ∼50% of its peak level (Skotheim et al., 2008; Doncic et al., 2011). The duration time of T1 was considered from the onset of cytokinesis (estimated when PBD-RFP level was the lowest (Okada et al., 2013), which was ∼3–5 min after the nuclear entry of Whi5 at 30°C (Di Talia et al., 2007; Lee et al. 2015) until the T1–T2 transition. The duration time of T2 was determined from the T1–T2 transition until bud emergence (which was estimated from PBD level and DIC images).
Polarized Bem1-RFP was quantified by a threshold method (Okada et al., 2013; Kang et al., 2014) using average intensity projections after background subtraction. The Bem1-RFP integrated density values were obtained for each time point captured over the G1 phase by drawing an ROI around daughter cells. The peak Bem1-RFP values during T1 or T2 were normalized to the average Bem1-RFP peak level in WT cells during T1 or T2, respectively (Figure 2A).
The PBD-RFP cluster in daughter cells was quantified using a threshold method (Okada et al., 2013; Kang et al., 2014) from average intensity projection images of five selected z-sections after background subtraction. The PBD-RFP integrated density values were obtained for each time point captured over the G1 phase. The peak PBD-RFP level during T2 was determined and the time from the T1–T2 transition until the peak PBD-RFP level was calculated for each individual daughter cell (Figure 3B and Supplemental Figure S4B). Sec4-GFP polarization was analyzed similarly using a threshold method, and the time from the T1–T2 transition until detection of initial Sec4-GFP polarization at the incipient bud site was determined for each individual daughter cell (Figure 7C)
To quantify BiFC signals, summed intensity projections were analyzed after background subtraction. A fluorescence threshold was set above background that selected fluorescent pixels at the division site of large budded and unbudded cells. The mean gray value of the YFP signal above the threshold at the division site of each cell was measured. Values were normalized to the average BiFC signal intensity with Bem1-YN in large-budded or unbudded cells, respectively (Figure 6B). To quantify the percentage of cells with positive BiFC signals (Figures 5A and 7B), summed intensity projections were analyzed after background subtraction. A fluorescence threshold was set above background that selected fluorescent pixels at the division site of large budded and unbudded cells. The percentage of cells with a BiFC signal above the threshold was determined from three independent experiments (Figures 5A and 7B).
Cells with polarized Exo70-RFP were quantified at different cell cycle stages based on localization of Whi5-GFP and DIC images: large budded cells with Whi5-GFP in the nucleus (late M), unbudded cells with Whi5-GFP in the nucleus (T1), unbudded cells without Whi5-GFP (T2), and small budded cells. Summed intensity projections of Exo70-RFP z-stack images were created after background subtraction. A fluorescence threshold was set above background that selected fluorescent pixels at the division site in late M and T1 cells, or at the incipient bud site in T2 cells, or at the tips of the growing buds in small budded cells. The percentage of cells with a signal above the threshold was determined from three independent experiments (Figure 7A and Supplemental Figure S6).
To quantify Bem1-RFP and Cdc24-GFP from VIP assays, summed intensity projections of z-stacks were analyzed after background subtraction. Images of the Bem1-RFP alone control were used to determine a threshold that selected fluorescent pixels above background. The same threshold was applied to all images, the mean gray value of all pixels above the set threshold was measured, and then the ratio of Bem1-RFP/Cdc24-GFP was calculated (Figure 5B).
FRAP analysis
To perform FRAP experiments, images were captured at a single z section on a gelatin slab at 22°C using the photokinesis unit on the Ultra-VIEW VoX confocal system (see above), as previously described (Miller et al., 2017; Kang et al., 2018). Before beginning each FRAP experiment, a z-stack image was taken with the 561-nm laser to examine the Whi5-mCherry signal and select cells in T1 or T2. The middle focal plane of cells was chosen to bleach. After collecting five prebleach images, selected ROIs were bleached to <50% of the original fluorescence intensity. Postbleach images were acquired for a duration long enough so that the recovery curve reached a plateau. After background subtraction and correcting for photobleaching, the data were normalized to the mean prebleach intensity of the ROI set to 100% and the intensity just after bleaching set to 0% so that FRAP curves show the percentage of recovery. To reduce noise, the intensity of every three consecutive postbleach time points was averaged. The intensity data were plotted and fitted using the exponential equation y = m1 + m2 * exp(-m3 * X), where m3 is the off-rate, using Prism 6 (GraphPad Software). The half-time of recovery was calculated using the equation t1/2 = (ln2)/m3.
BiFC assays
YC fusions of WT or mutant Rsr1 proteins and VC-Cdc42 were expressed from their chromosomal loci, as previously described (Kang et al., 2010). YN fusions of WT or mutant Bem1 proteins were expressed either using multicopy plasmids or from the chromosome. Cdc24-VC or Exo70-VC were expressed from each chromosomal locus (see Supplemental Tables S1 and S2). Each combination of YC (or VC) and YN fusion proteins were expressed in haploid cells (unless indicated otherwise) and subjected to microscopy (see below). Since the same split site (154/155) was used to generate both YFP and Venus truncated forms for BiFC, YC, or VC fusions were tested in combination with a YN fusion.
For BiFC assays, cells were grown in the appropriate synthetic medium overnight and then freshly subcultured for 3–4 h in the same medium prior to imaging. Cells were mounted on an agarose slab containing the same medium, and static images were captured (5 z-stacks, 0.3 μm step for haploid cells; 5 z-stacks, 0.4 μm step for diploid cells) using a spinning disk confocal microscope (see above) at room temperature. Time-lapse images of haploid cells expressing YC-Rsr1K16N, Bem1-YN, and Whi5-mCherry were captured similarly except every 10 min (Figure 1A).
LatA treatment
Cells were grown in SC-LEU medium (to maintain YEp13 plasmids) overnight and then freshly subcultured for 3–4 h in the same medium at 30°C. Cells were harvested and treated with 100 µM LatA for 10 min or mock-treated with DMSO before imaging using a spinning disk confocal microscope (see above).
Visible IP assay
DLY13038 (CDC24-GFP BEM1-RFP) carrying YEp13-RSR1K16N or YEp13 were grown in SC-LEU, and HPY3336 (BEM1-RFP) was grown in YPD medium overnight. These cells were then freshly subcultured for 3–4 h in the same medium at 30°C until mid–log phase. A total of 44 OD600 units of cells were harvested and cell lysates were prepared using buffer VII (200 mM KCl, 1% Triton X-100, 10% glycerol, 1 mM MgCl2, 50 mM HEPES, pH 7.6, 1 mM ethylene glycol-bis(β-aminoethyl ether) [EGTA]) along with a cocktail of protease inhibitors (Research Products International) and 0.1 mM phenylmethylsulfonyl fluoride (PMSF). Crude cell lysates were centrifuged for 12 min at 10,000 × g, and the supernatant (S10 fraction) was used for subsequent assays. This S10 fraction was then diluted with an equal volume of buffer VII lacking KCl and Triton X-100 and incubated with 10 µl of GFP-Trap beads (gta-10, Chromotek) for 1 h at 4°C by rocking. The beads were then washed 4× using a wash buffer (50 mM KCl, 0.1% Triton X-100, 10% glycerol, 1 mM MgCl2, 50 mM HEPES, pH 7.6, 1 mM EGTA, 1 mM dithiothreitol). Beads were resuspended in a small volume of the same buffer and immediately mounted on an agarose slab, and static images were captured (5 z-stacks, 0.5 μm step) using a spinning disk confocal microscope (see above) with a 40×, NA 1.3 Plan Fluor oil objective lens (Nikon) at room temperature.
Cell lysis and immunoblotting
To determine the WT and mutant Rsr1 YC-fusion protein levels in the strains used for BiFC assays, HPY1213 (YFPC-RSR1), HPY1522 (YFPC-rsr1K16N), and HPY1552 (YFPC-rsr1G12V) were grown to mid–log phase (OD600 of ∼0.7) in YPD at 30°C and subsequently harvested. In brief, 50 OD600 units of cells were used to prepare cell lysates using lysis buffer (50 mM HEPES, pH 7.6, 200 mM KCl, 1 mM EGTA, 1 mM MgCl2, 10% glycerol, 1% Triton X-100). The crude cell lysates were centrifuged for 10 min at 10,000 × g and the supernatant (S10 fraction) was removed and mixed 1:1 with 2× Laemmli sample buffer (2% SDS, 10% glycerol, 0.1 M β-mercaptoethanol, 60 mM Tris-HCl, pH 6.8, 0.001% bromophenol blue). Equal volumes of each sample were loaded onto an SDS–PAGE gel. YC fusion proteins were detected with polyclonal anti-GFP antibodies (Novus Biologicals).
In vitro binding assays
In vitro binding reactions were performed as previously described (Park et al., 1997). GST (glutathione S-transferase)-Rsr1 and six-histidine-tagged Bem1 (His6-Bem1), carrying Bem1 residues from 44 to 551 (the last C-terminal residue), were purified from the protease-deficient Escherichia coli strain NB42. Approximately 750 nM of GST-Rsr1, preincubated with 1 mM guanosine-[γ-thio]triphosphate (GTP[γS]) or GDP, was incubated with His6-Bem1 in a pair (estimated as 15, 75, and 300 nM) in 100 μl of binding buffer (20 mM Tris-HCl, pH 7.5, 85 mM NaCl, 6 mM MgCl2, 10% glycerol, 0.6 mM GDP or GTP[γS]). After incubation, GST-Rsr1 was collected using glutathione-Sepharose. After washing with buffer (binding buffer plus 0.1% Triton X-100 and 0.1 mM PMSF), bound proteins were eluted using elution buffer containing 10 mM reduced glutathione and subjected to SDS–PAGE. GST-Rsr1 and His6-Bem1 were detected by immunoblotting with polyclonal antibodies against GST and Bem1, respectively, as previously described (Park et al., 1997).
Statistical analysis and graph presentation
Data analysis was performed using Prism 6 (GraphPad Software). Graphs in figures show Mean (horizontal lines) ± SEM (error bars) unless indicated otherwise. The bar graphs of FRAP data show median as a line, quartiles, maximum, and minimum (Figure 1B). A two-tailed student’s t test was performed to determine statistical differences between two sets of data: ns (not significant) for p ≥ 0.05; *p < 0.05; **p < 0.01; and ***p < 0.001. Pearson correlation analysis was used to determine the strength of a linear association between T2 length and the peak Cdc42-GTP arrival time after T1–T2 transition (Figure 3C; Supplemental Figure S4C).
Modeling
A model of Cdc42 and Rsr1.
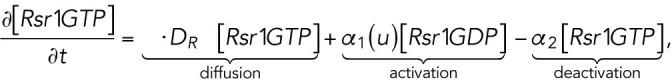
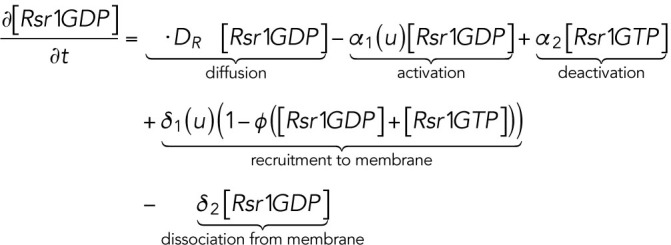
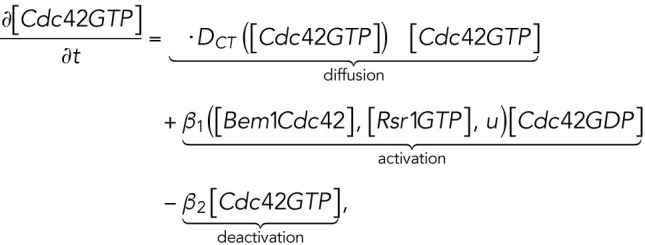
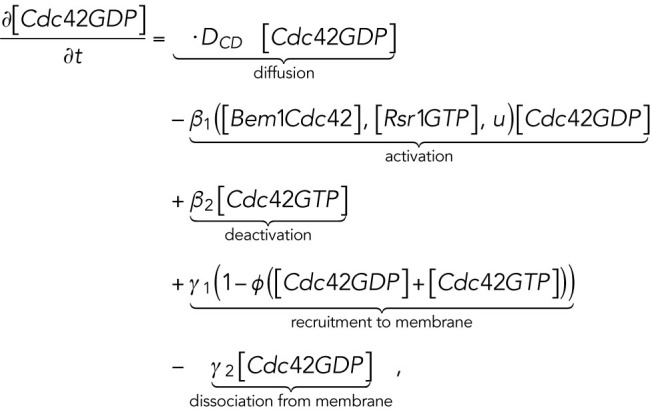
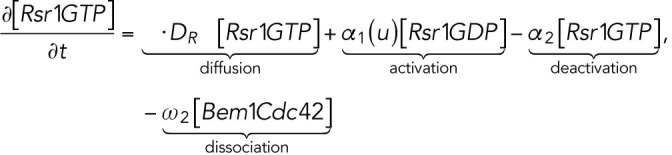
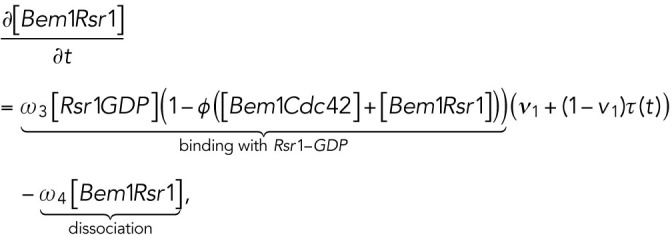
The computational domain, denoted by M in the model, is a region representing cell membrane. For simplicity, we consider the cross-section of the cell membrane which is a one-dimensional domain parameterized by the arc length of the circle, [–2π, 2π], in which the landmark cue is located at the center [–0.5, 0.5] (Figure 4A, a). The model consists of six variables (Figure 4Ab): membrane-bound Rsr1-GTP and Rsr1-GDP, denoted by [Rsr1GTP] and [Rsr1GDP]; membrane-bound Cdc42-GTP and Cdc42-GDP, denoted by [Cdc42GTP] and [Cdc42GDP]; Bem1-Rsr1-GDP complex, denoted by [Bem1Rsr1]; and Bem1-Cdc42-GTP complex, denoted by [Bem1Cdc42].
The dynamics of the molecules is governed by the following system of reaction-diffusion equations:
 |
 |
 |
 |
 |
 |
where the functional  is defined as the average value of a function over the membrane:
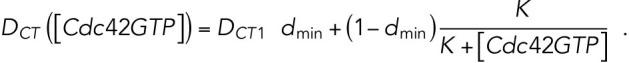
 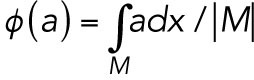 and |M| equals the total area of the domain M (Lo et al., 2013, 2014). As Cdc42-GTP interacts with Gic1/2 to reduce the diffusion rate of Cdc42 (Kang et al., 2018), the diffusion rate of Cdc42-GTP depends on
  and is defined as
 |
The function  represents the switch from T1 to T2:
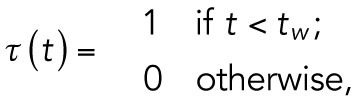 |
where  is the switching time from T1 to T2.
Spatial cue.
The spatial cue mainly functions at the specific location with a little inhomogeneous perturbation during T1. The feedback from Cdc42-GTP may enhance the level of spatial cue, so the function u is defined as
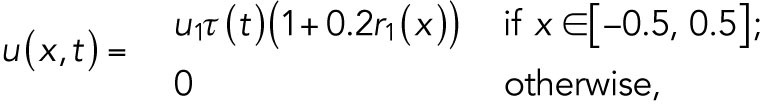 |
where  is a spatially uncorrelated random function from uniform distribution between 0 and 1.
Activation rates of Cdc42 and Rsr1.
Cdc42 is activated in two temporal phases in G1. We assume that Cdc42 polarization depends on the spatial cue u and [Rsr1GTP] during T1, while during T2, the Bem1-mediated positive feedback is involved in Cdc42 polarization, which thus depends on the level of the Bem1-Cdc42-GTP complex. On the basis of this assumption, we define the activation term for Cdc42 as
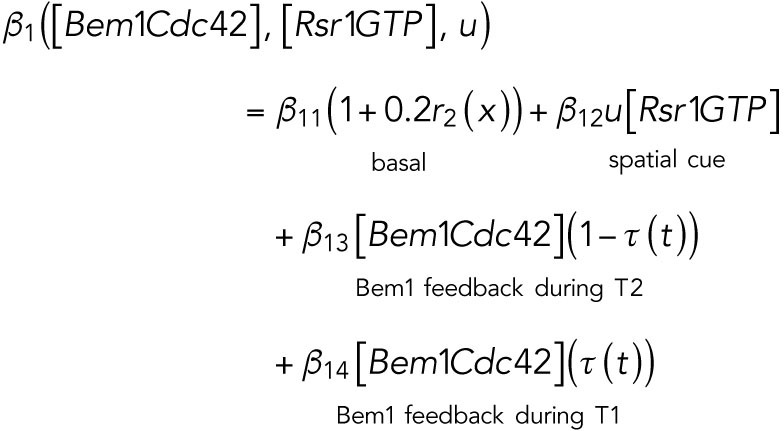 |
where  is a spatially uncorrelated random function from uniform distribution between 0 and 1. We assume that the basal activation rate of Cdc42 has a small inhomogeneous perturbation.
We assume that the spatial cue promotes the recruitment and the activation of Rsr1, and thus the activation term and the recruitment term for Rsr1 are defined as
 |
where  is a spatially uncorrelated random function from uniform distribution between 0 and 1. We assume that the basal activation rate of Rsr1 is with small inhomogeneous perturbation.
Parameter settings.
Based on previous studies (Goryachev and Pokhilko, 2008; Lo et al., 2013), the diffusion rate of Cdc42 on the membrane was around 0.05–0.15 μm2 min-1 and the diffusion rate of Cdc42-GTP is much smaller than that of Cdc42-GDP; the recruitment rate and the basal activation rate of Cdc42 were 1–10 min-1 and 1–10 min-1, respectively; we assume that Rsr1 has similar rates; the normalizing parameter K was taken as 1 in the feedback term for the diffusion rate. In this study, we take DR = DCD = 0.1 μm2 min-1, DCT1 = 0.07 μm2 min-1,  min-1,
 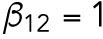 min-1,
  min-1,
  min-1
min-1
 min-1,
  min-1,
  20 min-1,
  min-1,
  min-1,
  min-1,
  min-1, and
  min-1. For the spatial cue, we set
  min-1. We consider that Bem1-mediated feedback may be present during T1 but the magnitude is much weaker during T2, so we set.
  20 min-1, which is much less than
  . We assume that during T1, the interaction rate of Rsr1-GDP and Bem1 is higher than that of Cdc42-GTP and Bem1, and the disassociation rate of Rsr1-GDP and Bem1 is lower than that of Cdc42-GTP and Bem1, and thus we set
  min-1 >
  min-1 and
  min-1 <
  min-1. We assume that the interaction of Bem1 and Rsr1-GDP does not occur during T2, and we thus set the value
  . Our data showed that the T1–T2 switch usually happens about time = 30–32 min (Lee et al., 2015), and thus we set
  min.
min.
Supplementary Material
Acknowledgments
We are grateful to P. J. Kang for discussion, comments on the manuscript, and confirmation of plasmids and strains; and R. Mullner for assisting control strain imaging. We also thank E. Bi, D. Lew, W.-K. Huh, and R. Ruggieri for providing yeast strains and plasmids. This work was supported by grants from the National Institutes of Health/National Institute of General Medical Sciences [R01 GM114582] to H.-O.P.; the Research Grants Council of the Hong Kong Special Administrative Region [Project No. CityU 11303117] to W.C.L.; and the National Science Foundation [DMS 1813071 and DMS 1253481] to C.S.C. K.E.M. was partly supported by the Seilhamer Fellowship from the Jeffrey J. Seilhamer Cancer Foundation.
Abbreviations used:
- BiFC
bimolecular fluorescence complementation
- EM CCD
electron-multiplying charge-coupled device
- FRAP
fluorescence recovery after photobleaching
- GEF
guanine nucleotide exchange factor
- GST
glutathione S-transferase
- GTPase
guanosine triphosphatase
- HU
hydroxyurea
- LatA
latrunculin A
- PAK
p21-activated kinase
- PBD
p21-binding domain
- PX
Phox homology
- VIP
visible immunoprecipitation
- WT
wild type
- YC
C-terminal half of YFP
- YFP
yellow fluorescent protein
- YN
N-terminal half of YFP.
Footnotes
This article was published online ahead of print in MBoC in Press (http://www.molbiolcell.org/cgi/doi/10.1091/mbc.E19-02-0106) on August 14, 2019.
References
- Altschuler SJ, Angenent SB, Wang Y, Wu LF. (2008). On the spontaneous emergence of cell polarity. Nature , 886–889. [DOI] [PMC free article] [PubMed] [Google Scholar]
- Atkins BD, Yoshida S, Saito K, Wu C-F, Lew DJ, Pellman D. (2013). Inhibition of Cdc42 during mitotic exit is required for cytokinesis. J Cell Biol , 231–240. [DOI] [PMC free article] [PubMed] [Google Scholar]
- Ayscough KR, Stryker J, Pokala N, Sanders M, Crews P, Drubin DG. (1997). High rates of actin filament turnover in budding yeast and roles for actin in establishment and maintenance of cell polarity revealed using the actin inhibitor latrunculin-A. J Cell Biol , 399–416. [DOI] [PMC free article] [PubMed] [Google Scholar]
- Bender A. (1993). Genetic evidence for the roles of the bud-site-selection genes BUD5 and BUD2 in control of the Rsr1p (Bud1p) GTPase in yeast. Proc Natl Acad Sci USA , 9926–9929. [DOI] [PMC free article] [PubMed] [Google Scholar]
- Bender A, Pringle JR. (1989). Multicopy suppression of the cdc24 budding defect in yeast by CDC42 and three newly identified genes including the ras-related gene RSR1. Proc Natl Acad Sci USA , 9976–9980. [DOI] [PMC free article] [PubMed] [Google Scholar]
- Bi E, Park H-O. (2012) Cell polarization and cytokinesis in budding yeast. Genetics , 347–387. [DOI] [PMC free article] [PubMed] [Google Scholar]
- Bose I, Irazoqui JE, Moskow JJ, Bardes ES, Zyla TR, Lew DJ. (2001). Assembly of scaffold-mediated complexes containing Cdc42p, the exchange factor Cdc24p, and the effector Cla4p required for cell cycle-regulated phosphorylation of Cdc24p. J Biol Chem , 7176–7186. [DOI] [PubMed] [Google Scholar]
- Boyd C, Hughes T, Pypaert M, Novick P. (2004). Vesicles carry most exocyst subunits to exocytic sites marked by the remaining two subunits, Sec3p and Exo70p. J Cell Biol , 889–901. [DOI] [PMC free article] [PubMed] [Google Scholar]
- Chant J, Corrado K, Pringle JR, Herskowitz I. (1991). Yeast BUD5, encoding a putative GDP-GTP exchange factor, is necessary for bud site selection and interacts with bud formation gene BEM1. Cell , 1213–1224. [DOI] [PubMed] [Google Scholar]
- Chant J, Herskowitz I. (1991). Genetic control of bud site selection in yeast by a set of gene products that constitute a morphogenetic pathway. Cell , 1203–1212. [DOI] [PubMed] [Google Scholar]
- Chant J, Pringle JR. (1995). Patterns of bud-site selection in the yeast Saccharomyces cerevisiae. J Cell Biol , 751–765. [DOI] [PMC free article] [PubMed] [Google Scholar]
- Di Talia S, Skotheim JM, Bean JM, Siggia ED, Cross FR. (2007). The effects of molecular noise and size control on variability in the budding yeast cell cycle. Nature , 947–951. [DOI] [PubMed] [Google Scholar]
- Doncic A, Falleur-Fettig M, Skotheim JM. (2011). Distinct interactions select and maintain a specific cell fate. Mol Cell , 528–539. [DOI] [PMC free article] [PubMed] [Google Scholar]
- Freifelder D. (1960). Bud position in Saccharomyces cerevisiae. J Bacteriol , 567–568. [DOI] [PMC free article] [PubMed] [Google Scholar]
- Goryachev AB, Pokhilko AV. (2008). Dynamics of Cdc42 network embodies a Turing-type mechanism of yeast cell polarity. FEBS Lett , 1437–1443. [DOI] [PubMed] [Google Scholar]
- Guthrie C, Fink GR. (1991). Guide to Yeast Genetics and Molecular Biology, San Diego, CA: Academic Press, vol. . [Google Scholar]
- He B, Xi F, Zhang J, TerBush D, Zhang X, Guo W. (2007). Exo70p mediates the secretion of specific exocytic vesicles at early stages of the cell cycle for polarized cell growth. J Cell Biol , 771–777. [DOI] [PMC free article] [PubMed] [Google Scholar]
- Hicks JB, Strathern JN, Herskowitz I. (1977). Interconversion of yeast mating types III. Action of the homothallism (HO) gene in cells homozygous for the mating type locus. Genetics , 395–405 [DOI] [PMC free article] [PubMed] [Google Scholar]
- Holt LJ, Tuch BB, Villén J, Johnson AD, Gygi SP, Morgan DO. (2009). Global analysis of Cdk1 substrate phosphorylation sites provides insights into evolution. Science , 1682–1686. [DOI] [PMC free article] [PubMed] [Google Scholar]
- Howell AS, Savage NS, Johnson SA, Bose I, Wagner AW, Zyla TR, Nijhout HF, Reed MC, Goryachev AB, Lew DJ. (2009). Singularity in polarization: rewiring yeast cells to make two buds. Cell , 731–743. [DOI] [PMC free article] [PubMed] [Google Scholar]
- Hu CD, Chinenov Y, Kerppola TK. (2002). Visualization of interactions among bZIP and Rel family proteins in living cells using bimolecular fluorescence complementation. Mol Cell , 789–798. [DOI] [PubMed] [Google Scholar]
- Irazoqui JE, Gladfelter AS, Lew DJ. (2003). Scaffold-mediated symmetry breaking by Cdc42p. Nat Cell Biol , 1062–1070. [DOI] [PubMed] [Google Scholar]
- Ito T, Matsui Y, Ago T, Ota K, Sumimoto H. (2001). Novel modular domain PB1 recognizes PC motif to mediate functional protein−protein interactions. EMBO J , 3938–3946. [DOI] [PMC free article] [PubMed] [Google Scholar]
- Kang PJ, Beven L, Hariharan S, Park H-O. (2010). The Rsr1/Bud1 GTPase interacts with itself and the Cdc42 GTPase during bud-site selection and polarity establishment in budding yeast. Mol Biol Cell , 3007–3016. [DOI] [PMC free article] [PubMed] [Google Scholar]
- Kang PJ, Lee ME, Park HO. (2014). Bud3 activates Cdc42 to establish a proper growth site in budding yeast. J Cell Biol , 19–28. [DOI] [PMC free article] [PubMed] [Google Scholar]
- Kang PJ, Miller KE, Guegueniat J, Beven L, Park H-O. (2018). The shared role of the Rsr1 GTPase and Gic1/Gic2 in Cdc42 polarization. Mol Biol Cell , 2359–2369. [DOI] [PMC free article] [PubMed] [Google Scholar]
- Katoh Y, Nozaki S, Hartanto D, Miyano R, Nakayama K. (2015) Architectures of multisubunit complexes revealed by a visible immunoprecipitation assay using fluoresce.nt fusion proteins. J Cell Sci , 2351–2362. [DOI] [PubMed] [Google Scholar]
- Kerppola TK. (2009). Visualization of molecular interactions using bimolecular fluorescence complementation analysis: characteristics of protein fragment complementation. Chem Soc Rev , 2876–2886. [DOI] [PMC free article] [PubMed] [Google Scholar]
- Kozminski KG, Beven L, Angerman E, Tong AHY, Boone C, Park H-O. (2003). Interaction between a Ras and a Rho GTPase couples selection of a growth site to the development of cell polarity in yeast. Mol Biol Cell , 4958–4970. [DOI] [PMC free article] [PubMed] [Google Scholar]
- Kozubowski L, Saito K, Johnson JM, Howell AS, Zyla TR, Lew DJ. (2008). Symmetry-breaking polarization driven by a Cdc42p GEF-PAK complex. Curr Biol , 1719–1726. [DOI] [PMC free article] [PubMed] [Google Scholar]
- Lai H, Chiou J-G, Zhurikhina A, Zyla TR, Tsygankov D, Lew DJ. (2018). Temporal regulation of morphogenetic events in Saccharomyces cerevisiae. Mol Biol Cell , 2069–2083. [DOI] [PMC free article] [PubMed] [Google Scholar]
- Lee ME, Lo W-C, Miller KE, Chou C-S, Park H-O. (2015). Regulation of Cdc42 polarization by the Rsr1 GTPase and Rga1, a Cdc42 GTPase-activating protein, in budding yeast. J Cell Sci , 2106–2117. [DOI] [PMC free article] [PubMed] [Google Scholar]
- Liu D, Novick P. (2014). Bem1p contributes to secretory pathway polarization through a direct interaction with Exo70p. J Cell Biol , 59–72. [DOI] [PMC free article] [PubMed] [Google Scholar]
- Lo W-C, Lee ME, Narayan M, Chou C-S, Park H-O. (2013). Polarization of diploid daughter cells directed by spatial cues and GTP hydrolysis of Cdc42 in budding yeast. PLoS One , e56665. [DOI] [PMC free article] [PubMed] [Google Scholar]
- Lo WC, Park HO, Chou CS. (2014). Mathematical analysis of spontaneous emergence of cell polarity. Bull Math Biol , 1835–1865. [DOI] [PubMed] [Google Scholar]
- Michelitch M, Chant J. (1996). A mechanism of Bud1p GTPase action suggested by mutational analysis and immunolocalization. Curr Biol , 446–454. [DOI] [PubMed] [Google Scholar]
- Miller KE, Lo W-C, Lee ME, Kang PJ, Park H-O. (2017). Fine-tuning the orientation of the polarity axis by Rga1, a Cdc42 GTPase-activating protein. Mol Biol Cell , 3773–3788. [DOI] [PMC free article] [PubMed] [Google Scholar]
- Moran KD, Kang H, Araujo AV, Zyla TR, Saito K, Tsygankov D, Lew DJ. (2019). Cell-cycle control of cell polarity in yeast. J Cell Biol , 171–189. [DOI] [PMC free article] [PubMed] [Google Scholar]
- Nern A, Arkowitz RA. (2000). Nucleocytoplasmic shuttling of the Cdc42p exchange factor Cdc24p. J Cell Biol , 1115–1122. [DOI] [PMC free article] [PubMed] [Google Scholar]
- Neurohr GE, Terry RL, Sandikci A, Zou K, Li H, Amon A. (2018). Deregulation of the G1/S-phase transition is the proximal cause of mortality in old yeast mother cells. Genes Dev , 1075–1084. [DOI] [PMC free article] [PubMed] [Google Scholar]
- Okada S, Leda M, Hanna J, Savage NS, Bi E, Goryachev AB. (2013). Daughter cell identity emerges from the interplay of Cdc42, septins, and exocytosis. Dev Cell , 148–161. [DOI] [PMC free article] [PubMed] [Google Scholar]
- Ozbudak EM, Becskei A, van Oudenaarden A. (2005). A system of counteracting feedback loops regulates Cdc42p activity during spontaneous cell polarization. Dev Cell , 565–571. [DOI] [PubMed] [Google Scholar]
- Park H-O, Bi E, Pringle JR, Herskowitz I. (1997). Two active states of the Ras-related Bud1/Rsr1 protein bind to different effectors to determine yeast cell polarity. Proc Natl Acad Sci USA , 4463–4468. [DOI] [PMC free article] [PubMed] [Google Scholar]
- Park H-O, Chant J, Herskowitz I. (1993). BUD2 encodes a GTPase-activating protein for Bud1/Rsr1 necessary for proper bud-site selection in yeast. Nature , 269–274. [DOI] [PubMed] [Google Scholar]
- Park H-O, Kang PJ, Rachfal AW. (2002). Localization of the Rsr1/Bud1 GTPase involved in selection of a proper growth site in yeast. J Biol Chem , 26721–26724. [DOI] [PubMed] [Google Scholar]
- Rapali P, Mitteau R, Braun C, Massoni-Laporte A, Ünlü C, Bataille L, Arramon FS, Gygi SP, McCusker D. (2017). Scaffold-mediated gating of cdc42 signalling flux. Elife , e25257. [DOI] [PMC free article] [PubMed] [Google Scholar]
- Ruggieri R, Bender A, Matsui Y, Powers S, Takai Y, Pringle JR, Matsumoto K. (1992). RSR1, a ras-like gene homologous to Krev-1 (smg21A/rap1A): role in the development of cell polarity and interactions with the Ras pathway in Saccharomyces cerevisiae. Mol Cell Biol , 758–766. [DOI] [PMC free article] [PubMed] [Google Scholar]
- Shimada Y, Gulli M-P, Peter M. (2000). Nuclear sequestration of the exchange factor Cdc24p by Far1 regulates cell polarity during mating. Nat Cell Biol , 117–124. [DOI] [PubMed] [Google Scholar]
- Shimada Y, Wiget P, Gulli MP, Bi E, Peter M. (2004). The nucleotide exchange factor Cdc24p may be regulated by auto-inhibition. EMBO J , 1051–1062. [DOI] [PMC free article] [PubMed] [Google Scholar]
- Skotheim JM, Di Talia S, Siggia ED, Cross FR. (2008). Positive feedback of G1 cyclins ensures coherent cell cycle entry. Nature , 291–296. [DOI] [PMC free article] [PubMed] [Google Scholar]
- Smith SE, Rubinstein B, Mendes Pinto I, Slaughter BD, Unruh JR, Li R. (2013). Independence of symmetry breaking on Bem1-mediated autocatalytic activation of Cdc42. J Cell Biol , 1091–1106. [DOI] [PMC free article] [PubMed] [Google Scholar]
- Stahelin RV, Karathanassis D, Murray D, Williams RL, Cho W. (2007). Structural and membrane binding analysis of the phox homology domain of Bem1p: Basis of phosphatidylinositol 4-phosphate specificity. J Biol Chem , 25737–25747. [DOI] [PubMed] [Google Scholar]
- Takaku T, Ogura K, Kumeta H, Yoshida N, Inagaki F. (2010). Solution structure of a novel Cdc42 binding module of Bem1 and its interaction with Ste20 and Cdc42. J Biol Chem , 19346–19353. [DOI] [PMC free article] [PubMed] [Google Scholar]
- Toenjes KA, Sawyer MM, Johnson DI. (1999). The guanine-nucleotide-exchange factor Cdc24p is targeted to the nucleus and polarized growth sites. Curr Biol , 1183–1186. [DOI] [PubMed] [Google Scholar]
- Tong Z, Gao X-D, Howell AS, Bose I, Lew DJ, Bi E. (2007). Adjacent positioning of cellular structures enabled by a Cdc42 GTPase-activating protein mediated zone of inhibition. J Cell Biol , 1375–1384. [DOI] [PMC free article] [PubMed] [Google Scholar]
- Wedlich-Soldner R, Altschler S, Wu L, Li R. (2003). Spontaneous cell polarization through actomyosin-based delivery of the Cdc42 GTPase. Science , 1231–1235. [DOI] [PubMed] [Google Scholar]
- Wedlich-Soldner R, Wai SC, Schmidt T, Li R. (2004). Robust cell polarity is a dynamic state established by coupling transport and GTPase signaling. J Cell Biol , 889–900. [DOI] [PMC free article] [PubMed] [Google Scholar]
- Witte K, Strickland D, Glotzer M. (2017). Cell cycle entry triggers a switch between two modes of Cdc42 activation during yeast polarization. Elife , e26722. [DOI] [PMC free article] [PubMed] [Google Scholar]
- Woods B, Kuo CC, Wu CF, Zyla TR, Lew DJ. (2015). Polarity establishment requires localized activation of Cdc42. J Cell Biol , 19–26. [DOI] [PMC free article] [PubMed] [Google Scholar]
- Yamaguchi Y, Ota K, Ito T. (2007). A novel Cdc42-interacting domain of the yeast polarity establishment protein Bem1: Implications for modulation of mating pheromone signaling. J Biol Chem , 29–38. [DOI] [PubMed] [Google Scholar]
- Zheng Y, Bender A, Cerione RA. (1995). Interactions among proteins involved in bud-site selection and bud-site assembly in Saccharomyces cerevisiae. J Biol Chem , 626–630. [DOI] [PubMed] [Google Scholar]
Associated Data
This section collects any data citations, data availability statements, or supplementary materials included in this article.