

Abstract
DNA damage signaling is critical for the maintenance of genome integrity and cell fate decision. Poly(ADP-ribose) polymerase 1 (PARP1) is a DNA damage sensor rapidly activated in a damage dose- and complexity-dependent manner playing a critical role in the initial chromatin organization and DNA repair pathway choice at damage sites. However, our understanding of a cell-wide consequence of its activation in damaged cells is still limited. Using the phasor approach to fluorescence lifetime imaging microscopy and fluorescence-based biosensors in combination with laser microirradiation, we found a rapid cell-wide increase of the bound NADH fraction in response to nuclear DNA damage, which is triggered by PARP-dependent NAD+ depletion. This change is linked to the metabolic balance shift to oxidative phosphorylation (oxphos) over glycolysis. Inhibition of oxphos, but not glycolysis, resulted in parthanatos due to rapid PARP-dependent ATP deprivation, indicating that oxphos becomes critical for damaged cell survival. The results reveal the novel prosurvival response to PARP activation through a change in cellular metabolism and demonstrate how unique applications of advanced fluorescence imaging and laser microirradiation-induced DNA damage can be a powerful tool to interrogate damage-induced metabolic changes at high spatiotemporal resolution in a live cell.
INTRODUCTION
Poly(ADP-ribose) polymerase 1 (PARP1) functions as a DNA damage sensor whose enzymatic activity is rapidly activated in response to DNA damage (Gupte et al., 2017). PARP1 uses oxidized NAD (NAD+) as a substrate to ADP(ribosyl)ate itself and various target proteins. Although initially recognized as a base excision repair factor, it is now known that PARP1 is involved in multiple DNA repair pathways. Rapid poly(ADP-ribose) (PAR) accumulation at damage sites controls damage site accessibility through the recruitment of various chromatin modifiers and dictates DNA repair pathway choice (Ahel et al., 2009; Gottschalk et al., 2009; Sun et al., 2009; Bouwman et al., 2010; Chou et al., 2010; Larsen et al., 2010; Polo et al., 2010; Smeenk et al., 2010; Ball and Yokomori, 2011; Jaspers et al., 2013; Ayrapetov et al., 2014; Khoury-Haddad et al., 2014; Altmeyer et al., 2015; Izhar et al., 2015; Gupte et al., 2017). We also demonstrated that PARP1 activation suppresses the 53BP1 recruitment to damage sites, providing another explanation for 53BP1- and NHEJ-dependent cytotoxicity by PARP inhibition (Cruz et al., 2016).
In addition to promoting efficient repair and thus cell survival, PARP was also shown to affect metabolism and mediate senescence and cell death (both apoptosis and necrosis) when hyperactivated (Gupte et al., 2017). Since the oxidized and reduced forms of NAD (NAD+ and NADH, respectively) are metabolic cofactors critical for cellular energy production (Heikal, 2010), consumption of NAD+ by damage-induced PARP activation was expected to hinder cellular energy metabolism. In addition, PARP1 was reported to inhibit hexokinase (HK), a critical enzyme in the glycolysis pathway through PARylation (Andrabi et al., 2014; Fouquerel et al., 2014; Feng et al., 2015), resulting in ATP deprivation and subsequent cell death termed parthanatos (Andrabi et al., 2008). Parthanatos was shown to require PAR-dependent nuclear translocation of apoptosis-inducing factor (AIF) from mitochondria (Fatokun et al., 2014), but AIF-independent parthanatos was also reported (Jang et al., 2017). In addition, PARP activation causes intracellular acidification, which appears to promote necrosis (Affar et al., 2002). Thus, the downstream effects of PARP activation are complex, and the precise relationship between the DNA damage dosage and the strength of PARP signaling that affects energy metabolism and/or triggers cell death is not well delineated.
Because NADH is an essential cofactor for oxidation-reduction (redox) reactions and production of ATP, multiphoton microscopy techniques to capture NADH autofluorescence and measure metabolic dynamics in living cells have recently garnered attention for their broad applicability in studies ranging from development to cancer and aging (Skala and Ramanujam, 2010; Stringari et al., 2012a,b). The free and protein-bound states of NADH were shown to reflect glycolysis and oxidative phosphorylation (oxphos), respectively, which can be differentiated using fluorescence lifetime imaging microscopy (FLIM) (Schneckenburger et al., 2004; Skala et al., 2007a,b; Heikal, 2010; Georgakoudi and Quinn, 2012; Stringari et al., 2012a). One of the major challenges of FLIM is the fitting routine required to dissect the possible lifetime contributions of different fluorescent species in a single pixel. In our approach, we apply the fit-free phasor approach to FLIM analysis that provides a graphical representation of the fluorescence decay at each pixel (Digman et al., 2008). Pixels that have multiple contributions of fluorophore lifetimes can be resolved as a linear combination of the individual species. Furthermore, the absolute concentration of NADH can be measured using the phasor-FLIM method (Ma et al., 2016), which is expected to sensitively respond to the changes of NAD+ (Nakamura et al., 2003). Here, using the phasor-FLIM approach in conjunction with fluorescent biosensors and laser microirradiation, we examined the real time metabolic changes in response to both nucleus-restricted and conventional DNA damage with high spatiotemporal resolution and interrogated the contribution of differential PARP signaling in response to different dosage/complexity of DNA damage. Using this comprehensive approach, we observed rapid reduction of NADH (correlating with the decrease of NAD+) and ATP in both the nucleus and cytoplasm in a PARP1 activity–dependent manner. Interestingly, PARP1 activation also triggers a rapid increase of protein-bound NADH species over free NADH, which correlates with the net increase of oxphos over glycolysis. Importantly, this shift appears to reflect the increased metabolic dependence of damaged cells on oxphos. Inhibitors of oxphos, but not glycolysis, specifically sensitized cells to DNA damage with exacerbated ATP deprivation, resulting in PARP-dependent, caspase-independent, cell death. The increased dependence on oxphos is rescued by NAD+ replenishment, suggesting that it is distinct from the effect of PAR-dependent inhibition of HK in glycolysis. Taken together, the phasor approach to FLIM and fluorescence biosensors in combination with laser microirradiation provides valuable tools to capture high-resolution single cell dynamics of metabolic changes in response to DNA damage and uncovered the key downstream consequence of NAD+ consumption by PARP1 that promotes cell survival in DNA-damaged cells.
RESULTS
Phasor-approach to FLIM reveals a ratiometric increase of protein-bound NADH over free NADH in response to DNA damage
Using laser microirradiation, DNA damage-induced changes of the free and bound fractions of NADH were measured by FLIM in the cytoplasm and nucleus in HeLa cells. Laser microirradiation can be used to induce DNA damage in a highly controlled manner (Kong et al., 2009, 2011; Gomez-Godinez et al., 2010; Silva et al., 2014; Cruz et al., 2016). In particular, titration of the input power of near-infrared (NIR) laser allows differential DNA damage induction, from relatively simple strand breaks to complex DNA damage (i.e., single- and double-strand breaks [SSBs and DSBs], thymine dimer formation, and base damage) with differential H2AX phosphorylation (γH2AX) and PARP activation as previously reported (Supplemental Figure S1A; see Figure 2A later in this article) (Kong et al., 2011; Cruz et al., 2016). With high input power, complex DNA damage induces pan-nuclear γH2AX (see Figure 2A later in this article), which we previously demonstrated to be ATM and DNA-PK–dependent (Cruz et al., 2016). Similar spreading of γH2AX was observed with localized heavy ion irradiation (Meyer et al., 2013). Over 90% of cells were viable at 24 h after microirradiation with medium input power, whereas cells actually recovered and proliferated with low input power irradiation (Supplemental Figure S1B). With high input power, over 70% of irradiated cells were viable after 24 h and surviving cells were arrested in interphase with no evidence for senescence at least up to 60 h postirradiation (Supplemental Figure S1, B and C).
FIGURE 2:

Damage-induced increase of the bound to free NADH ratio is PARP1-dependent. (A) Immunofluorescence staining for PAR (left) and γH2AX (right) in HeLa cells fixed at various time points up to 12 h postdamage following low, medium, and high input laser power. Scale bar = 5 µm. (B) The fraction of bound NADH and intensity of NADH over time in the cytoplasmic and nuclear compartments of HeLa cells treated with 0.1% DMSO (top), 20 µM PARP inhibitor (olaparib) (middle), or 10 µM ATM inhibitor (KU55933) and 10 µM DNA-PK inhibitor (NU7026) (bottom). (C) The percent change in the fraction of bound NADH (top) and the intensity of NADH (bottom) at 2 h (left) and 12 h (right) postdamage relative to basal conditions. N = 20. *p < 0.05, **p < 0.01, ***p < 0.001. (D) The change in fraction of bound NADH over time in the cytoplasmic (left) and nuclear (middle) compartments of HeLa cells with siPARP1 or control siRNA. N = 15. Western blot analysis (right) of siControl and siPARP1 transfected HeLa cells. The whole cell extracts were run on SDS–PAGE and blotted with anti-PARP1 antibody. Anti-actin antibody served as loading control.
Using these varying laser input powers, we examined the effect of nuclear DNA damage on cellular metabolism in real time. Clusters of pixels were detected on the phasor plot and used to pseudocolor the intensity images according to fluorescence lifetime (Figure 1, A and B). We also measured both NADH intensity and concentration (Ma et al., 2016), which are largely comparable and are reduced in a damage dose–dependent manner (Supplemental Figure S2A). The major source of cytoplasmic NADH signal is in the mitochondria (Figure 1A, fluorescence intensity). Comparison of NAD+ in the mitochondria and cytoplasm using the NAD+-specific biosensor (Cambronne et al., 2016) also showed largely concordant reduction in response to DNA damage (Supplemental Figure S2C). Interestingly, FLIM analyses revealed the increase in the ratio of the bound NADH fraction over free NADH within the first 120 min postdamage induction in both the cytoplasm and nucleus in a damage-dose–dependent manner (Figure 1, C and E). Treatment with alkylating (MMS) and oxidizing (H2O2) damaging agents also exhibited transient shifts toward a high fraction of bound NADH in addition to transient NADH decrease (Figure 1, D and E; Supplemental Figure S2B). Thus, the increase of bound NADH is a general response to DNA damage, not restricted to laser damage.
FIGURE 1:

DNA damage induces rapid shift from free to bound NADH. (A) Intensity (top) and pseudocolored FLIM (bottom) images of undamaged HeLa cells (no dmg) and HeLa cells damaged at low, medium, and high input laser power. In intensity images, the line color from blue to red corresponds to the normalized intensity. Damage sites are indicated by white arrows. The FLIM images are pseudocolored according to the clusters selected on the phasor plot in B. Scale bar = 5 µm. (B) Phasor histogram of fluorescence lifetimes on the phasor plot. Each pixel from the intensity image is transformed and plotted on the phasor diagram. Pixels are pseudocolored based on the position along the line generated by the linear combination of short lifetime free NADH and longer lifetime protein-bound NADH. (C) The fraction of bound NADH in the cytoplasmic and nuclear compartments calculated from the position of the phasor in B and plotted over time. N = 25. (D) The fraction of bound NADH over time in the cytoplasmic and nuclear compartments of HeLa cells treated with either 1 mM MMS or 500 µM H2O2. N = 25. (E) The percent change in the fraction of bound NADH at 2 h postdamage relative to basal conditions. N = 25. *p < 0.05, **p < 0.01, ***p < 0.001.
While an increase of bound NADH was transient for low and medium laser damage conditions, the fraction of bound NADH remained significantly high for over 12 h with high input power damage in both cytoplasm and nucleus (Figure 1C; Supplemental Figure S3A; also see Figure 2B, dimethyl sulfoxide [DMSO] control). There is a significant correlation between cytoplasmic and nuclear increase of bound NADH in each cell (R2 = 0.849) (Supplemental Figure S3B). In contrast, a decrease of NADH intensity/concentration and an increase of bound NADH fraction are discordant in both cytoplasm (R2 = 0.373) and nucleus (R2 = 0.005). Furthermore, we found that NADH recovery following its transient decrease by damage induction is highly variable with no significant correlation between the cytoplasmic and nuclear compartments within each cell (R2 = 0.028). Taken together, the results indicate that the shift to bound NADH persists at high damage and is not the mere reflection of NADH depletion.
Increase of the bound NADH fraction is entirely dependent on PARP1 activity
What regulates the damage-induced increase of bound NADH fraction? Two major damage signaling pathways are the PARP and PIKK pathways, which are both activated in a damage dose/complexity-dependent manner (Cruz et al., 2016). ATM is a member of the PIKK family, specifically activated by DNA damage to govern cell cycle checkpoint as well as DNA repair through target protein phosphorylation (Shiloh, 2003). ATM and another PIKK member DNA-PK, which mediates nonhomologous end joining of DSBs, are both involved in the spreading of nuclear-wide γH2AX in response to high-dose complex DNA damage (Burma et al., 2001; Meyer et al., 2013; Cruz et al., 2016). Accordingly, PAR and γH2AX were induced initially at damage sites and spread to the whole nucleus in a damage dose–dependent manner (Figure 2A). Thus, we examined the effect of inhibition of PARP or ATM/DNA-PK on the increase of the bound NADH fraction (Figure 2 and Supplemental Figure S4). The combination of ATM and DNA-PK inhibitors (AiDi) had no significant effect on either the bound NADH fraction or NADH intensity (Figure 2, B and C). In contrast, inhibition of PARP by olaparib (PARPi) blocked the transient decrease of NADH intensity in both cytoplasm and nucleus, suggesting that the decrease of NADH in response to damage reflects deprivation of NAD+ by PARP and confirmed that PARP activation originating in the nucleus affects NAD+/NADH concentration in the whole cell (Figure 2, B and C). PARPi also dramatically suppressed the damage-induced increase of the bound NADH fraction (Figure 2, B and C). Similar results were obtained with another PARP inhibitor NU1025 (unpublished data). Importantly, comparable results were obtained with the depletion of PARP1 by small interfering RNA (siRNA), indicating that PARP1, among the multiple PARP family members, is primarily responsible for the observed NADH dynamics (Figure 2D). Taken together, the results indicate that the change in the NADH state is dependent on PARP1 and not ATM or DNA-PK signaling.
Increase of bound NADH is sensitive to oxphos inhibitors and NAD+ replenishment
Previous studies indicated that the increase and decrease in protein-bound NADH in the cell reflect the oxphos and glycolytic pathways of energy metabolism, respectively (Schneckenburger et al., 2004; Skala et al., 2007a,b; Heikal, 2010; Georgakoudi and Quinn, 2012; Stringari et al., 2012a). Thus, we examined the effect of the mitochondrial complex I and III respiratory (electron transport) chain inhibitors (rotenone and antimycin A, respectively) (R+A). The inhibitor treatment suppressed the damage-induced long-term increase of the protein-bound NADH fraction, strongly suggesting that the observed increase of NADH reflects oxphos (Figure 3, A and B, left panels, and Supplemental Figure S5A). Interestingly, under our condition, there is an initial increase of the bound species in response to R+A treatment with high input power laser even though the initial decrease of NADH intensity was effectively inhibited (Figure 3, left panels, and Supplemental Figure S5A). This suggests that the initial increase (within 2 h of damage induction) and subsequent maintenance of the high bound/free NADH ratio may represent distinct phenomena.
FIGURE 3:
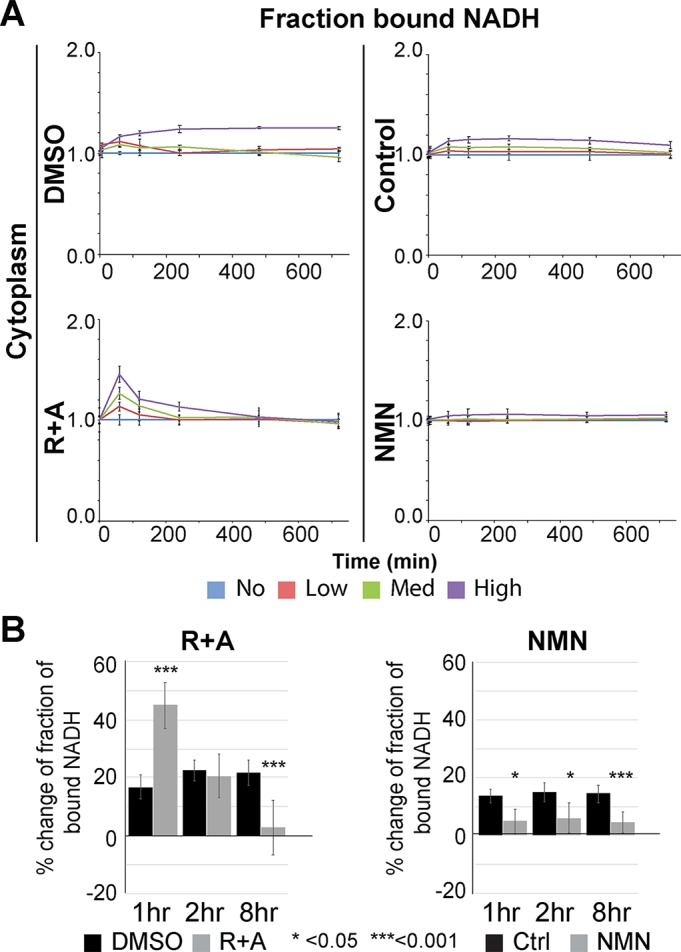
Increase of the bound NADH fraction is suppressed by the respiratory chain inhibitors. (A) The change in fraction of bound NADH in the cytoplasm plotted over time in cells damaged with low, medium, and high input laser power in the presence of control (0.1% DMSO) and 1 µM rotenone and 1 µM antimycin A (R+A) (left panels) and control (water) and 1 mM NMN (right panels) as indicated. N = 20 for each. (B) The change in the fraction of bound NADH at 1, 2, and 8 h postdamage in cells damaged with high input laser power in control cells and cells treated for 1 h with R+A (left) or 1 mM NMN (right) as indicated. Data were normalized to initial value before damage. N = 25. *p < 0.05, ***p < 0.001.
Our analyses revealed that the increase of the bound NADH fraction was suppressed by PARP1 depletion or PARP inhibition (Figure 2, B and D). The observed effect of PARP inhibition can be due to suppression of target protein PARylation and/or blocking the deprivation of intracellular NAD+ (the substrate used by PARP). To test the latter hypothesis, we examined whether supplementing NAD+ would reverse the effect. The addition of nicotinamide mononucleotide (NMN) and nicotinamide (NAM), precursors of NAD+ in the salvage pathway, not only inhibited the decrease of NADH but also suppressed the shift to a high bound NADH fraction in both the nucleus and the cytoplasm (Figure 3, right panels, and Supplemental Figure S5, B–D). The increase of bound NADH was completely suppressed during the first 4 h comparable to PARPi or PARP1 depletion (Figure 2, B and D). The results demonstrate that NAD+ consumption by PARP is the trigger to induce the shift to bound NADH. Failure to suppress the initial increase of bound NADH by R+A may represent the compensatory increase of NADH binding to the complex I enzyme whose catalytic activity is inhibited by rotenone.
The increase of bound NADH fraction reflects the increased metabolic reliance on oxphos
The observed reduction of bound NADH by the respiratory chain inhibitors strongly suggests that the damage-induced change of NADH state reflects the change in energy metabolism. To substantiate this result, metabolic flux analysis by the Seahorse XF Analyzer was performed in control and MMS-treated cells. The FLIM analyses indicate that the respiratory inhibitors have similar effects on MMS-treated cells compared with the laser-damaged cells (Figures 3 and 4A; Supplemental Figure S5). Under this damaging condition, both oxphos as measured by the oxygen consumption rate (OCR) and glycolysis by the extracellular acidification rate (ECAR) were reduced compared with the undamaged cells, with suppression of ECAR more severe (Figure 4B). While PARPi has no significant effect on either basal OCR or ECAR in damaged cells, damage-induced inhibition of peak OCR and ECAR is strongly alleviated by PARPi. Cellular reliance on oxidative metabolism (OCR/ECAR) was also calculated. The results indicate the significantly elevated maximum, but not basal, oxidative reliance in MMS-treated cells compared with the control undamaged cells, which are suppressed by PARPi (Figure 4B). Importantly, NAD+ replenishment (by the addition of NMN) had a similar effect (Figure 4C). We found that at 1 h postdamage release, inhibition of glycolysis (ECAR) is less pronounced than at 2 h. Nevertheless, both were rescued by NMN, though less complete than by PARP inhibition (Figure 4, B and C). The difference between PARP inhibition and NMN addition may be due to the contribution of PAR-dependent HK inhibition in glycolysis (Andrabi et al., 2014). Our results indicate that NAD+ consumption significantly contributes to the inhibition of glycolysis as well as oxphos, and that differential inhibition of the two pathways results in an apparent increase of the OCR/ECAR ratio. Taken together, these results demonstrate that complex DNA damage that induces robust PARP activation and NAD+ deprivation triggers a metabolic shift resulting in greater reliance on oxphos over glycolysis.
FIGURE 4:

Seahorse analysis of MMS-treated cells reveals PARP-dependent increase of oxphos over glycolysis. (A) The percent change in the fraction of bound NADH (left) and intensity of NADH (right) in the cytoplasmic and nuclear compartments calculated from the position of the phasor in (Figure 1B) and plotted over time in control undamaged cells or cells damaged with 3 mM MMS and with or without R+A (0.25 µM each). N = 20. **p < 0.001. (B) The OCR (left) and ECAR (right) for untreated cells or cells treated with 3 mM MMS and 0.1% DMSO or 20 µM PARP inhibitor (olaparib) as analyzed by the Agilent Seahorse XF Analyzer. The ratio of OCR to ECAR (oxidative reliance) evaluated at basal conditions (OCR/ECAR [basal]) or at maximum metabolic capacities calculated following FCCP for OCR and following oligomycin for ECAR (OCR/ECAR [Max.]). **p < 0.001. (C) Cells were treated with 2 mM MMS for 1 h in the presence or absence of 1 mM NMN. The OCR and ECAR were measured by the Agilent Seahorse XF Analyzer 1 or 2 h after release from MMS. Untreated cells served as control. The ratios of maximum OCR (after FCCP treatment) to maximum ECAR (after oligomycin treatment) are shown. *p < 0.01, **p < 0.001; n.s. not significant (p > 0.05).
Oxidative phosphorylation is critical for damaged cell survival
To assess the biological significance of the observed metabolic shift, we examined cellular damage sensitivity to oxphos inhibition by the R+A treatment. While the R+A treatment had no significant effect on undamaged cells, cells treated with MMS or H2O2 became significantly more sensitive to the inhibitors (Figure 5A). This increased cytotoxicity was alleviated by PARP inhibition or PARP1 depletion, indicating that the cytotoxic effect of oxphos inhibition is PARP1-mediated (Figure 5, A–C). Furthermore, the increased damage sensitivity by oxphos inhibition can also be rescued by the addition of NAM or NMN (Figure 5B). The NAM rescue effect is blocked by the inhibitor of nicotinamide phosphoribosyltransferase (NAMPT), the rate-limiting enzyme for NAD+ synthesis from NAM in the salvage pathway, confirming that the NAM conversion to NAD+ is required for the rescue effect (Figure 5, B and D). As expected, NAMPT inhibition does not block the rescue effect of PARPi (Figure 5D). Importantly, similar results were obtained with laser damage strictly inflicted in the nucleus, demonstrating that DNA damage in the nucleus (and not in mitochondria) is sufficient to induce this response, which can be suppressed by NAM (Figure 5, E and F). Staining for PAR revealed that the amount of NAM used (1 mM) is not sufficient to inhibit PARylation at laser damage sites, further confirming that the rescue effect of NAM is not due to PARP inhibition (Supplemental Figure S6A). Taken together, oxphos inhibition in the presence of DNA damage leads to cell death triggered by PARP1-dependent NAD+ deprivation.
FIGURE 5:

Oxphos inhibition results in increased DNA damage sensitivity, which is alleviated by PARP inhibition or NAD replenishment. (A) Cells were either undamaged or treated with MMS or H2O2 and released from damage for 20 h in the presence of DMSO only, R+A (as in Figure 3A), or R+A with PARP inhibitor (Pi). In DMSO-treated cells, no significant cytotoxicity is observed while R+A treatment resulted in significant cell death (as detected by trypan blue) only in MMS- and H2O2-treated cells. This cytotoxicity is suppressed by PARP inhibitor treatment. Scale bar = 100 µm. Quantification of % surviving cells is shown on the right. N = 600. *p < 0.05, **p < 0.01, ****p < 0.0001. (B) Cytotoxic effect of R+A on MMS-treated cells (left) as in (A) is alleviated by PARPi, NAM, or NMN. Scale bar = 100 µm. Quantification of % surviving cells is shown on the right. N = 600. ****p < 0.0001. (C) The effect of control siRNA or PARP1-specific siRNA treatment in cells treated with MMS and R+A. Depletion of PARP1 (as shown in Western blot in Figure 2D) was sufficient to promote cell survival in MMS/R+A-treated cells. N = 600. Scale bar = 100 µm. ****p < 0.0001. (D) NAM effect is NAMPT-dependent. In the presence of NAMPT inhibitor, addition of NAM failed to suppress the cytotoxicity in MMS/R+A-treated cells. PARPi-treated cells are shown for comparison. Scale bar = 100 µm. Quantification of % surviving cells is shown on the right. N = 600. ****p < 0.0001. (E) Cytotoxic effect of R+A treatment in laser damage cells was suppressed by NAM or PARPi treatment. Scale bar = 20 µm. (F) Cell survival at 4 and 8 h after laser damage induction in cells treated with DMSO, R+A, R+A with PARPi, R+A with NAM. N = 50.
Cell death caused by respiratory inhibition of damaged cells is associated with the translocation of phosphatidylserine (PS; a marker for apoptosis), but is resistant to the caspase inhibitor, indicating that this is not a typical apoptosis (Figure 6A and Supplemental Figure S6B). Since this cell death is PARP-dependent (Figure 5, A–C), it is considered to be parthanatos. No clear AIF relocalization to the nucleus was observed with laser damage while some diffusion of AIF to the whole cell was observed with MMS (Supplemental Figure S6C). Thus, the observed cell death is parthanatos with variable AIF responses depending on the damaging agents. AIF-independent parthanatos was recently reported (Jang et al., 2017). Importantly, this is specifically associated with oxphos inhibition in conjunction with DNA damage as inhibition of glycolysis by 2-Deoxy-d-glucose (2DG) failed to show a similar damage-coupled cytotoxic effect (Figure 6A). This is possibly because the glycolysis pathway (and HK) is already significantly inhibited by PARP in response to damage, further confirming the significance of oxphos in damaged cell survival (Figure 5, B and C). The results indicate that the oxphos pathway becomes critical for cell survival in damaged cells specifically to antagonize NAD+ depletion by PARP activation.
FIGURE 6:

Caspase-independent, oxphos-specific cytotoxicity is cell type–dependent. (A) Damaged HeLa cells were more sensitive to oxphos inhibition (R+A) (as in Figure 3A) than glycolysis inhibition (2DG) and failed to be rescued by caspase inhibitor (Z-VAD-FMK). Cells were treated with DMSO, 25 mM 2DG, or R+A. With each treatment, cells were either undamaged or damaged with 3 mM MMS for 1 h and released from damage for 8 h in the presence of DMSO only (MMS), PARP inhibitor (MMS+PARPi), or Z-VAD-FMK (MMS+Z-VAD-FMK) as indicated. Cells were also treated with both R+A and 2DG in the absence of MMS but with DMSO, PARPi, or Z-VAD-FMK+PARPi (Pi). To confirm whether Z-VAD-FMK properly worked as a caspase inhibitor, cells were treated for 18 h with 10 µM actinomycin D (ActD) with either DMSO or Z-VAD-FMK. Quantification of % surviving cells is shown. N = 600. (B) Differential sensitivity of HFF-1, ARPE-19, and MCF-7 to oxphos inhibition (R+A) in 3 mM MMS-treated cells. Undamaged or 3 mM MMS damaged cells were treated with or without R+A and/or PARPi as indicated. For ARPE-19 cells, 7 mM MMS was also used as indicated. Quantification of % surviving cells is shown. N = 600. *p < 0.05, **p < 0.01, ***p < 0.001.
To determine whether the observed damage-induced sensitivity to oxphos inhibition is a HeLa cell–specific phenomenon, additional normal and cancer cell lines were examined (Figure 6B). Two normal human cells, HFF-1 primary foreskin fibroblasts and ARPE-19 retinal pigmented epithelial cells, showed significant resistance to 3 mM MMS and no increased sensitivity to oxphos inhibition (R+A treatment). Similar resistance to oxphos inhibition was observed with laser damage in HFF-1 cells (Supplemental Figure S7C). Increased concentration of MMS to 7 mM revealed similar tendency of R+A sensitivity, which was partially alleviated by PARP inhibition. In contrast, MCF7 human breast adenocarcinoma cells exhibited high sensitivity to 3 mM MMS unlike HeLa (Figure 6A) or two normal cells, which were further exacerbated by R+A (Figure 6B). Damage-induced R+A sensitivity was almost completely reversed by PARP inhibition. We also observed an increase of bound NADH fraction and a decrease of NADH concentration in response to high input power laser damage in HFF-1, ARPE-19, and MCF-7 cells but to a different extent, which were nevertheless all suppressed by PARP inhibition (Supplemental Figure S7, A, B, D, and E). Thus, PARP-dependent NADH responses and increased metabolic reliance on oxphos in response to DNA damage are not unique to HeLa cells, but there is a significant cell type variability.
NAM rescues damage-induced PARP-dependent ATP depletion, but not intracellular acidification, in oxphos-inhibited cells
The above results demonstrated that damaged cells are sensitized to oxphos inhibition and either PARP1 inhibition or replenishment of NAD+ can rescue them. To address the mechanism, we determined ATP dynamics. DNA damage signaling and repair processes were expected to increase ATP consumption, thus reducing the intracellular ATP level. ATP would also be consumed by the NAD+ salvage pathway and was also thought to be depleted as a result of PARP-mediated HK inhibition in glycolysis leading to cell death (Andrabi et al., 2014; Fouquerel et al., 2014). Using the FRET-based ATP sensors that are specifically targeted to the cytoplasm and nucleus (Imamura et al., 2009), we observed the rapid reduction of ATP in the first 20 min following laser damage, which persists over 6 h (Figure 7A). ATM and DNA-PK inhibitors had a subtle effect on the initial ATP decrease within the first 20 min in both the nucleus and the cytoplasm and partially reduced ATP consumption up to 6 h in the nucleus, but not in the cytoplasm (Figure 7A). This nuclear effect may reflect ATP consumption by DNA damage signaling and repair. In contrast, PARP inhibition completely suppressed ATP consumption in the cytoplasm and had a partial but major effect in the nucleus. The results indicate that ATP concentration in the whole cell is affected by the damage inflicted in the nucleus, and that the cytoplasmic ATP level is dictated by PARP activity.
FIGURE 7:

Analysis of cellular ATP and pHi dynamics following DNA damage induction using ATP and pH biosensors. (A) Monitoring of relative ATP levels of HeLa cells expressing cytoplasmic (top) or nuclear (bottom) localized ATeam FRET biosensor. Cells were treated with either 0.1% DMSO (left), 20 µM PARP inhibitor (olaparib) (middle), or 10 µM ATM inhibitor (KU55933) and 10 µM DNA-PK inhibitor (NU7026) (right). Average YFP/CFP intensity was normalized with undamaged control cells at each time point. N = 30. (B) Monitoring of relative cytoplasmic ATP levels of HeLa cells. Cells expressing cytoplasmic ATP sensor were cultured with medium containing with DMSO, PARPi or NAM at 1 h before damage induction. A total of 3 mM MMS was added at time –60 min and removed at 0 min. Averaged YFP/CFP ratio of cells was normalized with undamaged DMSO control cells at each time point. N = 15.
We next tested the effect of oxphos inhibition on the cytoplasmic ATP level in MMS-treated cells and how PARP inhibition or addition of NAM modulates this to see if ATP deprivation can explain the oxphos inhibition-induced cytotoxicity (Figure 7B). In undamaged cells, neither respiratory inhibition (R+A) nor PARPi nor the addition of NAM had any effect on the ATP level (Figure 7B, right “no MMS”). Cytoplasmic ATP is decreased in MMS-treated cells, which is reversed by PARPi or NAM (Figure 7B, left “MMS”). Notably, the combination of respiratory inhibition and MMS treatment resulted in significant decrease of ATP, which was also effectively alleviated by PARPi and NAM (Figure 7B, middle “MMS/R+A”). The results reveal the damage-specific role of oxphos in ATP replenishment and confirmed that PARP activation is the major cause of cytoplasmic ATP reduction in damaged cells (Figure 7B). The fact that the addition of NAM was sufficient to also restore the ATP level strongly suggests that NAD+ is central to the maintenance of intracellular ATP in damaged cells (Figure 7B). PARP was also shown to promote intracellular acidification, which was thought to promote cell death (Affar et al., 2002). This may possibly be due to proton production during the PARylation reaction. Thus, we also monitored intracellular pH (pHi) using the pHrodo indicator (see Materials and Methods). While we observed a slight, but significant change in pH by MMS treatment only, we found that oxphos inhibition led to severe acidification (Supplemental Figure S8). As expected, PARP inhibition reversed this phenomenon. Interestingly, however, NAM treatment had no significant effect on pHi, indicating that sensitivity to oxphos inhibition and intracellular acidification are separate phenomena induced by PARP (Supplemental Figure S8). Taken together, our results uncovered the novel PARP1-activated cell survival response to sustain the intracellular ATP level.
DISCUSSION
PARP1 action at damage sites promotes DNA repair, whereas its cell-wide hyperactivation depletes ATP and is thought to be cytotoxic. In the current study, however, we found that NAD+ consumption by PARP1 activation shifts the metabolic reliance to oxphos, which is critical for damaged cell survival, uncovering a novel prosurvival metabolic response to DNA damage regulated by PARP1 (Figure 8). PARP signaling locally dictates the chromatin structural organization and DNA repair pathway choice, which is rapid and transient (Figure 8, orange box) (Ball and Yokomori, 2011; Polo and Jackson, 2011; Altmeyer et al., 2015; Cruz et al., 2016; Kong et al., 2018). Indeed the PARP1 protein initially localizes at laser-damage sites but disappears within 2 h postdamage induction (Kim et al., 2005). In addition to the localized response at damage sites, our results demonstrate that NAD+ consumption by PARP1 alters both NADH concentration and the free to bound NADH ratio in both the nucleus and cytoplasm. The latter reflects the change of the metabolic reliance from glycolysis to oxphos (Figure 8, blue box). Our results demonstrate that this shift is important to compensate for the decrease of ATP caused by PARP1-dependent NAD+ deprivation (Figure 8, gray box) and to support cell survival (Figure 8, yellow box).
FIGURE 8:

Consequences of PARP1 activation critical for damaged cell survival. DNA damage complexity/dose-dependent PARP1 activation results in PARylation of target proteins and the decrease of NAD+ and ATP. PARylation at DNA damage sites dictates the recruitment of chromatin modifiers and DNA repair pathway choice and facilitates DNA repair. While PARylation also suppresses glycolysis through inhibition of HK, our results indicate that NAD+ consumption by PARylation also inhibits glycolysis. As a result, NAD+ consumption by PARP1 triggers an overall shift of metabolic reliance to oxphos. This contributes to the decrease of NADH. Importantly, in response to DNA damage and PARP1 activation, the oxphos pathway becomes critical for replenishment of ATP. Taken together, damage-induced PARP1 activation results in modulation of DNA repair and metabolic switch that together promote damaged cell survival.
The relationship between NADH and NAD+ in damaged cells
Intracellular concentration of NADH was previously used as a surrogate indicator for NAD+ consumption by PARP to assess the SSB repair capacity using a colorimetric assay of the media of a cell population (Nakamura et al., 2003; Yoshimura et al., 2006). Our results demonstrate that the phasor-FLIM approach is a powerful tool to follow the subcellular NADH dynamics in response to DNA damage in real time at a single cell level. Using this strategy, we confirmed that NADH depletion and the increase of the bound NADH was entirely dependent on PARP1 activity in damaged cells. Interestingly, respiratory chain inhibition also blocked the NADH reduction despite intact PARP activation, suggesting that NADH reduction in damaged cells is not simply a reflection of NAD+ consumption by PARP1, but indicative of mitochondrial complex activity (consistent with the observed increase of oxphos). We attempted to measure NAD+ directly in these cells using the recently developed NAD+ sensor (Cambronne et al., 2016) (Supplemental Figure S2C). However, we were unable to monitor NAD+ using this sensor in the respiratory chain inhibitor-treated cells because the sensor activity is skewed by acidic pHi (Supplemental Figure S8; unpublished data). The addition of NAD+ precursors in the salvage pathway abolished these changes without suppressing PARP activation, demonstrating that NADH reduction and the shift to the bound form is due to NAD+ consumption by PARP1, rather than by the effect of PARylation.
Transient and persistent increase of bound NADH by differential PARP activation
Our results clearly demonstrate that NADH depletion is transient even with the high input power damage induction. However, its duration and extent are damage dose–dependent with significant cell-to-cell variability in recovery. NADH concentration in the cytoplasm and nucleus are discordant, revealing that they are not regulated by concentration-driven diffusion alone. The shift from free to bound NADH fraction is also transient in a damage dose–dependent manner for lower input power damage. However, the shift becomes stabilized at high input power damage that induces complex damage and robust PARP activation (Cruz et al., 2016). Since this shift is entirely PARP-dependent, our results strongly suggest that there is a threshold PARP activation, above which the metabolic change becomes persistent. This is not associated with cell death under our conditions. Furthermore, there is no distinct correlation between NADH concentration recovery and persistence of bound NADH, suggesting that they are two distinct events.
The effects of PARylation and NAD+ depletion on metabolism
Our results indicate that NAD+ consumption by PARP1 is the major driver of the metabolic shift important for ATP replenishment and survival of the cell with DNA damage. Interestingly, PARP activation was previously shown to suppress glycolysis through PAR-mediated inhibition of the critical enzyme HKs resulting in energy depletion and parthanatos (Andrabi et al., 2014). In contrast to our current study, it was argued that PARylation, and not NAD+ consumption, drives this effect and suggested the major role of glycolysis in cell survival (Andrabi et al., 2014). This apparent discrepancy may be explained by how the NAD+ requirement was assessed in the two studies. In the study by Andrabi, NAD+ was reduced by FK866 (NAMPT inhibitor) that blocks the salvage pathway, but experiments were performed in the absence of DNA damage (without PARP activation) to show that NAD+ reduction alone does not affect ATP or glycolysis (Andrabi et al., 2014). Our analyses, however, were carried out in the presence of DNA damage, which increased the demand for NAD+ and ATP (due to PARP activation) relative to undamaged cells and rendered the damaged cells specifically sensitive to oxphos inhibition. It should be noted that in our Seahorse metabolic flux analyses, recovery of glycolysis by NMN was not as complete as PARPi, suggesting that both PARylation and NAD+ consumption contribute to the inhibition of glycolysis. Replenishment of NAD+, however, fully restored the balance between the two pathways, emphasizing the significance of NAD+ in the change of metabolic reliance. Importantly, inhibition of glycolysis by 2DG had no significant effect on damaged cell viability in contrast to the oxphos inhibition in our study. It is formally possible that the observation by Andrabi may be specific to MNNG, the only damaging agent they have tested (Andrabi et al., 2014). We have tested laser, MMS, and H2O2 and confirmed comparable effects. Metabolic responses may be sensitive to the differences in damaging agents as we also observed parthanatos with and without AIF relocalization by oxphos inhibition with MMS and laser damage, respectively.
Cell type variability of R+A sensitivity
Our results indicate that PARP-dependent increased metabolic reliance on oxphos in response to DNA damage is not unique to HeLa cells, but exhibits cell type–specific variability. Primary human fibroblasts (HFF-1) with high basal level oxphos were insensitive to the dose of respiratory inhibitors that effectively killed HeLa in our study. Thus, the basal respiratory activity may dictate the metabolic response to DNA damage. It was also reported that metabolic responses to NAD depletion are highly variable across different cell lines (Xiao et al., 2016). Furthermore, recent metabolomic profiling studies revealed complex changes of multiple metabolic pathways/components in response to DNA damage and PARP inhibition, which are highly variable across different cell lines (Bhute and Palecek, 2015; Bhute et al., 2016). In addition, we observed that two noncancer cells tested (HFF-1 and ARPE-19 cells) are relatively resistant to MMS. With a higher amount of MMS, PARP-dependent R+A-induced cytotoxicity was observed in ARPE-19 cells though the effect was not as drastic as HeLa or MCF-7 cells. Cell type–specific variability of metabolic reliance to oxphos, therefore, may be the result of a combination of multiple factors.
Although there are distinct metabolic changes associated with cancers, that is, high rates of aerobic glycolysis (‘‘Warburg effect’’), accumulating evidence indicates that oxphos remains critical for cancer cells (Vlashi et al., 2011; Zheng, 2012; Viale et al., 2014, 2015; Snyder et al., 2018). Many glycolytic cancer cells retain their ability for oxphos and exhibit metabolic flexibility to shift back to oxphos (“reverse Warburg effect”) to balance two pathways as needed (Robinson et al., 2012; Lee and Yoon, 2015). Subtypes of multiple cancers (e.g., breast, lung, and pancreatic cancers as well as melanoma) heavily rely on oxphos and are more sensitive to oxphos inhibitors (Ashton et al., 2018). Thus, our study provides one plausible mechanistic explanation as to why (cancer) cells need to utilize oxphos for survival. The combination of differential PARP1 signaling and basal and inducible oxphos capabilities may serve as a critical determinant for cell type–specific sensitivity to genotoxic stresses.
Conclusion
In summary, our results demonstrate that the phasor-FLIM method is effective in real time visualization of dynamic single cell metabolic changes in response to DNA damage. In conjunction with the use of laser microirradiation and fluorescence biosensors, the method was highly instrumental in uncovering the previously unrecognized long-term metabolic effect of NAD+ depletion by activated PARP1 and damage-specific role of oxphos to promote ATP production and cell survival. Our study provides an important paradigm for the mechanism of an inducible metabolic switch critical for cell survival against complex DNA damage.
MATERIALS AND METHODS
Cell culture
HeLa adenocarcinoma cells and MCF-7 cells were cultured in DMEM (Invitrogen, Carlsbad, CA) supplemented with 10% fetal bovine serum (FBS), 2 mM l-glutamate, and 1% penicillin-streptomycin. HeLa cells were tested and shown to be free of mycoplasma contamination. HFF-1 human foreskin fibroblast cells were cultured in DMEM (ATCC 30-2002) supplemented with 15% FBS and 1% penicillin-streptomycin. ARPE-19 cells were cultured in MEM:F12 (ATCC 30-2006) supplemented with 10% FBS and 1% penicillin-streptomycin.
Chemical treatment
Cells were treated with 1, 2, or 3 mM MMS (Sigma, 129925) for 1 h or 500 µM H2O2 (Ricca Chemical, 381916) for 30 min. Metabolic and cytotoxic analyses were performed at indicated time points after MMS or H2O2 release. Cells were treated for 1 h before damage induction with PARPi (100 µM NU1025 [Sigma, N7287] or 20 µM olaparib [Apexbio Technology, A4154]) in 0.1% DMSO (Sigma, D2650), or ATM inhibitor and DNA-PK inhibitor (10 µM KU55933 [Millipore, 118500] and 10 µM NU7026 [Sigma, N1537], respectively) in 0.2% DMSO. The effects of these inhibitors have been confirmed by the suppression of target protein modifications under our conditions (Cruz et al., 2016). For respiration inhibition, cells were treated for 1 h before damage induction with the mitochondrial complex I inhibitor rotenone (Sigma, R8875) (1 µM for laser damage and 0.25 µM for MMS or H2O2-induced damage) and complex III inhibitor antimycin A (Sigma, A8672) (1 µM for laser damage and 0.25 µM for MMS or H2O2-induced damage) in 0.2% DMSO. For glycolysis inhibition, 25 mM 2DG (Sigma, D6134) was added into cell media 1 h before damage induction. For NAM treatment, cells were treated 1 h before damage induction with 1 mM NAM (Sigma, 72340). For NAMPT inhibition, cells were treated with 10 nM FK866 (Sigma, F8557) for 6 h before damage induction. For NMN treatment, 1 mM NMN (Sigma, N3501) was added to the cell culture media 8–10 h before damage induction. For caspase inhibition, cells were treated with 50 µM Z-VAD-FMK. For actinomycin D–induced apoptosis, cells were treated for 18 h with 10 µM actinomycin D.
Immunofluorescence staining (IFA)
IFA was performed essentially as described previously (Kim et al., 2005). Antibodies used are mouse monoclonal antibodies specific for γH2AX (Millipore, 05-636), PAR polymers (Enzo Life Sciences, BML-SA216-0100), Mre11 (Gene Tex, GTX70212), actin (Sigma, A4700), or cyclobutane pyrimidine dimer (Kamiya Biomedical, MC-062,) as well as rabbit polyclonal antibodies specific for AIF antibody (Gene Tex, GTX113306). Affinity-purified rabbit anti-PARP1 antibody was previously described (Heale et al., 2006; Cruz et al., 2016).
Confocal fluorescence microscope
All fluorescence experiments were performed on an inverted confocal Zeiss LSM710 (Carl Zeiss, Jena, Germany). A 40 × 1.2NA water-immersion objective (Zeiss, Korr C-Apochromat) was used. Brightfield images were acquired using a CCD camera (Olympus, FVII) coupled to an Olympus IX81 with a 100× objective (UPlanFI, oil Ph3, NA 1.3).
NIR laser microirradiation
A pulsed titanium-sapphire 100-fs laser (Spectra-Physics, Santa Clara, CA) at 80 MHz tuned for 780 nm two-photon microirradiation was used at the input power of 17.7, 19.9, and 24.6 mW measured after the objective for low, medium, and high damage conditions, respectively. Image sizes of 512 × 512 pixels were obtained with defined regions of 45 × 5 pixels for microirradiation. Microirradiated regions were scanned once with a scan speed of 12.61 µs/pixel for damage induction.
Phasor approach to FLIM and NADH intensity/concentration measurement
Following DNA damage induction, either by laser microirradiation or by chemical agents (MMS or H2O2), 40 frames of FLIM data were acquired with 740 nm two-photon excitation at ∼2 mW by an ISS A320 FastFLIM box (ISS, Champaign, IL) with image sizes of 256 × 256 pixels and a scan speed of 25.21 µs/pixel. Fluorescence excitation signal was separated with a dichroic filter (690 nm) and fluorescence was detected by photomultiplier tubes (H7422P-40, Hamamatsu, Japan) with a blue emission filter (495LP) of 420–500 nm to capture NADH autofluorescence. FLIM data were transformed into pixels on the phasor plot using the SimFCS software developed at the Laboratory for Fluorescence Dynamics, University of California, Irvine, as described previously (Digman et al., 2008). Coumarin-6, which has a known single exponential lifetime of 2.5 ns, was used as a reference for the instrument response time. Nuclear and cytoplasmic compartments were analyzed separately based on the intensity of NADH signal as previously reported (Wright et al., 2012). The concentration of NADH was calculated by calibrating with a known concentration of free NADH and correcting for the difference in quantum yield between the free and bound forms of NADH as described previously (Ma et al., 2016). Because the emission spectra, extinction coefficient, and quantum yield of NADH overlay that of NADPH, these fluorophores are often designated together as NAD(P)H in fluorescence-based investigations (Patterson et al., 2000; Huang et al., 2002). Intracellular levels of NAD, however, have been reported to be significantly greater than those of NADP and so changes in the fluorescence lifetime measurements herein are presumed to reflect changes in NADH (Klaidman et al., 1995; Pollak et al., 2007; Ying, 2008). The ratio of the photons emitted by the free and protein-bound states of NADH to total photons absorbed, known as the quantum yield, depends on the binding substrate. The protein-bound forms of NADH have a much greater quantum yield than the free form due to a decreased probability of nonradiative decay of an excited molecule while the radiative emitting pathway is largely unaffected (Scott et al., 1970; Vishwasrao et al., 2005). Thus, it is possible that typical calibrating procedures comparing intensities of known concentrations of the fluorophore to those measured in the cell may overestimate the bound NADH species. Thus, the changes of intensity and concentration of NADH were compared with confirm that they follow similar kinetics in response to DNA damage.
NAD+ measurement
The HeLa cell lines stably expressing either the cytoplasm- or the mitochondria-targeted NAD+ sensor or the corresponding cpVenus controls were kindly provided by Xiaolu Cambronne (Oregon Health and Science University) (Cambronne et al., 2016). Cells were plated on a glass-bottomed imaging dish and were incubated at 37°C for ∼40 h until they reached 60–80% confluency. Live cell images were captured before and 1 h after indicated treatment. The fluorescence ratios (488/405 nm) were measured and analyzed as previously described (Cambronne et al., 2016).
ATP measurement
HeLa cells were transfected using Lipofectamine 3000 (Invitrogen) with either AT1.03 (cytoplasm-localized) or Nuc AT1.03 (nucleus-localized) plasmids (Kioka et al., 2014). After 18–24 h, cells were subjected to laser microirradiation or MMS treatment in the presence of DMSO or indicated inhibitors, and the YFP/CFP fluorescence ratios were measured as previously described (Imamura et al., 2009).
Intracellular pH (pHi) measurement
Changes in pHi were measured using the commercial pHrodo Green AM Intracellular pH Indicator kit (ThermoFisher, P35373) according to the manufacturer’s instructions.
Agilent seahorse metabolic flux analyzer
HeLa cells were plated in a 24-well Seahorse XF-24 assay plate at 1 × 10⁵ cells/well and grown for ∼20 h. DMSO, PARP inhibitor, or NMN was added to the media before damage induction. Cells were then incubated with MMS for 1 h. At 1 or 2 h after release from MMS treatment, metabolic flux analysis was performed using an Agilent Seahorse XF24 Extracellular Flux Analyzer following the manufacturer’s protocol and normalized by the cell numbers as described previously (Chen et al., 2015). Briefly, cells were first washed once with unbuffered, serum-free DMEM (1 g/l glucose [pH 7.2]) and incubated with unbuffered media at 37°C in a non-CO2 incubator for 1 h before load onto the analyzer. Three baseline measurements of OCR and ECAR were taken before sequential injection of the following mitochondrial inhibitors (final concentration): oligomycin (1 μg/ml), carbonyl cyanide 4-(trifluoromethoxy)phenylhydrazone (FCCP) (0.3 μM), and rotenone (0.1 μM). Three measurements were taken after the addition of each inhibitor. OCR, ECAR, and OCR/ECAR values were automatically calculated and recorded by the Seahorse XF24 software. The basal respiration was calculated by averaging the three measurements of OCR before injecting the inhibitors. The maximum respiration capacity was calculated by using the OCR measurement after the addition of FCCP. The maximum glycolytic capacity was calculated by the ECAR measurement after oligomycin addition.
Detection of senescence, apoptosis, and necrosis and assessment of cytotoxicity
Cellular senescence was determined by β-gal staining as described previously (Gey and Seeger, 2013). Apoptosis/necrosis was detected using the commercial kit (AB176749; Abcam, Cambridge, England) following the manufacturer’s instructions. The Apoptosis/Necrosis Detection Kit is designed to simultaneously monitor apoptotic, necrotic, and healthy cells with a flow cytometer or fluorescence microscope. In apoptotic cells, PS is transferred to the outer side of the plasma membrane and can be detected by its sensor, Apopxin Green (green fluorescence). The 7-aminoactinomycin D (red fluorescence), a membrane impermeable dye, will label the nucleus of damaged cells, including both late apoptotic and necrotic cells. Live cells can be detected as blue fluorescence by CytoCalcein Violet 450 staining. Cytotoxicity was also examined by propidium iodide permeability assay. After damage induction and inhibitor treatment, propidium iodide and Hoechst 33342 were added into the medium to achieve final concentrations of 0.8 and 0.5 µg/ml, respectively. The cells were then incubated at 37°C for 5–15 min and visualized for the total cells (blue, Hoechst 33342) and dead cells (red, propidium iodide) under a fluorescence microscope.
Statistical analysis
Experiments were replicated at least three times and the number of cells examined for each damage condition was as indicated. Statistical significance was determined using the two-tailed Student’s t test where *p < 0.05, **p < 0.01, and ***p < 0.001 unless otherwise indicated. Error bars indicate the SD from the mean.
Supplementary Material
Acknowledgments
The HeLa cell lines stably expressing the compartmentalized NAD+ biosensors were kindly provided by Xiaolu Cambronne at the Vollum Institute at the Oregon Health and Science University. This work was supported by grants from National Institutes of Health (NIH) P41-GM103540 (M.A.D.); National Science Foundation MCB-1615701 (K.Y. and M.A.D.); UCI Academic Senate Council on Research, Computing & Library (CORCL) (K.Y. and M.A.D.); the Cancer Research Coordinating Committee (CRCC) (K.Y.); the Air Force (AFOSR Grant # FA9550-08-1-0384) (M.W.B.); the Hoag Family Foundation, Huntington Beach, CA (M.W.B.); the David and Lucille Packard Foundation, Los Altos, CA (M.W.B.); National Heart, Lung, and Blood Institute R01 HL096987 (P.W.); and the Fatima Foundation (P.W.). The authors also acknowledge the support of the Chao Family Comprehensive Cancer Center Optical Biology Core (LAMMP/OBC) Shared Resource supported by the National Cancer Institute of the NIH under award number P30CA062203. The content is solely the responsibility of the authors and does not necessarily represent the official views of the NIH.
Abbreviations used:
- AIF
apoptosis-inducing factor
- 2DG
2-deoxy- d-glucose
- DSB
double-strand break
- ECAR
extracellular acidification rate
- FBS
fetal bovine serum
- FCCP
carbonyl cyanide-4-(trifluoromethoxy)phenylhydrazone
- FLIM
fluorescence lifetime imaging microscopy
- HK
hexokinase
- NAM
nicotinamide
- NAMPT
nicotinamide phosphoribosyltransferase
- NIR
near infrared
- NMN
nicotinamide mononucleotide
- OCR
oxygen consumption rate
- oxphos
oxidative phosphorylation
- PAR
poly(ADP-ribose)
- PARP
poly(ADP-ribose) polymerase
- PARPi
PARP inhibitor
- PARP1
poly(ADP-ribose) polymerase 1
- pHi
intracellular pH
- R+A
rotenone and antimycin A
- SSB
single-strand break.
Footnotes
This article was published online ahead of print in MBoC in Press (http://www.molbiolcell.org/cgi/doi/10.1091/mbc.E18-10-0650) on August 7, 2019.
REFERENCES
- Affar EB, Shah RG, Dallaire AK, Castonguay V, Shah GM. (2002). Role of poly(ADP-ribose) polymerase in rapid intracellular acidification induced by alkylating DNA damage. Proc Natl Acad Sci USA , 245–250. [DOI] [PMC free article] [PubMed] [Google Scholar]
- Ahel D, Horejsí Z, Wiechens N, Polo SE, Garcia-Wilson E, Ahel I, Flynn H, Skehel M, West SC, Jackson SP, et al (2009). Poly(ADP-ribose)-dependent regulation of DNA repair by the chromatin remodeling enzyme ALC1. Science , 1240–1243. [DOI] [PMC free article] [PubMed] [Google Scholar]
- Altmeyer M, Neelsen KJ, Teloni F, Pozdnyakova I, Pellegrino S, Grøfte M, Rask MB, Streicher W, Jungmichel S, Nielsen ML, Lukas J. (2015). Liquid demixing of intrinsically disordered proteins is seeded by poly(ADP-ribose). Nat Commun , 8088. [DOI] [PMC free article] [PubMed] [Google Scholar]
- Andrabi SA, Dawson TM, Dawson VL. (2008). Mitochondrial and nuclear cross talk in cell death: parthanatos. Ann NY Acad Sci , 233–241. [DOI] [PMC free article] [PubMed] [Google Scholar]
- Andrabi SA, Umanah GK, Chang C, Stevens DA, Karuppagounder SS, Gagné JP, Poirier GG, Dawson VL, Dawson TM. (2014). Poly(ADP-ribose) polymerase-dependent energy depletion occurs through inhibition of glycolysis. Proc Natl Acad Sci USA , 10209–10214. [DOI] [PMC free article] [PubMed] [Google Scholar]
- Ashton TM, McKenna WG, Kunz-Schughart LA, Higgins GS. (2018). Oxidative phosphorylation as an emerging target in cancer therapy. Clin Cancer Res , 2482–2490. [DOI] [PubMed] [Google Scholar]
- Ayrapetov MK, Gursoy-Yuzugullu O, Xu C, Xu Y, Price BD. (2014). DNA double-strand breaks promote methylation of histone H3 on lysine 9 and transient formation of repressive chromatin. Proc Natl Acad Sci USA , 9169–9174. [DOI] [PMC free article] [PubMed] [Google Scholar]
- Ball AR, Jr, Yokomori K. (2011). Damage site chromatin: open or closed? Curr Opin Cell Biol , 277–283. [DOI] [PMC free article] [PubMed] [Google Scholar]
- Bhute VJ, Ma Y, Bao X, Palecek SP. (2016). The poly (ADP-ribose) polymerase inhibitor veliparib and radiation cause significant cell line dependent metabolic changes in breast cancer cells. Sci Rep , 36061. [DOI] [PMC free article] [PubMed] [Google Scholar]
- Bhute VJ, Palecek SP. (2015). Metabolic responses induced by DNA damage and poly (ADP-ribose) polymerase (PARP) inhibition in MCF-7 cells. Metabolomics , 1779–1791. [DOI] [PMC free article] [PubMed] [Google Scholar]
- Bouwman P, Aly A, Escandell JM, Pieterse M, Bartkova J, van der Gulden H, Hiddingh S, Thanasoula M, Kulkarni A, Yang Q, et al (2010). 53BP1 loss rescues BRCA1 deficiency and is associated with triple-negative and BRCA-mutated breast cancers. Nat Struc Mol Biol , 688–695. [DOI] [PMC free article] [PubMed] [Google Scholar]
- Burma S, Chen BP, Murphy M, Kurimasa A, Chen DJ. (2001). ATM phosphorylates histone H2AX in response to DNA double-strand breaks. J Biol Chem , 42462–42467. [DOI] [PubMed] [Google Scholar]
- Cambronne XA, Stewart ML, Kim D, Jones-Brunette AM, Morgan RK, Farrens DL, Cohen MS, Goodman RH. (2016). Biosensor reveals multiple sources for mitochondrial NAD⁺. Science , 1474–1477. [DOI] [PMC free article] [PubMed] [Google Scholar]
- Chen Y, Chernyavsky A, Webber RJ, Grando SA, Wang PH. (2015). Critical role of the neonatal Fc receptor (FcRn) in the pathogenic action of antimitochondrial autoantibodies synergizing with anti-desmoglein autoantibodies in pemphigus vulgaris. J Biol Chem , 23826–23837. [DOI] [PMC free article] [PubMed] [Google Scholar]
- Chou DM, Adamson B, Dephoure NE, Tan X, Nottke AC, Hurov KE, Gygi SP, Colaiácovo MP, Elledge SJ. (2010). A chromatin localization screen reveals poly (ADP ribose)-regulated recruitment of the repressive polycomb and NuRD complexes to sites of DNA damage. Proc Natl Acad Sci USA , 18475–18480. [DOI] [PMC free article] [PubMed] [Google Scholar]
- Cruz GMS, Kong X, Silva BA, Khatibzadeh N, Thai R, Berns MW, Yokomori K. (2016). Femtosecond near-infrared laser microirradiation reveals a crucial role for PARP signaling on factor assemblies at DNA damage sites. Nucleic Acids Res , e27. [DOI] [PMC free article] [PubMed] [Google Scholar]
- Digman MA, Caiolfa VR, Zamai M, Gratton E. (2008). The phasor approach to fluorescence lifetime imaging analysis. Biophys J , L14–L16. [DOI] [PMC free article] [PubMed] [Google Scholar]
- Fatokun AA, Dawson VL, Dawson TM. (2014). Parthnatos: mitochondrial-linked mechanisms and therapeutic opportunities. Br J Pharmacol , 2000–2016. [DOI] [PMC free article] [PubMed] [Google Scholar]
- Feng FY, de Bono JS, Rubin MA, Knudsen KE. (2015). Chromatin to clinic: the molecular rationale for PARP1 inhibitor function. Mol Cell , 925–934. [DOI] [PMC free article] [PubMed] [Google Scholar]
- Fouquerel E, Goellner EM, Yu Z, Gagné JP, Barbi de Moura M, Feinstein T, Wheeler D, Redpath P, Li J, Romero G, et al (2014). ARTD1/PARP1 negatively regulates glycolysis by inhibiting hexokinase 1 independent of NAD+ depletion. Cell Rep , 1819–1831. [DOI] [PMC free article] [PubMed] [Google Scholar]
- Georgakoudi I, Quinn KP. (2012). Optical imaging using endogenous contrast to assess metabolic state. Annu Rev Biomed Eng , 351–367. [DOI] [PubMed] [Google Scholar]
- Gey C, Seeger K. (2013). Metabolic changes during cellular senescence investigated by proton NMR-spectroscopy. Mech Ageing Dev , 130–138. [DOI] [PubMed] [Google Scholar]
- Gomez-Godinez V, Wu T, Sherman AJ, Lee CS, Liaw LH, Zhongsheng Y, Yokomori K, Berns MW. (2010). Analysis of DNA double-strand break response and chromatin structure in mitosis using laser microirradiation. Nucleic Acids Res , e202. [DOI] [PMC free article] [PubMed] [Google Scholar]
- Gottschalk AJ, Timinszky G, Kong SE, Jin J, Cai Y, Swanson SK, Washburn MP, Florens L, Ladurner AG, Conaway JW, Conaway RC. (2009). Poly(ADP-ribosyl)ation directs recruitment and activation of an ATP-dependent chromatin remodeler. Proc Natl Acad Sci USA , 13770–13774. [DOI] [PMC free article] [PubMed] [Google Scholar]
- Gupte R, Liu Z, Kraus WL. (2017). PARPs and ADP-ribosylation: recent advances linking molecular functions to biological outcomes. Genes Dev , 101–126. [DOI] [PMC free article] [PubMed] [Google Scholar]
- Heale JT, Ball AR, Jr, Schmiesing JA, Kim JS, Kong X, Zhou S, Hudson D, Earnshaw WC, Yokomori K. (2006). Condensin I interacts with the PARP-1-XRCC1 complex and functions in DNA single-stranded break repair. Mol Cell , 837–848. [DOI] [PMC free article] [PubMed] [Google Scholar]
- Heikal AA. (2010). Intracellular coenzymes as natural biomarkers for metabolic activities and mitochondrial anomalies. Biomark Med , 241–263. [DOI] [PMC free article] [PubMed] [Google Scholar]
- Huang S, Heikal AA, Webb WW. (2002). Two-photon fluorescence spectroscopy and microscopy of NAD(P)H and flavoprotein. Biophys J , 2811–2825. [DOI] [PMC free article] [PubMed] [Google Scholar]
- Imamura H, Nhat KP, Togawa H, Saito K, Iino R, Kato-Yamada Y, Nagai T, Noji H. (2009). Visualization of ATP levels inside single living cells with fluorescence resonance energy transfer-based genetically encoded indicators. Proc Natl Acad Sci USA , 15651–15656. [DOI] [PMC free article] [PubMed] [Google Scholar]
- Izhar L, Adamson B, Ciccia A, Lewis J, Pontano-Vaites L, Leng Y, Liang AC, Westbrook TF, Harper JW, Elledge SJ. (2015). A systematic analysis of factors localized to damaged chromatin reveals PARP-dependent recruitment of transcription factors. Cell Rep , 1486–1500. [DOI] [PMC free article] [PubMed] [Google Scholar]
- Jang KH, Do YJ, Son D, Son E, Choi JS, Kim E. (2017). AIF-independent parthanatos in the pathogenesis of dry age-related macular degeneration. Cell Death Dis , e2526. [DOI] [PMC free article] [PubMed] [Google Scholar]
- Jaspers JE, Kersbergen A, Boon U, Sol W, van Deemter L, Zander SA, Drost R, Wientjens E, Ji J, Aly A, et al (2013). Loss of 53BP1 causes PARP inhibitor resistance in Brca1-mutated mouse mammary tumors. Cancer Discov , 68–81. [DOI] [PMC free article] [PubMed] [Google Scholar]
- Khoury-Haddad H, Guttmann-Raviv N, Ipenberg I, Huggins D, Jeyasekharan AD, Ayoub N. (2014). PARP1-dependent recruitment of KDM4D histone demethylase to DNA damage sites promotes double-strand break repair. Proc Natl Acad Sci USA , E728–E737. [DOI] [PMC free article] [PubMed] [Google Scholar]
- Kim J-S, Krasieva TB, Kurumizaka H, Chen DJ, Taylor AM, Yokomori K. (2005). Independent and sequential recruitment of NHEJ and HR factors to DNA damage sites in mammalian cells. J Cell Biol , 341–347. [DOI] [PMC free article] [PubMed] [Google Scholar]
- Kioka H, Kato H, Fujikawa M, Tsukamoto O, Suzuki T, Imamura H, Nakano A, Higo S, Yamazaki S, Matsuzaki T, et al (2014). Evaluation of intramitochondrial ATP levels identifies G0/G1 switch gene 2 as a positive regulator of oxidative phosphorylation. Proc Natl Acad Sci USA , 273–278. [DOI] [PMC free article] [PubMed] [Google Scholar]
- Klaidman LK, Leung AC, Adams JD., Jr (1995). High-performance liquid chromatography analysis of oxidized and reduced pyridine dinucleotides in specific brain regions. Anal Biochem , 312–317. [DOI] [PubMed] [Google Scholar]
- Kong X, Cruz GS, Trinh S, Zhu X-D, Berns M, Yokomori K. (2018). Biphasic recruitment of TRF2 to DNA damage sites promotes non-sister chromatid homologous recombination repair. J Cell Sci , jcs219311. [DOI] [PMC free article] [PubMed] [Google Scholar]
- Kong X, Mohanty SK, Stephens J, Heale JT, Gomez-Godinez V, Shi LZ, Kim JS, Yokomori K, Berns MW. (2009). Comparative analysis of different laser systems to study cellular responses to DNA damage in mammalian cells. Nucleic Acids Res , e68. [DOI] [PMC free article] [PubMed] [Google Scholar]
- Kong X, Stephens J, Ball AR, Jr, Heale JT, Newkirk DA, Berns MW, Yokomori K. (2011). Condensin I recruitment to base damage-enriched DNA lesions is modulated by PARP1. PLoS One , e23548. [DOI] [PMC free article] [PubMed] [Google Scholar]
- Larsen DH, Poinsignon C, Gudjonsson T, Dinant C, Payne MR, Hari FJ, Danielsen JM, Menard P, Sand JC, Stucki M, et al (2010). The chromatin-remodeling factor CHD4 coordinates signaling and repair after DNA damage. J Cell Biol , 731–740. [DOI] [PMC free article] [PubMed] [Google Scholar]
- Lee M, Yoon JH. (2015). Metabolic interplay between glycolysis and mitochondrial oxidation: The reverse Warburg effect and its therapeutic implication. World J Biol Chem , 148–161. [DOI] [PMC free article] [PubMed] [Google Scholar]
- Ma N, Digman MA, Malacrida L, Gratton E. (2016). Measurements of absolute concentrations of NADH in cells using the phasor FLIM method. Biomed Opt Express , 2441–2452. [DOI] [PMC free article] [PubMed] [Google Scholar]
- Meyer B, Voss KO, Tobias F, Jakob B, Durante M, Taucher-Scholz G. (2013). Clustered DNA damage induces pan-nuclear H2AX phosphorylation mediated by ATM and DNA-PK. Nucleic Acids Res , 6109–6118. [DOI] [PMC free article] [PubMed] [Google Scholar]
- Nakamura J, Asakura S, Hester SD, de Murcia G, Caldecott KW, Swenberg JA. (2003). Quantitation of intracellular NAD(P)H can monitor an imbalance of DNA single strand break repair in base excision repair deficient cells in real time. Nucleic Acids Res , e104. [DOI] [PMC free article] [PubMed] [Google Scholar]
- Patterson GH, Knobel SM, Arkhammar P, Thastrup O, Piston DW. (2000). Separation of the glucose-stimulated cytoplasmic and mitochondrial NAD(P)H responses in pancreatic islet beta cells. Proc Natl Acad Sci USA , 5203–5207. [DOI] [PMC free article] [PubMed] [Google Scholar]
- Pollak N, Dölle C, Ziegler M. (2007). The power to reduce: pyridine nucleotides–small molecules with a multitude of functions. Biochem J , 205–218. [DOI] [PMC free article] [PubMed] [Google Scholar]
- Polo SE, Jackson SP. (2011). Dynamics of DNA damage response proteins at DNA breaks: a focus on protein modifications. Genes Dev , 409–433. [DOI] [PMC free article] [PubMed] [Google Scholar]
- Polo SE, Kaidi A, Baskcomb L, Galanty Y, Jackson SP. (2010). Regulation of DNA-damage responses and cell-cycle progression by the chromatin remodelling factor CHD4. EMBO J , 3130–3139. [DOI] [PMC free article] [PubMed] [Google Scholar]
- Robinson GL, Dinsdale D, Macfarlane M, Cain K. (2012). Switching from aerobic glycolysis to oxidative phosphorylation modulates the sensitivity of mantle cell lymphoma cells to TRAIL. Oncogene , 4996–5006. [DOI] [PubMed] [Google Scholar]
- Schneckenburger H, Wagner M, Weber P, Strauss WS, Sailer R. (2004). Autofluorescence lifetime imaging of cultivated cells using a UV picosecond laser diode. J Fluoresc , 649–654. [DOI] [PubMed] [Google Scholar]
- Scott TG, Spencer RD, Leonard NJ, Weber G. (1970). Synthetic spectroscopic models related to coenzymes and base pairs. V. Emission properties of NADH. Studies of fluorescence lifetimes and quantum efficiencies of NADH, AcPyADH, [reduced acetylpyridineadenine dinucleotide] and simplified synthetic models. J Am Chem Soc , 687–695. [Google Scholar]
- Shiloh Y. (2003). ATM and related protein kinases: safeguarding genome integrity. Nat Rev Cancer , 155–168. [DOI] [PubMed] [Google Scholar]
- Silva BA, Stambaugh JR, Yokomori K, Shah JV, Berns MW. (2014). DNA damage to a single chromosome end delays anaphase onset. J Biol Chem , 22771–22784. [DOI] [PMC free article] [PubMed] [Google Scholar]
- Skala M, Ramanujam N. (2010). Multiphoton redox ratio imaging for metabolic monitoring in vivo. Methods Mol Biol , 155–162. [DOI] [PMC free article] [PubMed] [Google Scholar]
- Skala MC, Riching KM, Bird DK, Gendron-Fitzpatrick A, Eickhoff J, Eliceiri KW, Keely PJ, Ramanujam N. (2007a). In vivo multiphoton fluorescence lifetime imaging of protein-bound and free nicotinamide adenine dinucleotide in normal and precancerous epithelia. J Biomed Opt , 024014. [DOI] [PMC free article] [PubMed] [Google Scholar]
- Skala MC, Riching KM, Gendron-Fitzpatrick A, Eickhoff J, Eliceiri KW, White JG, Ramanujam N. (2007b). In vivo multiphoton microscopy of NADH and FAD redox states, fluorescence lifetimes, and cellular morphology in precancerous epithelia. Proc Natl Acad Sci USA , 19494–19499. [DOI] [PMC free article] [PubMed] [Google Scholar]
- Smeenk G, Wiegant WW, Vrolijk H, Solari AP, Pastink A, van Attikum H. (2010). The NuRD chromatin-remodeling complex regulates signaling and repair of DNA damage. J Cell Biol , 741–749. [DOI] [PMC free article] [PubMed] [Google Scholar]
- Snyder V, Reed-Newman TC, Arnold L, Thomas SM, Anant S. (2018). Cancer stem cell metabolism and potential therapeutic targets. Front Oncol , 203. [DOI] [PMC free article] [PubMed] [Google Scholar]
- Stringari C, Edwards RA, Pate KT, Waterman ML, Donovan PJ, Gratton E. (2012a). Metabolic trajectory of cellular differentiation in small intestine by Phasor Fluorescence Lifetime Microscopy of NADH. Sci Rep , 568. [DOI] [PMC free article] [PubMed] [Google Scholar]
- Stringari C, Sierra R, Donovan PJ, Gratton E. (2012b). Label-free separation of human embryonic stem cells and their differentiating progenies by phasor fluorescence lifetime microscopy. J Biomed Opt , 046012. [DOI] [PMC free article] [PubMed] [Google Scholar]
- Sun Y, Jiang X, Xu Y, Ayrapetov MK, Moreau LA, Whetstine JR, Price BD. (2009). Histone H3 methylation links DNA damage detection to activation of the tumour suppressor Tip60. Nat Cell Biol , 1376–1382. [DOI] [PMC free article] [PubMed] [Google Scholar]
- Viale A, Corti D, Draetta GF. (2015). Tumors and mitochondrial respiration: a neglected connection. Cancer Res , 3685–3686. [DOI] [PubMed] [Google Scholar]
- Viale A, Pettazzoni P, Lyssiotis CA, Ying H, Sánchez N, Marchesini M, Carugo A, Green T, Seth S, Giuliani V, et al (2014). Oncogene ablation-resistant pancreatic cancer cells depend on mitochondrial function. Nature , 628–632. [DOI] [PMC free article] [PubMed] [Google Scholar]
- Vishwasrao HD, Heikal AA, Kasischke KA, Webb WW. (2005). Conformational dependence of intracellular NADH on metabolic state revealed by associated fluorescence anisotropy. J Biol Chem , 25119–25126. [DOI] [PubMed] [Google Scholar]
- Vlashi E, Lagadec C, Vergnes L, Matsutani T, Masui K, Poulou M, Popescu R, Della Donna L, Evers P, Dekmezian C, et al (2011). Metabolic state of glioma stem cells and nontumorigenic cells. Proc Natl Acad Sci USA , 16062–16067. [DOI] [PMC free article] [PubMed] [Google Scholar]
- Wright BK, Andrews LM, Markham J, Jones MR, Stringari C, Digman MA, Gratton E. (2012). NADH distribution in live progenitor stem cells by phasor-fluorescence lifetime image microscopy. Biophys J , L7–L9. [DOI] [PMC free article] [PubMed] [Google Scholar]
- Xiao Y, Kwong M, Daemen A, Belvin M, Liang X, Hatzivassiliou G, O’Brien T. (2016). Metabolic response to NAD depletion across cell lines is highly variable. PLoS One , e0164166. [DOI] [PMC free article] [PubMed] [Google Scholar]
- Ying W. (2008). NAD+/NADH and NADP+/NADPH in cellular functions and cell death: regulation and biological consequences. Antioxid Redox Signal , 179–206. [DOI] [PubMed] [Google Scholar]
- Yoshimura M, Kohzaki M, Nakamura J, Asagoshi K, Sonoda E, Hou E, Prasad R, Wilson SH, Tano K, Yasui A, et al (2006). Vertebrate POLQ and POLbeta cooperate in base excision repair of oxidative DNA damage. Mol Cell , 115–125. [DOI] [PMC free article] [PubMed] [Google Scholar]
- Zheng J. (2012). Energy metabolism of cancer: glycolysis versus oxidative phosphorylation (review). Oncol Lett , 1151–1157. [DOI] [PMC free article] [PubMed] [Google Scholar]
Associated Data
This section collects any data citations, data availability statements, or supplementary materials included in this article.