

Abstract
Weak electric fields modulate neuronal activity, and knowledge of the interaction threshold is important in the understanding of neuronal synchronization, in neural prosthetic design, and in the public health assessment of environmental extremely low frequency fields. Previous experimental measurements have placed the threshold between 1 and 5 mV/mm, although theory predicts that elongated neurons should have submillivolt per millimeter sensitivity near 100 μV/mm. We here provide the first experimental confirmation that neuronal networks are detectably sensitive to submillivolt per millimeter electrical fields [Gaussian pulses 26 msec full width at half-maximal, 140 μV/mm root mean square (rms), 295 μV/mm peak amplitude], an order of magnitude below previous findings, and further demonstrate that these networks are more sensitive than the average single neuron threshold (185 μV/mm rms, 394 μV/mm peak amplitude) to field modulation.
Keywords: electric field, neuron, threshold, synchrony, ephaptic, hippocampus
Introduction
Weak electric fields modulate neuronal activity (Jefferys, 1995), and knowledge of the interaction threshold is important in the understanding of neuronal synchronization, in neural prosthetic design, and in the public health assessment of environmental extremely low frequency (ELF) fields.
Previous experimental measurements have placed the threshold for neuronal interaction with electric fields between 1 and 5 mV/mm (field strength applied to tissue). In mammalian brain, direct current (DC) electric fields 5-10 mV/mm cause changes in neuronal evoked population spikes in hippocampal slices (Jefferys, 1981). In experiments that used both sinusoidal input fields and added noise, stochastic resonance, Gluckman et al. (1996b) detected field interactions as low as 2.5 mV/mm root mean square (rms) in the CA1 region of the hippocampal slice. More recently, Ghai et al. (2000) demonstrated the ability to modify activity in low calcium hippocampal slices with electric fields as low as 1 mV/mm.
Theory, however, predicts that elongated neurons should have submillivolt per millimeter sensitivity (Weaver et al., 1998). Significant interaction with an electric field requires an effect on cellular biochemical processes greater than the “molecular shot noise” driven by macromolecular thermal fluctuations. Based on an elongated neuron model with thermal noise, the threshold for electric field interaction was estimated near 100 μV/mm (Weaver et al., 1998).
The mammalian hippocampus has several unique features that render it particularly sensitive to electric fields. Cellular packing is so dense that it can display epileptiform events even in the absence of functioning chemical synapses (Jefferys and Haas, 1982; Taylor and Dudek, 1982), a condition under which electric fields likely play a significant role in ensemble activity. Hippocampal pyramidal cells have somata asymmetrically placed with respect to their dendritic trees, and the sensitivity of a neuron to firing rate modulation from an imposed electric field is related to the amount of positional asymmetry of the soma with respect to the dendritic tree (Chan and Nicholson, 1986; Chan et al., 1988). In addition, the individual pyramidal cells are aligned such that adjacent cells have parallel dendrites, which favor interaction with fields aligned along the collective somatodendritic axes (Rushton, 1927). These oriented low amplitude effects are distinct from the depolarization block seen with unoriented fields of higher amplitude and frequency (Bikson et al., 2001).
In the experiments that are described here, we used a longitudinal hippocampal slice to maximize alignment of CA1 or CA3 neurons with the parallel electric field lines generated from parallel plate electrodes. We also used an electric field waveform with similarities to natural CA3 population extracellular fields, mimicking the low frequency characteristics of CA3 population activity local field potentials. We examined the effect of weak fields both on network responses and single neurons.
Materials and Methods
Slice preparation. Hippocampal slices were prepared from 45-to 80-d-old Sprague Dawley rats that were anesthetized deeply with diethyl-ether and decapitated. Slices (350 μm thick) were cut longitudinally with a tissue chopper and placed in an interface type perfusion chamber at 34°C. Consistently healthy longitudinal slices were obtained if slices were placed into the chamber at room temperature before being warmed with the temperature control circuit. Slices were perfused for 90 min with artificial CSF (ACSF) composed of (in mm): 155 Na+, 136 Cl-, 3.5 K+, 1.2 Ca 2+, 1.2 Mg 2+, 1.25 PO42-, 24 HCO3-, 1.2 SO42-, and 10 dextrose. To generate synchronous population events in the hippocampal slice, we then replaced the perfusate with elevated potassium ACSF containing 8.5 mm K+ and 141 mM Cl - (Rutecki et al., 1985). Slices were allowed to acclimate to the elevated K+ for 1-1.5 hr.
Recording methods. All neuronal activity was recorded with the use of saline-filled micropipette electrodes (1-3 MΩ for recording population bursts and 9-15 MΩ for single-unit recording), which were amplified differentially (Grass model P16, Grass Instruments, Quincy, MA) with respect to a saline agar bridge reference electrode (75 KΩ). This bridge electrode contained agar prepared with 8.5 mm KCl as the solvent. To minimize the stimulation artifact, we placed the reference electrode on an isopotential of the applied field, manipulating it with respect to the recording electrode to minimize a test sinusoidal electric field (Gluckman et al., 1996b).
In the presence of elevated K+ the hippocampal slices exhibit population burst firing activity in the CA3 region (Rutecki et al., 1985). CA1 activity from longitudinal slices in elevated K+ consists of smaller population events than seen in CA3 and prominent single-unit activity. This differs from transverse slice CA1 dynamics in elevated K+ because the CA1 effectively is disconnected from the CA3 in this longitudinal preparation. We used a simple threshold-crossing technique to detect the onset times of the CA3 population bursts and CA1 neuronal activity. Single-unit spike extraction was performed with Common Processing and Autocut software (DataWave Technologies, Longmont, CO).
Electric field production. Slices were placed between two field-generating Ag-AgCl parallel plate electrodes submerged in the perfusate. The electric field was generated in the chamber from driving current between two 12-mm-wide parallel Ag-AgCl plates, spaced 17 mm apart, embedded within the chamber floor. To compensate for electrode polarization, we feedback-controlled the current that was applied by using a four-electrode technique (Fig. 1 A) such that the electrical potential between two 1-mm-in-diameter sensing electrodes placed 12 mm apart was proportional to a control signal (Gluckman et al., 2001). The resulting electric field in the central 1 cm 2 region, where the slices were placed, was mapped by using sinusoidal applied fields to establish electric field uniformity and to calibrate the stimulation electronics. The stimulation electronics were constructed such that the potentials of the stimulation electrodes could float with respect to measurement ground. The final current-generating stage was battery powered, based on an Analog Devices Amp01 instrumentation amplifier (Wilmington, MA), with an additional operational amplifier stage. Additionally, the input stage of the stimulation amplifier contained a zeroing offset, used to set the electric field to zero when the control signal was zero. In practice, this offset was adjusted at the beginning of each experiment until the differentially measured potential difference between micropipette electrodes placed within the chamber 5-10 mm apart in the direction of the field was minimized, yielding a baseline DC field with a magnitude <10 μV/mm.
Figure 1.

A, Schematic of the electrode configuration used to generate electric fields. B, Typical network activity from the CA1 region. Calibration: 0.04 mV, 100 msec. Dashed lines indicate the positive and negative thresholds used to detect events (see Materials and Methods). C, D, Shown are the power spectral densities (PSDs) of the natural (E) and simulated (F) CA3 bursts. Scaled versions of waveform F were used as the electric field input in the experiments.
To stimulate the slices, we used simulated burst stimulus waveforms (Fig. 1 F) that had a Gaussian profile (26 msec full width at half-maximal) and a low frequency spectrum with a similar distribution (Fig. 1C,D) to that of a CA3 population burst (Fig. 1 E). The stimulus waveform was generated at 10 kHz on a PC, producing an analog signal via a digital-to-analog circuit (M16-E National Instruments, Austin, TX). This analog signal was low-pass-filtered (<1.5 kHz) to reduce artifacts from the digital-to-analog conversion. Because such waveforms differ significantly from the typical square wave stimuli used in previous electric field threshold experiments, we will report both the peak amplitude and the rms amplitude of these simulated burst waveforms. The rms amplitude of stimulus waveforms was calculated over a window of 90 msec. All amplitudes that appear in the figures are in units of rms.
CA3 experimental protocol. In experiments conducted on the CA3, we chose slices that both exhibited robust population bursting and could be entrained fully by input fields with a maximum peak of 10 mV/mm. This excluded slices that were insensitive to electric field modulation, presumably because of the variability of the slicing procedure. Because of our alignment of the reference electrode along an isopotential, the stimulation artifacts from fields as large as 10 mV/mm were small with respect to the CA3 population burst activity and allowed for straightforward burst time extraction by using a simple threshold crossing. CA3 data were low-pass-filtered below 500-1000 Hz (recorded in true DC).
At the beginning of each CA3 experiment the mean interburst interval (IBI) of the slice was established over a 2 min period. A periodic input time series of simulated bursts was generated, with inter-event intervals 12% faster than the mean rate of the slice for slices with decreasing IBI and 10% faster for slices with increasing or stable IBI. The mean IBI rate of the slice was recalculated after each trial to ensure that the mean input frequency used for the stimulus remained faster than the new intrinsic mean of the slice. If after a trial the slice had a mean intrinsic IBI faster than that of the stimulus, then the data were discarded, because this implied that at some time during the experiment the rate of the input and slice were the same. Such identical frequencies would generate spurious cross-correlation, which could not be distinguished from true synchronization because of coupling between the two systems.
In an effort to reduce further the spurious cross-correlation because of shared frequency content, the phase of the input field was perturbed randomly (see Fig. 2 B) at least once per minute. Recordings during stimulation were 7 min in length, a time chosen as a compromise in obtaining sufficient data for statistical analysis while minimizing drift in the intrinsic mean IBI.
Figure 2.

Data taken from a CA3 experiment. The thick lines pointing downward in A and B indicate the times of the input stimuli (shown in Fig. 1 F). The thin traces are voltage recordings of population burst activity from CA3. A, Data from an experiment with an rms peak electric field strength of 3.9 mV/mm. B, Data from the corresponding sham experiment. Stimulus artifact (SA) and phase perturbations (PP) are marked. C, D, Raster plots from experiments in A and B showing entrainment and lack of entrainment, respectively.
Sham experiments were conducted with the field electronics turned off and were interspersed with the field experiments. These sham experiments were used to generate statistical confidence limits for the field stimulation experiments.
CA1 experimental protocol. Experiments conducted on the CA1 were taken from slices that showed robust cellular activity in this region and that retained little or no anatomic CA3 after slicing. Such slices therefore were devoid of large-scale population burst firing events from the CA3, which minimized endogenous electric field or synaptic input to the CA1 that would have complicated interpretation of the results. Small spontaneous population responses and single-cell activity were observed. Stimulation frequency of 1-2 Hz was used for CA1 experiments.
All of the CA1 data were bandpass-filtered (250-2000 Hz) before data analysis. This bandpass served to capture multiple and single-unit activity well and, when applied to recordings of the stimuli from the chamber without a slice present, nearly eliminated the stimulus waveform. The same phase perturbations and sham experiments discussed above also were used for CA1 experiments.
However, because of the smaller signal-to-noise ratio of CA1 activity, we remained cautious of spurious stimulus artifacts and therefore generated two peri-stimulus time histograms (PSTHs) that used both upper and lower threshold crossings (Fig. 1 B). Because of the asymmetry of the input field with respect to zero voltage, we would expect mirror image changes in these two PSTH values from stimulus artifact contamination. The sum of these PSTHs was calculated for each bin so that field artifacts would sum to zero, giving distributions similar to the sham experiments. Biological activity that synchronized to the fields, either excitatory or inhibitory, would give asymmetric PSTH distributions after such dual-threshold PSTHs were combined.
Results
CA3 activity
Raw data from a CA3 experiment are shown in Figure 2. In Figure 2, A and B, the top traces (thick lines) mark the timing of the stimulus field inputs, and the bottom trace (thin lines) shows the simultaneously recorded neuronal activity. At the beginning of the epoch shown in Figure 2A, the stimulus and CA3 activity start out of phase and remain unsynchronized for several stimulus cycles. This illustrates the subthreshold nature of small input fields, which are not able to produce arbitrarily large phase resets for the population bursts. However, once the stimulus phase comes into close alignment with the CA3 population phase, it captures and entrains the network (by pulse 4) at this field strength of 3.9 mV/mm rms (6.8 mV/mm peak). The residual stimulus artifact (SA) shown in Figure 2 is the largest we observed in these experiments after properly aligning the reference electrode close to an isopotential. The amplitude disparity between CA3 bursts and such residual SA made use of a simple threshold adequate to discriminate population firing times from SA in CA3 experiments without errors. Figure 2B illustrates data from the corresponding sham experiment in which the independent nature of the signals can be observed readily. An example of a phase perturbation (PP) is shown at the beginning of the epoch in Figure 2B.
Raster plots of the population events shown in Figure 2, A and B, are shown in Figure 2, C and D, respectively. It is clear that in Figure 2C the neuronal data are synchronized strongly to the stimulus input. Note that the neuronal activity escapes entrainment near the 45th stimulus, followed by steady advance of the phase difference between the stimulus and the neuronal activity until capture again is effected. No entrainment is seen in the raster plot from the sham experiment in Figure 2D. The raster plots in Figure 2 represent just over 3 min of recording.
CA3 synchronization at smaller field strengths from one experiment is illustrated in Figure 3. The left column demonstrates synchronization between an electric field stimulus and CA3 population burst activity with field strengths as low as 560 μV/mm rms (1.2 mV/mm peak amplitude) in Figure 3, E and G. On the right side of the figure are the corresponding sham experimental results. Figure 3, A and C, demonstrates strong synchronization at a field strength of 1.68 mV/mm rms (3.6 mV/mm peak), whereas the weaker synchronization remains visually evident in the raster and histogram plots in Figure 3, E and G. The dotted lines in Figure 3 indicate 2 SD above the mean histogram bin values.
Figure 3.

Raster plots from a CA3 electric field experiment (A, E) and the corresponding shams (B, F) are shown with corresponding peri-stimulus time histograms (PSTHs), using 20 msec bins (C, D, G, H). Dashed horizontal lines are the mean of the histogram values plus 2 SD. The input stimulus rms amplitudes are indicated.
To estimate the electric field threshold that would cause statistically reliable synchronization, we examined all of the data from slices that would synchronize completely with the input field at a peak strength of 10 mV/mm. This relatively large field (Terzuolo and Bullock, 1956; Jefferys, 1981; Gluckman et al., 1996a,b; Ghai et al., 2000) would synchronize more than one-half of the slices that were tested.
For individual experiments (see supplementary data; available at www.jneurosci.org), significant consecutive histogram peaks just after stimulation were observed for three of 10 slices at 460 μV/mm rms (979 μV/mm peak). For random variables drawn from a normal distribution, consecutive histogram values >2SD should occur with frequencies <0.0025. We observed a significant consecutive histogram peak in only one of six experiments at 370 μV/mm rms (787 μV/mm peak).
Such simple threshold statistics do not reflect the broader histogram deviations just after stimulation, with values below 2 SD evident in these experiments. To better estimate a population threshold, we therefore pooled data from all of the experiments. The pooled and averaged results for 35 slices from six rats at a selection of field strengths are illustrated in Figure 4. In each panel the means (thin solid line) ± 2 SD (dashed lines) of the pooled and averaged sham experiments are indicated. We sought to match the number of bursts in the sham experimental groups to the number of bursts in the respective field experimental groups. If the total number of events in a given experimental group was less than the total number of sham events, we would resample the sham experiments randomly. Using the sham results to establish statistical confidence, we found that the lowest field strength that produced statistically significant pooled synchronization results in CA3 experiments was 370 μV/mm rms (787 μV/mm peak amplitude).
Figure 4.

PSTHs (20 msec bins) from data pooled and averaged over all of the CA3 experiments. The electric field orientation, excitatory, is illustrated in the top left inset. Solid horizontal line is the mean of the number-matched sham data, and the dashed horizontal lines are ± 2 SD of the sham data. The input stimulus rms amplitudes are indicated. Significant synchronization is observed at 370 μV/mm rms (787 μV/mm rms peak). The bottom right panel (0 mV/mm) was generated from pooling and averaging all of the CA3 sham data.
CA1 network activity
Synchronization between CA1 network activity and the electric field stimulus is illustrated in Figure 5 for experiments from one slice. At the top of the figure is an example of raw CA1 network data with small population and multiunit activity (calibration 0.04 mV, 1000 msec), stimulated with the Gaussian-shaped field indicated in the bottom trace, with an excitatory field of 1.75 mV/mm rms. The expanded insets show the Gaussian profile of the slight residual field artifact and the increased CA1 network activity responding with small time lags to the onset of each stimulus field. The raster plots and histograms of the left column of Figure 5 illustrate an experiment in which the electric field was excitatory (top left inset), and the right column illustrates data in which the electric field was inhibitory (top right inset). Each panel shows the mean ± 2 SD of the histogram (10 msec bins). Evidence of synchronization is present for each field strength that is shown. At the larger field strengths in Figure 5, the histogram peaks easily can be seen reflected in the raster plots.
Figure 5.
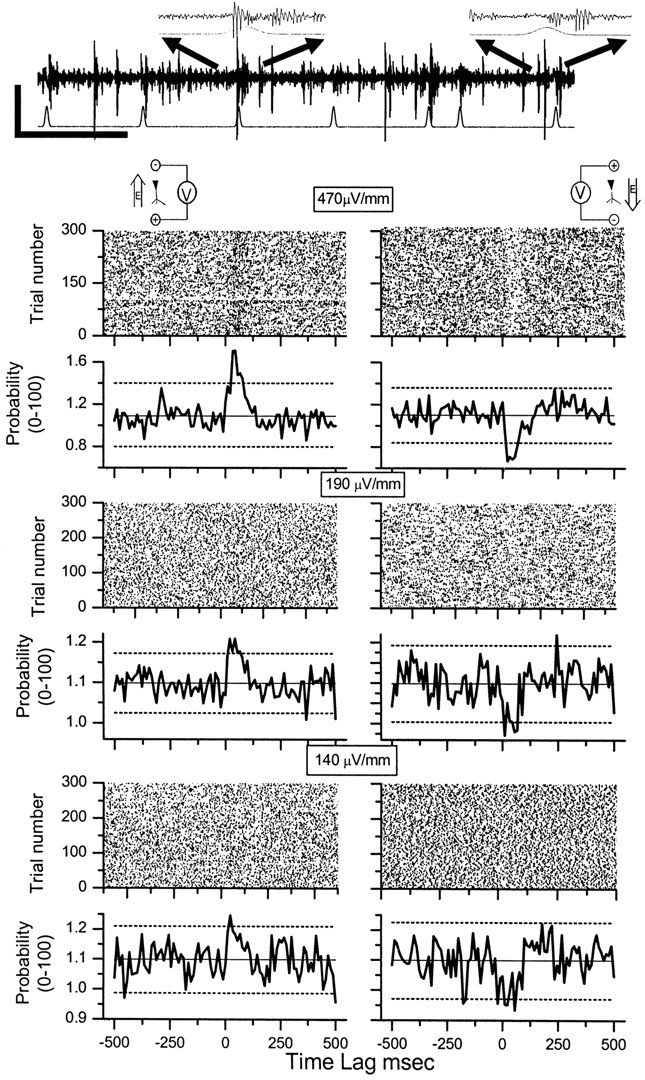
PSTHs (10 msec bins) generated from threshold crossing times of CA1 network activity at time lags relative to the stimulus waveform. Inset at the top of the figure illustrates a sample of CA1 network data with small population and multiunit activity (calibration: 0.04 mV, 1000 msec), stimulated with Gaussian-shaped field indicated in bottom trace with an excitatory field of 1.75 mV/mm rms. The expanded insets show the Gaussian profile of the slight residual field artifact and the increased CA1 network activity responding with small time lags to the onset of each stimulus field. The raster plots and histograms of the left column represent data taken with the electric field oriented such that it causes excitation, and the right column represents data with the electric field oriented in the opposite direction such that it causes suppression. Each right-left pair of histograms was taken from the same slice within 10 min of each other. Solid horizontal line is the mean of the histogram bin counts, and the dashed lines are ± 2 SD of the mean. The input stimulus rms amplitudes are indicated.
To estimate the electric field threshold limit that would cause statistically reliable synchronization, we examined all of the data from slices that would synchronize significantly with the input field at a peak strength of 1 mV/mm. This was in contrast to 10 mV/mm used for the CA3, because the CA1 was much more sensitive to electric fields. Almost every slice that exhibited robust CA1 cellular activity met this criterion.
For individual experiments (see supplementary data) significant consecutive histogram values just after stimulation were observed (from 6 slices) for three of five excitatory (+) and two of four inhibitory (-) experiments at 140 μV/mm rms (298 μV/mm peak).
Figure 6 shows the pooled and averaged results from 18 experiments on five rats, using seven slices with two field strengths: 290 μV/mm and 140 μV/mm (rms). The field orientations correspond to the excitatory (top) and inhibitory (bottom) orientations. In each plot the PSTHs are a combination of the upper and lower threshold crossings, with the mean ± 2 SD for event number-matched shams plotted as solid and dotted lines, respectively (sham data histograms are plotted as insets). The lowest field strength used that produced significant synchronization in these averaged CA1 experiments was 140 μV/mm rms (298 μV/mm peak amplitude).
Figure 6.

PSTHs (10 msec bins) of data pooled and averaged over all of the CA1 experiments. Thick curve illustrates results that use an input field of 290 μV/mm rms (596 μV/mm peak), and the thin curve data are from experiments with an input field of 140 μV/mm rms (298 μV/mm peak). Solid horizontal line is the mean of a number-matched sham, and dashed lines are ± 2 SD of that sham distribution. Insets show the CA1 sham distributions. The top panel illustrates results that use the excitatory field orientation, whereas the bottom reflects the inhibitory field.
CA1 single-unit activity
Figure 7A shows 10 sec of bandpass-filtered recording (250-2000 Hz) from an experiment observing a single unit in CA1 (further illustrated in Fig. 8). Note the absence of stimulus artifact. A single-unit trace is shown as an inset at an expanded time base in Figure 7A. Figure 7B shows an overlay of all of the first spike waveforms from the bursts from this experiment, confirming that this was indeed a single unit.
Figure 7.

A, Bandpass-filtered (250-2500 Hz) data (10 sec) from a single CA1 unit, with one burst expanded in the inset. B, An overlay of all of the primary (first) spikes from each burst event from this experiment, the overlap confirming that this was indeed a single unit.
Figure 8.

Raster plots generated from CA1 single-unit activity from two different hippocampal slices along with the corresponding PSTH (20 msec bins). Dashed horizontal lines are the mean of the histograms ± 2 SD. The input stimulus rms amplitudes are indicated.
Raster plots from two separate single-unit experiments are shown in Figure 8, A, B, E, and F, along with the corresponding PSTH in Figure 8, C, D, G, and H. Figure 8, E and G, demonstrates data from the solitary observed case of a single unit synchronizing with a field of 140 μV/mm rms (298 μV/mm peak amplitude), along with the corresponding sham experiment in Figure 8, F and H. Once again the dashed lines in the histograms are the mean histogram value ± 2 SD. Although frequent network synchronization was observed at this field strength, this was the only single unit observed to synchronize at such low field intensity.
For individual experiments (see supplementary data) significant consecutive histogram peaks just after stimulation were observed in three of 11 experiments of single-unit modulation at 185 μV/mm rms (394 μV/mm peak) and a single significant result for one of 14 slices at 140 μV/mm rms (298 μV/mm peak).
Most single units demonstrated burst firing activity as shown in Figure 7. If the electrodes were pushed against the cells during positioning, burst firing often would convert transiently to singlet activity. After electrodes were positioned, most cells would switch spontaneously from burst to singlet firing during recording at some point during the experiment, although burst firing remained the predominant mode of activity (>80%). Single-cell data were pooled from both singlet and burst firing modes, and all spikes were used for the analysis shown here. When only the first spike in a burst was used for analysis, the electric field interaction threshold appeared to be unchanged (data not shown).
Figure 9 illustrates averaged results for a selection of excitatory field strengths for CA1 single-unit activity. Event number-matched sham data averaged for each experimental group are indicated (thin lines) along with ± 2 SD of the sham mean (dashed lines). The lowest field strength that produced significant synchronization in pooled and averaged data (15 experiments on 4 rats, using 6 slices) was 185 μV/mm rms (393 μV/mm peak).
Figure 9.

PSTHs (10 msec bins) generated from the pooled and averaged CA1 single-unit data from all of the experiments. Field is oriented such that it causes excitation. Thick lines are the PSTH from the data, and thin lines are from the number-matched sham experiments. Significant modulation is observed for 185 μV/mm rms (394 μV/mm peak) for these pooled data, but not for 140 μV/mm rms (298 μV/mm peak). Solid horizontal line is the mean from the sham experiments, and dashed lines are ± 2 SD from the sham mean. The input stimulus rms amplitudes are indicated.
Discussion
Our findings are the first experimental evidence that neurons are indeed capable of synchronizing to weak electric fields below 1 mV/mm, and our results demonstrate thresholds for electrical field interactions close to the best available theoretical limits. CA1 pyramidal cell networks were sensitive to fields with rms amplitudes as small as 140 μV/mm. In addition, we have shown the first experimental demonstration that neuronal networks appear to respond to fields with more sensitivity than single neurons.
We observed both excitation and suppression of network activity in CA1 at the lowest field strengths that were used (140 μV/mm rms). Such weak interaction thresholds are important for several reasons: the potential use of weak electric fields for neuronal modulation in prosthetic device design (Gluckman et al., 1996a, 2001; Ghai et al., 2000; Richardson et al., 2003), the environmental ELF field threshold for interaction with biological systems (Adair, 1991; Weaver et al., 1998), or consideration of the significance of endogenous field interactions within the intact nervous system (Jefferys and Haas, 1982; Snow and Dudek, 1984a,b, 1986; Traub et al., 1985a,b; Dudek et al., 1986; Vigmond et al., 1997).
The CA1 networks were more sensitive to the electric fields than the CA3 networks. Anatomic evidence suggests that the CA1 pyramidal cells are more consistent in their total dendritic lengths from one area of the CA1 to the next, in contrast to CA3 (Ishizuka et al., 1995). The pyramidal cells of the CA1 region also have a smaller extracellular-to-intracellular volume ratio than that of the CA3 region (McBain et al., 1990), and such tight packing of neurons increases the electrical impedance and field interactions between cells (Vigmond et al., 1997).
The observation that weak perturbations can synchronize oscillatory physical systems is centuries old (Huygenii, 1673). In vivo measurements of hippocampal sharp waves can be as large as 8-14 mV/mm (Buzsaki, 1986), nearly two orders of magnitude larger than needed to observe the effects seen in our experiments. Our findings suggest that endogenous local field potentials are large enough to play a role in the synchronization of neuronal networks in the intact brain (Traub et al., 1985a,b). Because small fields can modulate neuronal excitability in a subthreshold manner, network activity could modulate the excitability of cells that are not spiking and of cells not connected synaptically to the firing neurons producing the electrical fields. Examples of place cells (Skaggs et al., 1996) and odor recognition (Wehr and Laurent, 1996), in which the phase of the rhythmic local field potential is important in neural encoding, are situations in which endogenous electric fields could play a role.
Recent work predicts that the theoretical limit for the threshold to detect a response in an elongated cell (25 × 1000 μm) to ELF electric fields would be ∼100 μV/mm (Weaver et al., 1998). This estimation is based on the assumption that the electric field must produce effects larger than the stochastic fluctuations relevant to biological membranes such as voltage-gated ion channels and their associated ion fluxes, the so-called molecular shot noise (Astumian et al., 1995). Our findings of a threshold for the CA1 networks and single cells between 100 and 200 μV/mm are the first experimental data consistent with this predicted limit (Weaver et al., 1998).
In addition, to our knowledge, this is the first demonstration that neuronal networks respond to fields more sensitively than single neurons. Whether this is a manifestation of simply increasing the numbers of neuronal detectors or is from array-enhanced signal detection caused by coupling (Linder et al., 1995; Gailey, 2000; Krawiecki et al., 2000) remains to be determined.
We made no attempt to optimize the stimulus waveforms that were used. Instead, we selected the field temporal profiles to mimic naturally occurring population burst profiles from CA3. Optimizing waveforms to incorporate neuronal resonant frequencies (Hutcheon and Yarom, 2000) might decrease further the field strength required to observe synchronization. The use of white noise electric field stimulation with spike-triggered averaging of the preceding electric field (Bryant and Segundo, 1976) could serve as a useful tool for optimizing the electric field morphology.
Modulation by small fields has advantages in control devices that use electric fields to modulate neuronal networks (Gluckman et al., 2001; Richardson et al., 2003). Designing such devices to operate at the smallest possible field strengths will minimize the potential for unwanted functional effects or tissue damage from long-term chronic stimulation.
Whether weak environmental ELF fields affect neuronal firing will be a function of the reduction in ambient field by the anatomic layers surrounding the brain and the neuronal modulation threshold. Estimates suggest that typical ambient fields will be attenuated below the thresholds we have determined (Adair, 1991). We view it as important to fill in two remaining experimental gaps in our knowledge of ELF field effects: to verify experimentally the predicted attenuation of fields and, in the manner described here, to measure the synchronization threshold for 50-60 Hz fields.
Footnotes
This work was supported by National Institutes of Health Grants K02MH01493 and R01MH50006 and the Whitaker Foundation.
Correspondence should be addressed to Steven J. Schiff, Krasnow Institute, Mail Stop 2A1, George Mason University, Fairfax, VA 22030. E-mail: sschiff@gmu.edu.
J. T. Francis' present address: State University of New York Downstate Medical Center, Brooklyn, NY 11203.
Copyright © 2003 Society for Neuroscience 0270-6474/03/237255-07$15.00/0
References
- Adair RK ( 1991) Biological effects on the cellular level of electric field pulses. Health Phys 61: 395-399. [DOI] [PubMed] [Google Scholar]
- Astumian RD, Weaver JC, Adair RK ( 1995) Rectification and signal averaging of weak electric fields by biological cells. Proc Natl Acad Sci USA 92: 3740-3743. [DOI] [PMC free article] [PubMed] [Google Scholar]
- Bikson M, Lian J, Hahn PJ, Stacey WC, Sciortino C, Durand DM ( 2001) Suppression of epileptiform activity by high frequency sinusoidal fields in rat hippocampal slices. J Physiol (Lond) 531: 181-191. [DOI] [PMC free article] [PubMed] [Google Scholar]
- Bryant HL, Segundo JP ( 1976) Spike initiation by transmembrane current: a white-noise analysis. J Physiol (Lond) 260: 279-314. [DOI] [PMC free article] [PubMed] [Google Scholar]
- Buzsaki G ( 1986) Hippocampal sharp waves: their origin and significance. Brain Res 398: 242-252. [DOI] [PubMed] [Google Scholar]
- Chan CY, Nicholson C ( 1986) Modulation by applied electric fields of Purkinje and stellate cell activity in the isolated turtle cerebellum. J Physiol (Lond) 371: 89-114. [DOI] [PMC free article] [PubMed] [Google Scholar]
- Chan CY, Houndsgaard J, Nicholson C ( 1988) Effects of electric fields on transmembrane potential and excitability of turtle cerebellar Purkinje cells in vitro J Physiol (Lond) 402: 751-771. [DOI] [PMC free article] [PubMed] [Google Scholar]
- Dudek FE, Snow RW, Taylor CP ( 1986) Role of electrical interactions in synchronization of epileptiform bursts. Adv Neurol 44: 593-617. [PubMed] [Google Scholar]
- Gailey PC ( 2000) Electrical signal detection and noise in systems with long-range coherence. In: Self-organized biological dynamics and nonlinear control (Wallenczek J, ed), pp 147-172. Cambridge, UK: Cambridge UP.
- Ghai RS, Bikson M, Durand DM ( 2000) Effects of applied electric fields on low-calcium epileptiform activity in the CA1 region of rat hippocampal slices. J Neurophysiol 84: 274-280. [DOI] [PubMed] [Google Scholar]
- Gluckman BJ, Neel EJ, Netoff TI, Ditto WL, Spano ML, Schiff SJ ( 1996a) Electric field suppression of epileptiform activity in hippocampal slices. J Neurophysiol 76: 4202-4205. [DOI] [PubMed] [Google Scholar]
- Gluckman BJ, Netoff TI, Neel EJ, Ditto WL, Spano ML, Schiff SJ ( 1996b) Stochastic resonance in a neuronal network from mammalian brain. Phys Rev Lett 77: 4098-4101. [DOI] [PubMed] [Google Scholar]
- Gluckman BJ, Nguyen H, Weinstein SL, Schiff SJ ( 2001) Adaptive electric field control of epileptic seizures. J Neurosci 21: 590-600. [DOI] [PMC free article] [PubMed] [Google Scholar]
- Hugenii C ( 1673) Horoloquim oscilatorium. Paris: Muguet. Reprinted in English as: The pendulum clock. Ames, IA: Iowa State UP, 1986.
- Hutcheon B, Yarom Y ( 2000) Resonance, oscillation, and the intrinsic frequency preferences of neurons. Trends Neurosci 23: 216-222. [DOI] [PubMed] [Google Scholar]
- Ishizuka N, Cowan WM, Amaral DG ( 1995) A quantitative analysis of the dendritic organization of pyramidal cells in the rat hippocampus. J Comp Neurol 362: 17-45. [DOI] [PubMed] [Google Scholar]
- Jefferys JG ( 1981) Influence of electric fields on the excitability of granule cells in guinea-pig hippocampal slices. J Physiol (Lond) 319: 143-152. [DOI] [PMC free article] [PubMed] [Google Scholar]
- Jefferys JGR ( 1995) Nonsynaptic modulation of neuronal activity in the brain: electric currents and extracellular ions. Physiol Rev 75: 689-723. [DOI] [PubMed] [Google Scholar]
- Jefferys JGR, Haas HL ( 1982) Synchronized bursting of CA1 hippocampal pyramidal cells in the absence of synaptic transmission. Nature 300: 448-450. [DOI] [PubMed] [Google Scholar]
- Krawiecki A, Sukiennicki A, Kosinski RA ( 2000) Stochastic resonance and noise-enhanced order with spatiotemporal periodic signal. Phys Rev E 62: 7683-7689. [DOI] [PubMed] [Google Scholar]
- Linder JG, Meadows BK, Ditto WL ( 1995) Array-enhanced stochastic resonance and spatiotemporal synchronization. Phys Rev Lett 75: 3-6. [DOI] [PubMed] [Google Scholar]
- McBain CJ, Traynelis SF, Dingledine R ( 1990) Regional variation of extracellular space in the hippocampus. Science 249: 674-677. [DOI] [PubMed] [Google Scholar]
- Richardson KA, Gluckman BJ, Weinstein SL, Glosch CE, Moon JB, Gwinn RP, Gale K, Schiff SJ ( 2003) In vivo modulation of epileptiform activity with radial hippocampal electric fields. Epilepsia 44: 768-777. [DOI] [PubMed] [Google Scholar]
- Rushton WAH ( 1927) The effect upon the threshold for nervous excitation of the length of nerve exposed, and the angle between current and nerve. J Physiol (Lond) 63: 357-377. [DOI] [PMC free article] [PubMed] [Google Scholar]
- Rutecki PA, Lebeda FJ, Johnston D ( 1985) Epileptiform activity induced by changes in extracellular potassium in hippocampus. J Neurophysiol 54: 1363-1374. [DOI] [PubMed] [Google Scholar]
- Skaggs WE, McNaughton BL, Wilson MA, Barnes CA ( 1996) Theta phase precession in hippocampal neuronal populations and the compression of temporal sequences. Hippocampus 6: 149-172. [DOI] [PubMed] [Google Scholar]
- Snow RW, Dudek EF ( 1984a) Electrical fields directly contribute to action potential synchronization during convulsant-induced epileptiform bursts. Brain Res 323: 114-118. [DOI] [PubMed] [Google Scholar]
- Snow RW, Dudek FE ( 1984b) Synchronous epileptiform bursts without chemical transmission in CA2, CA3, and dentate areas of the hippocampus. Brain Res 298: 382-385. [DOI] [PubMed] [Google Scholar]
- Snow RW, Dudek FE ( 1986) Evidence for neuronal interactions by electrical field effects in the CA3 and dentate regions of rat hippocampal slices. Brain Res 367: 292-295. [DOI] [PubMed] [Google Scholar]
- Taylor CP, Dudek FE ( 1982) Synchronous neural afterdischarges in rat hippocampal slices without active chemical synapses. Science 218: 810-812. [DOI] [PubMed] [Google Scholar]
- Terzuolo CA, Bullock TH ( 1956) Measurement of imposed voltage gradient adequate to modulate neuronal firing. Physiology 42: 687-694. [DOI] [PMC free article] [PubMed] [Google Scholar]
- Traub RD, Dudek FE, Taylor CP, Knowles WD ( 1985a) Simulation of hippocampal afterdischarges synchronized by electrical interactions. Neuroscience 14: 1033-1038. [DOI] [PubMed] [Google Scholar]
- Traub RD, Dudek FE, Snow RW, Knowles WD ( 1985b) Computer simulations indicate that electrical field effects contribute to the shape of the epileptiform field potential. Neuroscience 15: 947-958. [DOI] [PubMed] [Google Scholar]
- Vigmond EJ, Perez Velazquez JL, Valiante TA, Bardakjian BL, Carlen PL ( 1997) Mechanisms of electrical coupling between pyramidal cells. J Neurophysiol 78: 3107-3116. [DOI] [PubMed] [Google Scholar]
- Weaver JC, Vaughan TE, Adair RK, Astumian RD ( 1998) Theoretical limits on the threshold for the response of long cells to weak extremely low frequency electric fields due to ionic and molecular flux rectification. Biophys J 75: 2251-2254. [DOI] [PMC free article] [PubMed] [Google Scholar]
- Wehr M, Laurent G ( 1996) Odour encoding by temporal sequences of firing in oscillating neural assemblies. Nature 384: 162-166. [DOI] [PubMed] [Google Scholar]