

Abstract
Whole-cell patch-clamp recordings were made from morphologically identified ganglion cells in the intact retina of developing ferrets. As early as 3 d after birth, all ganglion cells exhibited bursts of spontaneous activity, with the interval between bursts gradually decreasing with maturity. By 2 weeks after birth, ganglion cells could be morphologically differentiated into three major classes (α, β, and γ), and at this time each cell class was characterized by a distinct pattern of spontaneous activity. Dual patch-clamp recordings from pairs of neighboring cells revealed that cells of all morphological classes burst in a coordinated manner, regardless of cell type. These observations suggest that a common mechanism underlies the bursting patterns exhibited by all ganglion cell classes, and that class-specific firing patterns emerge coincident with retinal ganglion cell morphological differentiation.
Keywords: ganglion cells, retina, spontaneous activity, synchronous activity, retinal development, dual patch-clamp
Introduction
Early in development, retinal ganglion cells manifest electrical discharges independently of visual stimulation (Masland, 1977; Galli and Maffei, 1988; Maffei and Galli-Resta, 1990). Such spontaneous activity is characterized by bursts of action potentials that spread across the retinal surface in a wave-like pattern (Meister et al., 1991; Wong et al., 1993, 1995, 1998; Catsicas et al., 1998; Wong, 1999). The cellular mechanisms underlying retinal waves have yet to be established, although a number of studies have shown an initial role for cholinergic synaptic inputs and a subsequent reliance on glutamatergic synaptic inputs (Feller et al., 1996; Bansal et al., 2000; Wong et al., 2000)
The spontaneous discharges of developing ganglion cells have been characterized primarily by extracellular recordings and imaging techniques (Meister et al., 1991; Wong et al., 1993, 1995, 1998; Catsicas et al., 1998). Although these approaches are well suited for assessing spatial and temporal properties of retinal waves, they do not provide information about the functional/structural correlates of individual neurons. The ganglion cell population in the mature retina is comprised of different cell classes that are generated and differentiate during distinct developmental periods (Stryker and Zahs, 1983; Sur et al., 1987; Dann et al., 1988; Ramoa et al., 1988; Roe et al., 1989; Reese et al., 1994). Moreover, different ganglion cell classes are distinguished by a unique retinal circuitry (Sterling, 2003), and the axons of these neurons innervate different target cells (Wingate and Thompson, 1995; Fitzgibbon et al., 1996). This raises the possibility that developing ganglion cells might exhibit class-specific spontaneous discharge patterns. To test the merits of this idea, we combined whole-cell recordings with intracellular filling of ganglion cells in the developing ferret retina.
In the present study, we sought to answer two fundamental questions. (1) Do morphologically defined α-, β-, and γ-cells exhibit spontaneous activities with unique temporal discharge patterns? (2) Is the correlated activity of neighboring ganglion cells dependent on cell class?
Materials and Methods
All experiments were performed in accordance with National Institutes of Health and institutional guidelines regarding animal use.
Retinal preparation. Retinas were obtained from ferrets (Marshall Farm USA, North Rose, NY) ranging in age from postnatal day 3 (P3) to P24, with the day of birth denoted as P0. After a lethal dose of barbiturate [pentobarbital (Nembutal), 200 mg/kg, i.p.], the retinas were removed and stored at room temperature in Eagle's minimal essential medium (EMEM), continuously bubbled with 95% oxygen and 5% CO2. A small piece of retina was placed ganglion cell layer up in the recording chamber and stabilized with an overlying piece of filter paper. A 2 mm hole in the filter paper provided access for the recording electrode. Cells were visualized through a 40× objective lens mounted on a fixed-stage upright epifluorescence microscope (Nikon, Tokyo, Japan).
During recordings the retina was perfused continuously with EMEM (1.5 ml/min) through a gravity-fed line, heated with a Peltier device, and continuously bubbled with 95% oxygen and 5% CO2. A calibrated thermocouple monitored the temperature in the recording chamber, which was maintained at 35°C. Recordings from individual cells usually lasted 30-120 min, and retinal segments from which recordings were made typically remained viable for 8-12 hr. Patch electrodes were filled with a solution containing the following: 140 mm KCl, 10 mm HEPES, 0.5 mmEGTA, 0.5 mg/ml nystatin, 2.5 mg/ml Pluronic-F68, and 0.5% Lucifer yellow or Alexa fluor (488 or 568, 10 mm), pH 7.4. By the end of the experiment the soma and the dendritic arborizations were usually completely filled, suggesting that recordings were made in the whole-cell configuration. Once complete cell filling was achieved, the retina was removed and fixed in 4% paraformaldehyde for 6-12 hr at 4°C.
Morphological analysis. Recorded cells were visualized and identified as ganglion cells before the electrode was withdrawn, and only neurons unequivocally identified as retinal ganglion cells were included in this study. Such identification was made on the basis of the morphological properties described by Wingate et al. (1992), including the presence of an axon in the nerve fiber layer, as well as the ability of cells in the older age group to fire repetitive action potentials. Images of the labeled cells were taken in the whole-mount configuration with an Olympus confocal microscope equipped with krypton and argon lasers and reconstructed using a computerized imaging system (Fluoview 300; Olympus Optical, Melville, NY). Cell class was determined from these images. Ganglion cells in the younger age group (P3-P9) had not yet differentiated and could not be classified on the basis of morphological criteria.
Electrophysiology. Patch pipettes with a tip resistance between 3 and 8 MΩ were pulled from thick-walled 1.5 mm outer diameter borosilicate glass on a Sutter Instruments (Novato, CA) puller (P-97). Current-clamp recordings were made with an Axopatch 200B patch-clamp amplifiers (Axon Instruments, Union City, CA). The data were low-pass-filtered at rates between 1 and 2 kHz and digitized at rates between 1 and 4 kHz before storage on an IBM computer for subsequent offline analysis. Recordings were obtained by patching onto cells with clear, nongranular cytoplasm. High-resistance seals were obtained by moving the patch electrode onto the cell membranes and applying gentle suction. After the formation of high-resistance seals between the electrodes and the cell membranes, transient currents caused by pipette capacitance were electronically compensated by the circuit of the Axopatch 200B amplifiers. The series resistance was 7-16 MΩ. After attaining whole-cell configuration, the resting membrane potentials were read off the amplifiers. The values of the resting potentials were monitored regularly throughout the recordings, and if significant changes were observed or if the seal resistance dropped below 1 GΩ, recordings were terminated. Simultaneous data acquisition was triggered with an external pulse for both cells in a pair.
Analysis of spontaneous activity patterns. The spontaneous activity patterns for each cell were characterized in terms of their mean rate and their projection onto the second principal component of the power spectrum. The power spectrum of the activity of each cell was characterized by measuring the energy in 20 bands evenly spaced in log-frequency from 0.01 to 1.0 Hz. This resulted in a 20-dimensional feature vector, x, with components
 |
where R(f) is the Fourier transform of the spike train, · 2 denotes the complex modulus squared, and f denotes frequency. The ith bandpass filter is defined as
 |
where fi is the center frequency (evenly spaced in 20 log-frequency increments from 0.01 to 1.0 Hz), and σ is set to yield a bandwidth of 0.35 octave (so that adjacent bands overlap somewhat).
To reduce dimensionality, a principal-components analysis was performed on the resulting log-frequency spectra for the entire group of older cells. This was done by forming the covariance matrix of the spectra and computing its eigenvectors and eigenvalues:
 |
The eigenvectors satisfy the condition Cei = λiei, and can be easily computed using standard data analysis software (e.g., Matlab; MathWorks, Natick, MA). When ordered by the eigenvalue λi the eigenvectors ei constitute a principal-components analysis of the data (i.e., they specify the axes of the Gaussian ellipse that best fits the data, in order of variance). The first principal component (PC1) reflected the overall power in each band (related to mean rate), whereas the second principal component (PC2) reflected the difference between power in low frequencies (0.01-0.1 Hz) and power in high frequencies (0.1-1.0 Hz). The firing pattern for each cell was then characterized by plotting its position in a two-dimensional space spanned by the mean rate and its projection onto PC2. The mean rate was used rather than PC1 because it yielded better separation of the different cell classes.
Cross-correlation analysis. The degree of synchrony exhibited by pairs of simultaneously recorded cells was characterized by calculating the correlation coefficient between the instantaneous activity of the two cells at different temporal offsets. Instantaneous activity for the youngest age group (P3-P9) was calculated directly from the membrane potential by smoothing it with a 500 msec wide Gaussian window (σ =250 msec), because this group exhibited synchronous slow depolarizations but did not always fire action potentials. For the older age group (P15-P24), instantaneous activity was calculated by first extracting spikes from the membrane potential (by computing the derivative and setting a threshold) and then smoothing the resulting spike train with a 500 msec wide Gaussian window (σ =250 msec).
Letting ρ1 and ρ2 denote the instantaneous activities of cells 1 and 2, respectively, the correlation coefficient at offset τ was calculated as follows:
 |
where COV(ρ1, ρ2, τ) is the covariance betweenρ1 and ρ2 with a temporal offset of τ:
 |
and VAR(ρi) is the variance in activity
 |
 denotes averaging over time (t). Thus, the correlation coefficient is simply the normalized covariance, yielding a number from -1 to +1, indicating the degree of synchrony: +1 corresponds to maximum synchrony and -1 to maximal anticorrelated synchrony (one cell is active whereas the other is inactive). Zero usually corresponds to an absence of synchrony, unless there are periods of positive and negative correlation combined in the average that cancel each other.
Note that covariance measures the relative co-activity between cells, not the absolute co-activity. For example, two cells might show a high amount of co-activity simply because they have a high mean firing rate, without any synchrony. Covariance corrects for these spurious correlations by subtracting the mean rate. However, under many types of Hebbian learning rules it is the absolute co-activity that shapes synaptic development (MacKay and Miller, 1990). If we define the “average co-activity” (COA) as the average pairwise product of the activities, then we have:
 |
Thus, we can see that average co-activity reflects both the degree of synchrony as well as the mean firing rates.
Results
The results will be described in three sections. First, we will deal with the spontaneous activity patterns of very young cells, before their morphological differentiation. Second, we will consider the function/structure correlates in an older group of developing ganglion cells. In the third section, we report on the degree of correlated activity exhibited by spatially adjacent cells.
Spontaneous activity before morphological differentiation
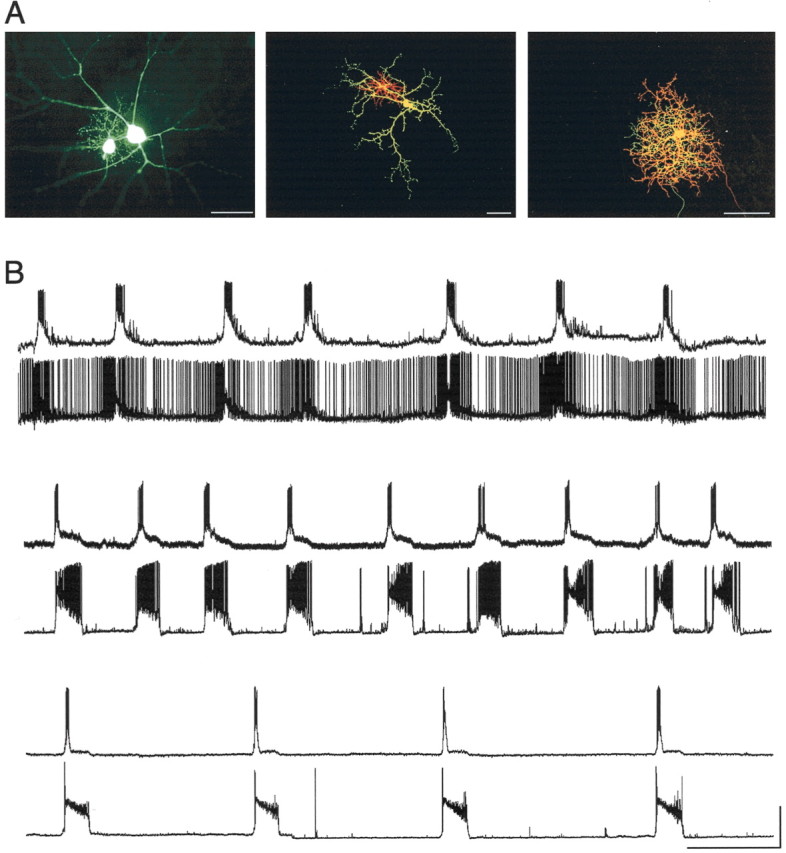
At the youngest ages from which recordings were made (P3-P9), ganglion cells were not yet morphologically differentiated so they could not be put into different classes (Fig. 1A). In all recorded cells there were periodic fluctuations in activity that changed as the cells matured. In most cells (37 of 41) from the younger age group one action potential or a brief burst of them rode on the crest of intermittent membrane depolarizations. At this early age, some cells (4 of 41) had no spikes on the crest of the depolarizations, although these neurons were capable of generating action potentials in response to injected current pulses. This behavior of immature retinal ganglion cells is consistent with that seen in other species during a comparable period of development (Skaliora et al., 1993; Wang et al., 1997). The temporal patterns of the spontaneous activity observed in cells from these young animals were relatively homogeneous. Examples of four cells are shown in Figure 1B. The slow membrane depolarizations occurred relatively infrequently at this age, with little or no activity occurring between depolarizations. A burst of action potentials cresting a membrane depolarization can be seen in the inset.
Figure 1.

Morphology and physiology of immature retinal ganglion cells. A, Two cells filled with Alexa fluor 488 (left) and 568 (right). Cells at this age are not yet fully differentiated. Both cells are from a P3 animal. Scale bar, 50 μm. B, Examples of spontaneous activity recorded from four cells. Bursts of action potentials alternate with periods of quiescence. Resting potentials (Vm), top to bottom, -69, -71, -65, and -68 mV. Calibration: x, 1 min; y, 40 mV. The bursts of activity are superimposed on membrane depolarizations. One burst in the first trace is expanded in the inset to demonstrate the fluctuation in membrane potential. The inset includes a 3 sec trace.
As the animals matured, the bursts of action potentials occurred more frequently. Figure 2 illustrates the decrease in the burst interval observed with increasing age. Cells from the youngest animals averaged a burst only once every 1-3 min, whereas cells from the oldest animals typically burst four times per minute.
Figure 2.

Decrease in burst interval with development. The average burst interval was calculated for a total of 86 cells and is plotted as a function of age. Although there is substantial variability in all ages from both young and older groups, the overall trend is a reduction in the average burst interval between P3 and P24 (r = -0.75, p < 0.001).
Spontaneous activity of morphologically identified developing retinal ganglion cells
Most cells in the older age group (P15-24) could be classified on the basis of their salient morphological features into one of three major cell classes: α-, β-, or γ-cells (Fig. 3A). Cells in these three groups displayed distinct patterns of spontaneous activity, unlike the cells recorded from the younger age group. α-Cells exhibited relatively high rates of activity during the interburst intervals (Fig. 3B, top traces). β-Cells showed more variable patterns of spontaneous activity, with some cells firing very few action potentials between bursts and others displaying fairly high frequency activity between bursts (Fig. 3B, middle traces). γ-Cells formed a homogeneous group, rarely firing action potentials between bursts, as can be seen in Figure 3B (bottom traces). The average firing rates of the three cell classes was significantly different (ANOVA; F = 18.17, p < 0.001), with α-cells exhibiting the highest overall firing rates and γ-cells the lowest (Fig. 4A).
Figure 3.

Physiological attributes of morphologically identified ganglion cells. A, Three cells filled with Alexa fluor 568 are shown to demonstrate the three morphological classes from which recordings were made (α, left; β, middle; γ, right). The ages of the animals were P18, P19, and P21, respectively. Scale bar, 100 μm. B, Recordings from three different cells are shown for each of the different cell classes. α-Cells, characterized by robust activity between and during bursts, are shown in the top three traces (Vm = -64, -66, and -68). β-Cells with variable activity patterns are shown in the middle traces (Vm = -74, -68, and -77 mV), and γ-cells, which tend to be electrically quiet between bursts, are shown in the bottom traces (Vm = -59, -65, and -70 mV). Recordings shown were made from animals aged (top to bottom) P22, P21, P22, P23, P16, P22, P18, P16, and P22. Calibration: x, 25 sec; y, 60 mV.
Figure 4.

Distinct firing patterns of morphologically identified ganglion cells. A, The average spike rate for α-, β-, and γ-cells is plotted (means ± SE), with α-cells exhibiting the highest firing rate and γ-cells the lowest. B, A principal-components analysis (two instances) also indicated distinct firing patterns for the three morphological classes of cells. Mean rate is plotted on the abscissa and the PC2 on the ordinate. Note that α-cells tend to cluster in the positive range of PC2, whereas β-cells cluster in the negative range.
Figure 4B illustrates the distribution of firing patterns in a two-dimensional feature space defined by the overall mean rate (horizontal axis) and the projection onto PC2 of the power spectrum (vertical axis). The PC2 of the power spectrum indicates the amount of power in low frequencies (0.01-0.1 Hz) relative to high frequencies (0.1-1.0 Hz) (see Materials and Methods). These are two independent measures, in that the first characterizes the total number of spikes over the entire recording period, whereas the second characterizes the temporal structure of the bursts, independently of the number of spikes. The scatter plot shows that the firing patterns of the three major cell classes can be differentiated in terms of both their mean rate and their spectral characteristics. α-Cells tended to have a higher mean rate, with bursts occurring with low frequency. β-Cells tended to have intermediate mean rates, with bursts occurring at high frequency. γ-Cells tended to have low mean rates, with bursts occurring in the intermediate-frequency range.
Correlated activity in neighboring retinal ganglion cell pairs
To assess the degree of synchrony in spontaneous activity exhibited by neighboring cells, recordings were made from two adjacent cells that were filled with dye. Examples of paired traces recorded from cells in the younger age group are shown in Figure 5. In all cases, these pairs exhibited pronounced slow depolarizations that usually triggered a burst of spikes that occurred coincidentally in the two neurons. Occasionally spikes appeared in one or the other of the cells during the interburst interval (indicated by the arrow in the P7 cell). Recall, that at the younger ages, the recorded neurons could not be differentiated into morphologically defined classes.
Figure 5.

Synchronous firing of neighboring immature ganglion cells. Even before morphological and physiological differentiation, neighboring ganglion cells depolarize and fire action potentials in concert. Examples of three paired recordings from animals ages P3, P7, and P9 are shown. The arrow indicates spontaneous activity in one cell that occurred between bursts that is not accompanied by a coincident burst of activity in the paired cell recording. Vm, top to bottom, -52, -65, -58, -61, -69, and -64 mV. Calibration: x, 40 sec; y, 35, 35, 30, 45, 25, and 40 mV, respectively.
Examples of filled cells and paired recordings of cells from the older age group are shown in Figure 6. Cells were filled with Lucifer yellow (Fig. 6A, left) or with two Alexa fluor dyes (488 and 568) so that the dendrites of both cells could be distinguished (Fig. 6A, middle and right). An α-β pair is shown at the left, aβ-γ pair is shown in the middle, and two γs are labeled at the right.
Figure 6.
Synchronous firing of neighboring morphologically identified ganglion cells. A, Three examples of filled cell pairs. The first photomicrograph shows an α- and a β-cell (age, P21) filled with Lucifer yellow, as was done in early experiments. In subsequent experiments, two distinct dyes were used [Alexa fluor 568 (red) and 488 (green)] to identify individual cells. Two examples are shown [β-γ, middle age (P16); γ-γ, right (P22)]. Scale bars, 50 μm. B, Recordings from neighboring cell pairs obtained after morphological and physiological differentiation demonstrate that neighboring ganglion cells of all morphological classes burst in a coordinated manner regardless of cell type. The first pair of traces includes a β-cell (top; Vm = -68 mV) and an α-cell (bottom; Vm = -66 mV) from a P21 animal. The second pair includes a γ-cell (top; Vm = -63 mV) and a β-cell (bottom; Vm = -72 mV) from a P19 animal. The spontaneous activity of two γ-cells from a P18 animal is shown in the last pair of traces (Vm for both = -59 mV). Calibration: x, 30 sec; y, 40 mV.
Figure 6B shows the spontaneous activity of three cell pairs:β-α (top two traces), γ-β (middle traces), and γ-γ (bottom traces). Note that in each of these cell pairs bursts occurred coincidentally. This was the case whether the cells were from the same class or from different classes, or whether the cells were active or quiescent between bursts. In total, the activity of 17 pairs of cells was recorded; in 10 of these pairs both cells were morphologically identified. In the other 7 pairs technical difficulties (e.g., dye leakage) precluded morphological classification of one or both of the recorded cells.
Instantaneous spike rates and cross-correlations were computed for all pairs. Three examples are shown in Figure 7. The top pair (Fig. 7A) includes an α- (red) and a β-cell (blue). The next pair (Fig. 7B) includes a β- (blue) and a γ-cell (red). The last pair (Fig. 7C) involves two γ-cells. The peak cross-correlations of all pairs averaged 0.65 ± 0.19 (n = 17). Note that pairs composed of different cell classes appear to exhibit as much synchrony as pairs composed of the same cell class (Fig. 7D). For example, among the pairs that involved a β- and a γ-cell some had peak correlation coefficients higher and others lower than those of pairs that involved two γ-cells. Cross-correlations were also computed for membrane potentials in cell pairs from the youngest age group. The average peak correlation coefficient for these cells was 0.54 ± 0.19 (n = 15). Average correlations in young and old animals were not significantly different (t = -1.46, p = 0.156). (Fig. 7E).
Figure 7.

Correlated activity in neighboring ganglion cells. Instantaneous spike rates and cross-correlations for three morphologically identified cell pairs are shown (A-C). A, An α (red)-β (blue) pair, which had a peak correlation of r = 0.70. B, A β(red)-γ (blue) cell pair with a peak correlation value of r = 0.71. C, Twoγ-cells. These cells had a peak correlation of r = 0.75. D, The peak correlations of all 10 pairs of morphologically identified cells. E, The average peak correlations for all cells in the young (P3-P9) group are compared with those in the older group (P15-P24). The two groups are not statistically different (t = -1.46; p = 0.156).
Discussion
All retinal ganglion cells that we recorded exhibited spontaneous rhythmic activity. This was the case from the earliest stage of development, at P3 (∼45 d after conception) well before the morphological differentiation of these neurons into distinct cell classes. In the youngest retinas studied, some ganglion cells did not manifest spontaneous action potentials, presumably because of the relative immaturity of their spike-generating membrane channels (Skaliora et al., 1993; Wang et al., 1997); yet these cells also showed clear periodic changes in their membrane depolarizations. With age there was an overall decrease in the average interval between bursts, although at any given age the variability in this parameter across cells was substantial. By the end of the second postnatal week, ganglion cells could be classified as α, β, or γ on the basis of their salient morphological features (Wingate et al., 1992; Wingate and Thompson, 1995; Wang et al., 2001), with each cell type characterized by a distinct spontaneous activity pattern. Although all cell classes manifested periodic bursts, α-cells showed substantial interburst activity, γ-cells were virtually silent during the interburst intervals, and β-cells were more variable with respect to interburst activity. Collectively, these observations indicate that the morphological differentiation of retinal ganglion cells into class-specific types is accompanied by functional heterogeneity.
The spontaneous firing patterns exhibited by the three major cells classes could reflect two nonmutually exclusive factors: retinal circuitry and intrinsic membrane properties. In the mature retina, electron microscopic serial reconstructions have shown that α- and β-cells are innervated by different types of bipolar cells (Cohen and Sterling, 1992). Although cells comprising theγ-class have yet to be studied in this manner, it seems reasonable to think that the retinal circuitry of these neurons is also distinct. Interestingly, ribbon synapses characteristic of bipolar cell terminals are established during the second postnatal week (Greiner and Weidman, 1981), at approximately the time when we show that cell-type-specific spontaneous activity patterns first become evident. By contrast, during the earlier developmental period, when only conventional synapses are present in the inner plexi-form layer, the cholinergic inputs of starburst amacrine cells activate low-frequency bursts in the entire population of ganglion cells (Feller et al., 1996; Zhou, 1998).
Distinct spontaneous firing patterns of different classes of ganglion cells could also reflect class-specific differences in the intrinsic membrane properties expressed by these neurons. Studies of the membrane properties of developing ferret and rat ganglion cells have revealed considerable diversity in the membrane conductances of ganglion cells in these species (Wang et al., 1997, 1998, 1999), and class-specific membrane conductances have been documented recently in mature retinal ganglion cells of the cat (O'Brien et al., 2002).
Recordings from spatially adjacent pairs of ganglion cells showed a high degree of synchronous activity that forms the basis of the retinal waves characterized by previous studies (Maffei and Galli-Resta, 1990; Meister et al., 1991; Wong et al., 1993). Interestingly, the correlations observed in paired recordings were relatively constant across the entire developmental period studied. Thus, the youngest pairs of neurons manifested a temporal coincidence in their activity that was not appreciably different from that of more mature cell pairs. During this developmental period the frequency of bursting activity increased significantly.
At later stages of development, after the morphological differentiation of the major cell classes, the degree of synchrony in the overall activity levels exhibited by spatially adjacent pairs of cells was found to exhibit considerable variability. Although our sample of paired recordings from morphologically identified cells is limited (10 pairs), there did not appear to be any obvious relationship of the degree of synchrony with cell class. Thus, cell pairs of the same class did not show a higher correlation coefficient in their overall activity patterns than two cells of a different class. Collectively, these observations suggest that the factors underlying synchronized activity in the developing retina operate on the entire population of cells, independently of their class-specific properties.
Such a conclusion is substantiated by the fact that coordinated bursting of neighboring ganglion cells is seen both before as well as after morphological and physiological differentiation (Feller et al., 1996; Wong et al., 2000), which occurs at approximately the end of the second postnatal week. Early in development, cholinergic amacrine cells are thought to play a key role in driving synchronous bursts in neighboring retinal cells, whereas coordinated retinal activity later in development is thought to be driven by glutamatergic inputs (Feller et al., 1996; Bansal et al., 2000; Wong et al., 2000). Recent work from our laboratory is consistent with this proposed mechanism because early ablation of cholinergic amacrine cells abolished synchronous activity in young neighboring ganglion cells (Huberman et al., 2003). Because coordinated activity is present before the expression of distinct patterns of spontaneous activity by the three major cell classes it is very likely that the mechanisms underlying synchronous activity in neighboring cells are distinct from those underlying the unique patterns of spontaneous activity displayed by α, β, and γ retinal ganglion cells. However, additional work is necessary to delineate these mechanisms fully.
The fact that the degree of synchrony exhibited by cell pairs of the same class was not significantly different from that exhibited by cell pairs of different classes may seem surprising because spontaneous discharges of developing retinal ganglion cells are commonly assumed to mediate activity-based refinements in early retinal ganglion cell projection patterns. Beginning with the third postnatal week, when distinct classes of retinal ganglion cells could be identified morphologically, the segregation of On and Off inputs to the dorsal lateral geniculate nucleus (dLGN) takes place (Cucchiaro and Guillery, 1984; Hahm et al., 1991; Cramer and Sur, 1997). After this period, refinement of projections continues, with individual dLGN cells becoming innervated by a declining number of retinal ganglion cells (Chen and Regehr, 2000; Tavazoie and Reid, 2000). Although it remains to be established precisely what aspects of neuronal activity are critical for a Hebbian-type refinement of early projections, recent computational modeling studies (Lee et al., 2002) indicate that relatively subtle differences in firing patterns, coupled with the right amount of competition within the dLGN, could lead to the segregation of the projections from different cell classes into different layers.
Although we have focused here on measures of synchrony (covariance), it should be noted that the average co-activity between cells is sometimes the more important factor in shaping synaptic development. Because the average co-activity reflects both the degree of synchrony as well as the mean activity (see Materials and Methods), it is possible that differences in the mean activity alone, irrespective of the degree of synchrony, could play an important role in refining connections within the dLGN. Thus, our finding that the three major classes of ganglion cells in the ferret retina exhibit class-specific activity patterns suggests that there are ample activity-dependent cues available for establishing the mature retinogeniculate projection pattern within the dLGN. It remains for future studies to determine which features of the mature retinogeniculate pathway are refined by the class-specific activity patterns manifested by developing retinal ganglion cells.
Footnotes
This work was supported by National Eye Institute (NEI) Grants EY3991 and EY13301 and NEI Core Grant EY125760.
Correspondence should be addressed to Dr. Lauren C. Liets, Section of Neurobiology, Physiology and Behavior, 1 Shields Avenue, University of California, Davis CA 95616. E-mail: lcliets@ucdavis.edu.
Copyright © 2003 Society for Neuroscience 0270-6474/03/237343-08$15.00/0
References
- Bansal A, Singer JH, Hwang BJ, Xu W, Beaudet A, Feller MB ( 2000) Mice lacking specific nicotinic acetylcholine receptor subunits exhibit dramatically altered spontaneous activity patterns and reveal a limited role for retinal waves in forming ON and OFF circuits in the inner retina. J Neurosci 20: 7672-7681. [DOI] [PMC free article] [PubMed] [Google Scholar]
- Catsicas M, Bonness V, Becker D, Mobbs P ( 1998) Spontaneous Ca 2+ transients and their transmission in the developing chick retina. Curr Biol 8: 283-286. [DOI] [PubMed] [Google Scholar]
- Chen C, Regehr WG ( 2000) Developmental remodeling of the retinogeniculate synapse. Neuron 28: 955-966. [DOI] [PubMed] [Google Scholar]
- Cohen E, Sterling P ( 1992) Parallel circuits from cones to the On-beta ganglion cell. Eur J Neurosci 4: 506-520. [DOI] [PubMed] [Google Scholar]
- Cramer KS, Sur M ( 1997) Blockade of afferent impulse activity disrupts on/off sublamination in the ferret lateral geniculate nucleus. Brain Res Dev Brain Res 98: 287-290. [DOI] [PubMed] [Google Scholar]
- Cucchiaro J, Guillery RW ( 1984) The development of the retinogeniculate pathways in normal and albino ferrets. Proc R Soc Lond B Biol Sci 223: 141-164. [DOI] [PubMed] [Google Scholar]
- Dann JF, Buhl EH, Peichl L ( 1988) Postnatal dendritic maturation of alpha and beta ganglion cells in cat retina. J Neurosci 8: 1485-1499. [DOI] [PMC free article] [PubMed] [Google Scholar]
- Feller MB, Wellis DP, Stellwagen D, Werblin FS, Shatz CJ ( 1996) Requirement for cholinergic synaptic transmission in the propagation of spontaneous retinal waves. Science 272: 1182-1187. [DOI] [PubMed] [Google Scholar]
- Fitzgibbon T, Wingate RJ, Thompson ID ( 1996) Soma and axon diameter distributions and central projections of ferret retinal ganglion cells. Vis Neurosci 13: 773-786. [DOI] [PubMed] [Google Scholar]
- Galli L, Maffei L ( 1988) Spontaneous impulse activity of rat retinal ganglion cells in prenatal life. Science 242: 90-91. [DOI] [PubMed] [Google Scholar]
- Greiner JV, Weidman TA ( 1981) Histogenesis of the ferret retina. Exp Eye Res 33: 315-332. [DOI] [PubMed] [Google Scholar]
- Hahm JO, Langdon RB, Sur M ( 1991) Disruption of retinogeniculate afferent segregation by antagonists to NMDA receptors. Nature 351: 568-570. [DOI] [PubMed] [Google Scholar]
- Huberman AD, Wang, GY, Liets, LC, Collins, OA, Chapman, B, Chalupa LM ( 2003) Eye-specific retinogeniculate segregation independent of normal neuronal activity. Science 300: 994-998. [DOI] [PMC free article] [PubMed] [Google Scholar]
- Lee CW, Eglen SJ, Wong RO ( 2002) Segregation of ON and OFF retinogeniculate connectivity directed by patterned spontaneous activity. J Neurophysiol 88: 2311-2321. [DOI] [PubMed] [Google Scholar]
- MacKay DJC, Miller KD ( 1990) Analysis of Linsker's simulation of Hebbian rules. Neural Comp 2: 173-187. [Google Scholar]
- Maffei L, Galli-Resta L ( 1990) Correlation in the discharges of neighboring rat retinal ganglion cells during prenatal life. Proc Natl Acad Sci USA 87: 2861-2864. [DOI] [PMC free article] [PubMed] [Google Scholar]
- Masland RH ( 1977) Maturation of function in the developing rabbit retina. J Comp Neurol 175: 275-286. [DOI] [PubMed] [Google Scholar]
- Meister M, Wong RO, Baylor DA, Shatz CJ ( 1991) Synchronous bursts of action potentials in ganglion cells of the developing mammalian retina. Science 252: 939-943. [DOI] [PubMed] [Google Scholar]
- O'Brien BJ, Isayama T, Richardson R, Berson DM ( 2002) Intrinsic physiological properties of cat retinal ganglion cells. J Physiol (Lond) 538: 787-802. [DOI] [PMC free article] [PubMed] [Google Scholar]
- Ramoa AS, Campbell G, Shatz CJ ( 1988) Dendritic growth and remodeling of cat retinal ganglion cells during fetal and postnatal development. J Neurosci 8: 4239-4261. [DOI] [PMC free article] [PubMed] [Google Scholar]
- Reese BE, Thompson WF, Peduzzi JD ( 1994) Birthdates of neurons in the retinal ganglion cell layer of the ferret. J Comp Neurol 341: 464-475. [DOI] [PubMed] [Google Scholar]
- Roe AW, Garraghty PE, Sur M ( 1989) Terminal arbors of single ON-center and OFF-center X and Y retinal ganglion cell axons within the ferret's lateral geniculate nucleus. J Comp Neurol 288: 208-242. [DOI] [PubMed] [Google Scholar]
- Skaliora I, Scobey RP, Chalupa LM ( 1993) Prenatal development of excitability in cat retinal ganglion cells: action potentials and sodium currents. J Neurosci 13: 313-323. [DOI] [PMC free article] [PubMed] [Google Scholar]
- Sterling P ( 2003) How retinal circuits optimize the transfer of visual information. In: The visual neurosciences. (Chalupa LM, Werner JS, eds), pp 234-259. Cambridge, MA: MIT press.
- Stryker MP, Zahs KR ( 1983) On and off sublaminae in the lateral geniculate nucleus of the ferret. J Neurosci 3: 1943-1951. [DOI] [PMC free article] [PubMed] [Google Scholar]
- Sur M, Esguerra M, Garraghty PE, Kritzer MF, Sherman SM ( 1987) Morphology of physiologically identified retinogeniculate X- and Y-axons in the cat. J Neurophysiol 58: 1-32. [DOI] [PubMed] [Google Scholar]
- Tavazoie SF, Reid RC ( 2000) Diverse receptive fields in the lateral geniculate nucleus during thalamocortical development. Nat Neurosci 3: 608-616. [DOI] [PubMed] [Google Scholar]
- Wang GY, Ratto G, Bisti S, Chalupa LM ( 1997) Functional development of intrinsic properties in ganglion cells of the mammalian retina. J Neurophysiol 78: 2895-2903. [DOI] [PubMed] [Google Scholar]
- Wang GY, Robinson DW, Chalupa LM ( 1998) Calcium-activated potassium conductances in retinal ganglion cells of the ferret. J Neurophysiol 79: 151-158. [DOI] [PubMed] [Google Scholar]
- Wang GY, Olshausen BA, Chalupa LM ( 1999) Differential effects of apamin- and charybdotoxin-sensitive K+ conductances on spontaneous discharge patterns of developing retinal ganglion cells. J Neurosci 19: 2609-2618. [DOI] [PMC free article] [PubMed] [Google Scholar]
- Wang GY, Liets LC, Chalupa LM ( 2001) Unique functional properties of On and Off pathways in the developing mammalian retina. J Neurosci 21: 4310-4317. [DOI] [PMC free article] [PubMed] [Google Scholar]
- Wingate RJ, Thompson ID ( 1995) Axonal target choice and dendritic development of ferret beta retinal ganglion cells. Eur J Neurosci 7: 723-731. [DOI] [PubMed] [Google Scholar]
- Wingate RJ, Fitzgibbon T, Thompson ID ( 1992) Lucifer yellow, retrograde tracers, and fractal analysis characterise adult ferret retinal ganglion cells. J Comp Neurol 323: 449-474. [DOI] [PubMed] [Google Scholar]
- Wong RO ( 1999) Retinal waves and visual system development. Annu Rev Neurosci 22: 29-47. [DOI] [PubMed] [Google Scholar]
- Wong RO, Meister M, Shatz CJ ( 1993) Transient period of correlated bursting activity during development of the mammalian retina. Neuron 11: 923-938. [DOI] [PubMed] [Google Scholar]
- Wong RO, Chernjavsky A, Smith SJ, Shatz CJ ( 1995) Early functional neural networks in the developing retina. Nature 374: 716-718. [DOI] [PubMed] [Google Scholar]
- Wong WT, Sanes JR, Wong RO ( 1998) Developmentally regulated spontaneous activity in the embryonic chick retina. J Neurosci 18: 8839-8852. [DOI] [PMC free article] [PubMed] [Google Scholar]
- Wong WT, Myhr KL, Miller ED, Wong RO ( 2000) Developmental changes in the neurotransmitter regulation of correlated spontaneous retinal activity. J Neurosci 20: 351-360. [DOI] [PMC free article] [PubMed] [Google Scholar]
- Zhou ZJ ( 1998) Direct participation of starburst amacrine cells in spontaneous rhythmic activities in the developing mammalian retina. J Neurosci 18: 4155-4165. [DOI] [PMC free article] [PubMed] [Google Scholar]