

Abstract
Locally projecting GABAergic interneurons are the major providers of inhibition in the neocortex and play a crucial role in several brain functions. Neocortical interneurons are connected via electrical and chemical synapses that may be crucial in modulating complex network oscillations. We investigated the properties of spontaneous and evoked IPSCs in two morphologically and physiologically identified interneuron subtypes, the fast-spiking (FS) and low threshold-spiking (LTS) cells in layer V of rodent sensorimotor cortex. We found that IPSCs recorded in FS cells were several orders of magnitude more frequent, larger in amplitude, and had faster kinetics than IPSCs recorded in LTS cells. GABAA receptor α- and β-subunit selective modulators, zolpidem and loreclezole, had different effects on IPSCs in FS and LTS interneurons, suggesting differential expression of GABAA receptor subunit subtypes. These pharmacological data indicated that the α1 subunit subtype is poorly expressed by LTS cells but makes a large contribution to GABAA receptors on FS cells. This was confirmed by experiments performed in genetically modified mice in which the α1 subunit had been made insensitive to benzodiazepine-like agonists. These results suggest that differences in IPSC waveform are likely attributable to distinctive expression of GABAA receptor subunits in FS and LTS cells. The particular properties of GABAergic input on different interneuronal subtypes might have important consequences for generation and pacing of cortical rhythms underlying several brain functions. Moreover, selective pharmacological manipulation of distinct inhibitory circuits might allow regulation of pyramidal cell activities under specific physiological and pathophysiological conditions.
Keywords: interneurons, neocortex, synaptic transmission, GABA, GABAA receptors, inhibition
Introduction
In the neocortex, inhibitory GABAergic interneurons make up a small percentage (∼25%) of the entire neuronal population (Hendry et al., 1987; Benardo and Wong, 1995). Yet, their activity is crucial for cortical function, because they represent the basic elements that provide cortical feedforward and feedback inhibition, entrain and shape several types of cortical oscillations underlying various brain functions (McBain and Fishan, 2001), and prevent development of hyperexcitability and epileptiform activity (for review, see Prince, 1999).
Multiple subtypes of neocortical interneurons can be differentiated on the basis of their electrophysiological characteristics, expression of calcium-binding proteins, and neuropeptides, as well as axonal and dendritic arborization morphologies (Kawaguchi and Kubota, 1993, 1997, 1998; Cauli et al., 1997; Xiang et al., 1998a; Gupta et al., 2000). Different classes of interneurons are known to form synaptic contacts on different domains of pyramidal cells in both the neocortex (DeFelipe et al., 1989; Deuchars and Thomson, 1995; Thomson et al., 1996; Tamas et al., 1997a; Xiang et al., 2002) and hippocampus (Halasy et al., 1996; Miles et al., 1996; Maccaferri et al., 2000), suggesting distinct inhibitory roles played by different interneuronal subtypes. In addition, neocortical and hippocampal interneurons are interconnected via gap junctions (Galarreta and Hestrin, 1999, 2001; Gibson et al., 1999; Tamas et al., 2000) and chemical synapses (Hajos and Mody, 1997; Tamas et al., 2000, Bartos et al., 2001; Szabadics et al., 2001) and also innervate themselves via autapses (Cobb et al., 1997; Tamas et al., 1997b; Bacci et al., 2003). Neocortical interneurons form distinct GABAergic networks in which cells belonging to a particular subtype tend to couple to each other more strongly through electrical and chemical synapses (Tamas et al., 1998; Gibson et al., 1999; Beierlein et al., 2000). Moreover, functional autaptic self-innervation seems to be a peculiarity of the fast-spiking basket cells (Tamas et al., 1997b; Bacci et al., 2003). The strength, spatial extent, and anatomical localization of the connections between interneurons may be crucial in modulating complex network oscillations (Beierlein et al., 2000; Tamas et al., 2000; Szabadics et al., 2001), involving the mutually interconnected GABAergic interneurons and glutamatergic pyramidal cells.
To better appreciate the role of subclasses of interneurons in controlling cortical excitability and sustaining different cortical network activities, it is crucial to examine the properties of inhibitory neurotransmission among GABAergic cells themselves. There are differences in GABAergic neurotransmission onto principal glutamatergic cells in the neocortex that are dependent on the interneuronal subtype (Xiang et al., 1998b), and variations in properties of IPSCs from basket cells onto granule cells versus other basket cells are present in the dentate gyrus of the hippocampus (Bartos et al., 2001). However, little is known about the properties of inhibitory synaptic transmission between different types of interneurons in the neocortex. Although there is some evidence of heterogeneity of GABAergic neurotransmission in different classes of interneurons in the hippocampus (Hajos and Mody, 1997; Thomson et al., 2000), it is still controversial whether this might depend on different degrees of electrotonic filtering versus different GABAA receptor subunit assemblies in distinct interneuron subclasses.
We performed whole-cell recordings from two physiologically identified interneuron subtypes, fast-spiking (FS) and low threshold-spiking (LTS) cells, from layer V of rat and mouse neocortex and found a striking difference in both evoked IPSC (eIPSC) and spontaneous IPSC (sIPSC) kinetics between these cell types. These profound differences are at least partially attributable to a differential expression of GABAA receptor subunit composition in the two interneuron subtypes, as revealed by a pharmacological analysis and the use of gene-targeted mice with a mutated GABAA receptor subunit.
Materials and Methods
In vitro slice preparation and electrophysiology. Postnatal day 13 (P13)-P21 Sprague Dawley rats were deeply anesthetized with pentobarbital (50 mg/kg.), decapitated, and brains were removed and immersed in cold “cutting” solution (4°C) containing the following (in mm): 234 sucrose, 11 glucose, 24 NaHCO3, 2.5 KCl, 1.25 NaH2PO4, 10 MgSO4, and 0.5 CaCl2, gassed with 95% O2/5% CO2. Coronal slices (300 μm) were cut with a vibratome from a block of brain containing the sensorimotor cortex. Slices were then incubated in oxygenated artificial CSF (ACSF) containing the following (in mm): 126 NaCl, 26 NaHCO3, 2.5 KCl, 1.25 NaH2PO4, 2 MgSO4, 2 CaCl2, and 10 glucose, pH 7.4, initially at 32°C for 1 hr and subsequently at room temperature before being transferred to the recording chamber and maintained at 32°C. Identical slicing procedures were used for either mutant (see Results for additional description) or wild-type mice (129/SvJ strain). Ages of mice were P28-P32 for both knock-in and wild-type animals. Recordings were obtained from layer V interneurons visually identified using infrared video microscopy. Experiments in rats are those reported in Figures 1, 2, 3, 4, 5, 6, 7, 8, and experiments in mice are those reported in Figure 9. Firing behavior in current clamp, together with the absence of a large emerging apical dendrite, was used to distinguish interneurons from pyramidal cells. Intracellular labeling with biocytin was used to confirm the interneuronal morphology in some cells (see Fig. 1). Experiments were performed in the whole-cell configuration of the patch-clamp technique. Electrodes (tip resistance, 2-3 MΩ) were filled with an intracellular solution containing the following (in mm): 70 Kgluconate, 70 KCl, 2 NaCl, 10 HEPES, 4 EGTA, 4 MgATP, 0.3 Na2GTP, pH 7.3, corrected with KOH; 290 mOsm. The estimated ECl was approximately -16 mV, on the basis of the Nernst equation, without correction for gluconate-generated liquid junction potential. Under these recording conditions, activation of GABAA receptors resulted in inward currents at a holding potential (Vh) of -70 mV. Drugs were delivered using a local perfusion system composed of multiple fine tubes ending in a common outlet tube and positioned in proximity (∼250 μm) to the recorded neuron. IPSCs were isolated by including 10 μm 6,7-dinitroquinoxaline-2,3-dione (DNQX) and 100 μmdl-2-amino-7-phosphonovalerate (dl-APV) in the bath and local perfusate. Loreclezole and zolpidem were applied for 10-15 min after a 4-8 min period of stable control recording. dl-APV, DNQX, and loreclezole were from Tocris Cookson (Ballwin, MO), and zolpidem was from Sigma (St. Louis, MO). Extracellular stimuli consisting of constant current pulses, 50-130 μsec in duration and 100-500 μA in amplitude, were delivered at low frequencies (0.3 Hz) via a concentric bipolar electrode (tip diameter, 75 μm; CB-XRC75; Frederick Haer Company, Bowdoinham, ME) positioned intracortically close to the recorded neuron. Intensities were adjusted to ∼2.5 × threshold for evoking a monosynaptic IPSC. Signals were amplified using a Multiclamp 700A patch-clamp amplifier (Axon Instruments, Union City, CA), sampled at 10 KHz, filtered at 5 KHz unless otherwise noted, and stored on a computer.
Figure 1.
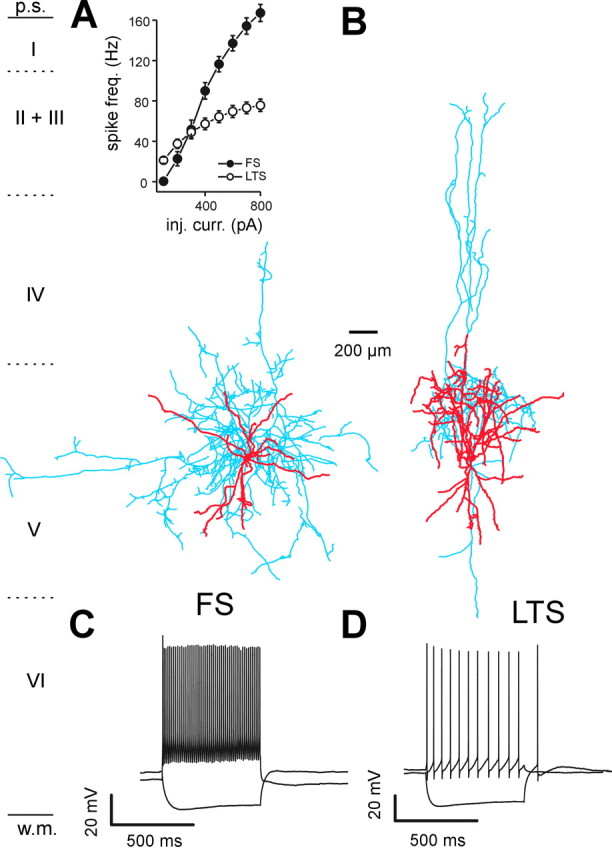
Different morphological and physiological properties of FS and LTS interneurons. A, A biocytin-filled and reconstructed FS interneuron in neocortical layer V. The cell body and dendrites are marked in red, and the axon is marked in blue. Note that the extensive axonal arborization in the perisomatic region is shown. B, Biocytin-filled and reconstructed LTS cell. The color code is the same as in A. Note that the less extensive axonal plexus around the cell body and the more prominent, vertically oriented, axonal arborization extending toward the more superficial cortical layers are shown. Inset, Plot of mean firing frequencies in response to injected currents of different amplitudes in FS (solid circles) and LTS (open circles) interneurons. Current injections were 600 msec. Note that the cell-specific difference in firing frequency at almost every current injection level is shown. C, Current-clamp recording of firing behavior of the cell in A. A depolarizing current injection (600 pA; 600 msec) evoked a high-frequency spike-firing pattern with little adaptation, and a hyperpolarizing current injection (-300 pA; 600 msec) did not elicit rebound spikes. D, Current-clamp recording of firing behavior of the cell in B. The cell responded with a rebound spike after a hyperpolarizing current injection (-300 pA; 600 msec; see also rebound burst response of LTS cell in Fig. 2 A) and a depolarizing pulse (500 pA; 600 msec) evoked action potentials with a lower frequency and a more evident spike frequency accommodation than the FS cell in A and C. Note that the pronounced spike afterhyperpolarization in the LTS interneuron is shown. VM, -65 (C), -60 mV (D).
Figure 2.

Different decay properties of evoked GABAergic synaptic transmission in FS and LTS interneurons. A, Current-clamp recordings from an FS (left) and an LTS (right) interneuron that show responses to depolarization and hyperpolarization similar to those of the neurons in Figure 1, C and D. Current pulses (600 msec long), -300 and 500 pA (left), -300 and 300 pA (right). VM, -70 and -66 mV in the FS and LTS neurons, respectively. B, Extracellularly evoked IPSCs isolated in dl-APV (100 μm) and DNQX (10 μm) in the FS and LTS cells in A. The traces are the average of 20 individual suprathreshold responses in both cases. The gray lines are the double-exponential fits of the decay phases of mean synaptic responses. C, Traces of B, scaled to the peak amplitude and superimposed. Note that the large difference in the decay phases in the two interneuron species is shown. D, Graphs of average half-width (left) and τd,w (right) in FS (black bars; n = 19) and LTS (white bars; n = 16) interneurons (***p < 0.00005; **p < 0.004; independent t test).
Figure 3.

FS and LTS interneurons show different sIPSC characteristics. A, B, Representative continuous recordings of sIPSCs from an FS (A) and an LTS (B) interneuron in dl-APV and DNQX. C, D, The GABAA receptor antagonist gabazine (10 μm) completely abolished spontaneous activity in both cell types. Calibration: (A-D) 100 pA, 200 msec. E, Cumulative distribution plots for sIPSC inter-event intervals, amplitudes, and half-widths in FS (solid lines) and LTS interneurons (dashed lines) in A and B. Note that the profound differences in sIPSC frequency, amplitude, and waveform are shown. Number of events in E: 2410 and 450 in FS and LTS, respectively.
Figure 4.
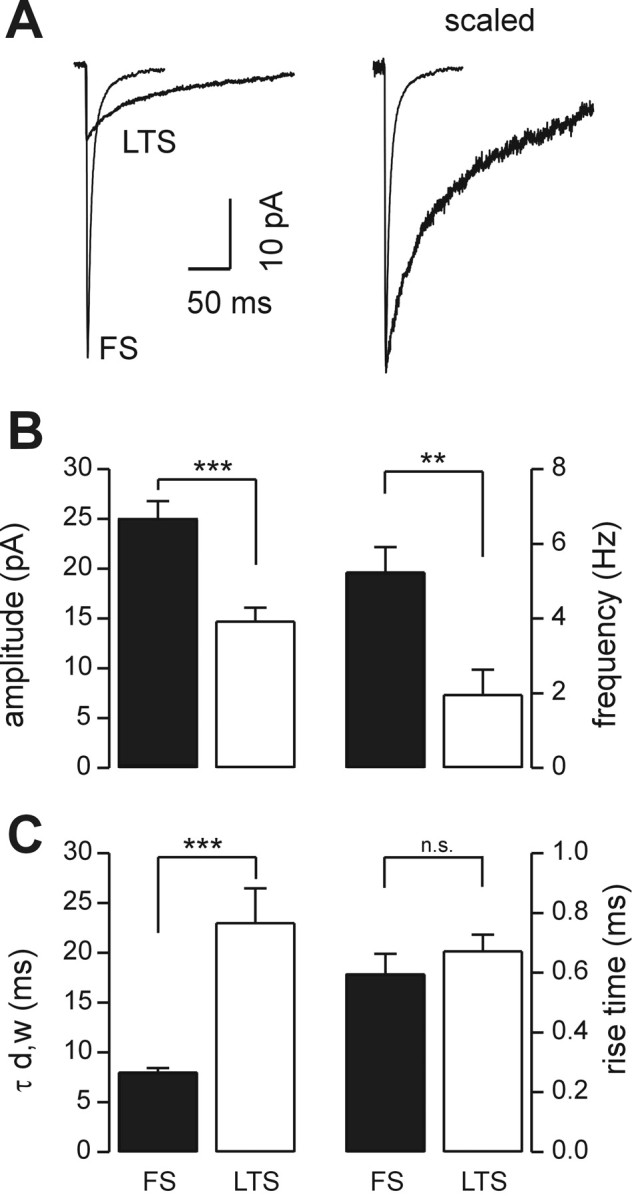
Amplitude and kinetic properties of sIPSCs in FS and LTS interneurons. A, Left, Superimposed traces of averaged sIPSCs recorded from FS and LTS cells in Figure 2, A and B. (FS: n = 230 events; LTS: n = 180 events). A, Right, The same averaged traces scaled to the peak of the mean FS current response. Note that the large difference in decay phases in the two interneuron subtypes is shown. B, Graphs of the average sIPSC amplitude (left) and frequency (right) in FS (black bars; n = 17) and LTS (white bars; n = 17) interneurons. C, Graphs of the average sIPSC weighted decay time constant (τd,w; left) and rise time (right) in FS (black bars) and LTS (white bars) interneurons (n = 17 in both cell types for τd,w; n = 9 in both cell types for the rise time; ***p < 0.0002; **p < 0.002; independent t test; n.s., difference not statistically significant). On average, FS interneurons have faster, larger amplitude and more frequent sIPSCs than LTS cells; however, rise times are not different.
Figure 5.
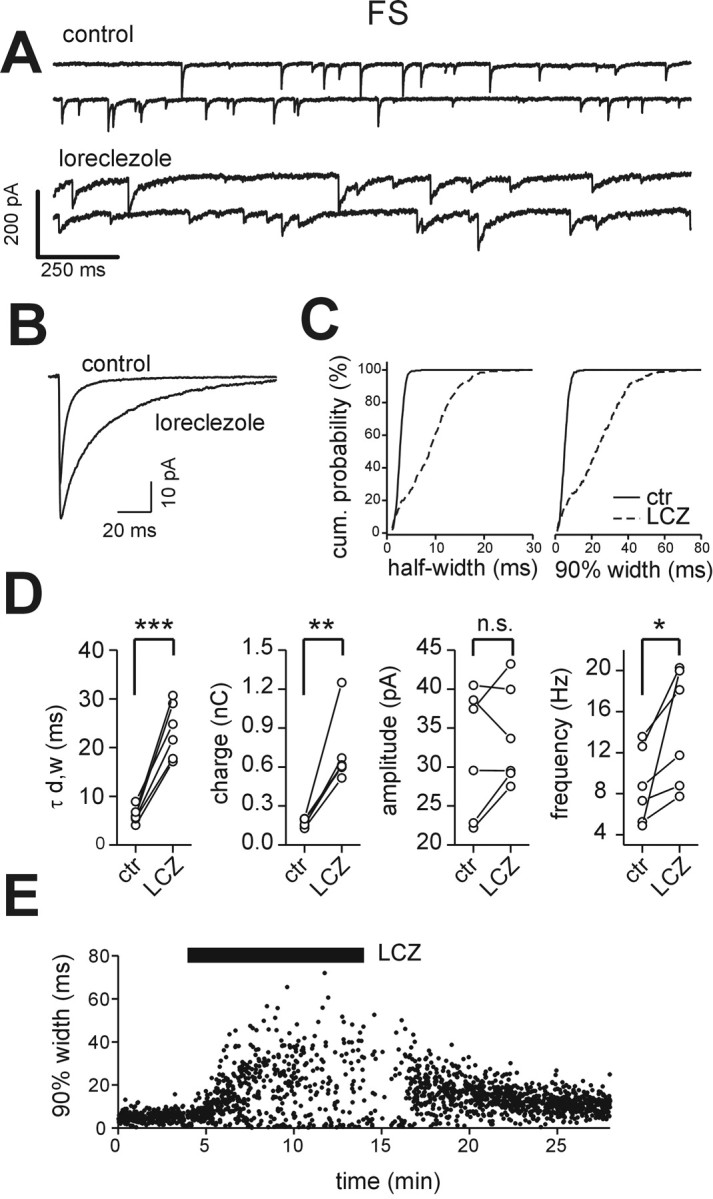
Effects of loreclezole on sIPSCs in FS interneurons. A, Representative traces of sIPSCs recorded from an FS interneuron in control (top traces) and in the presence of 10 μm loreclezole (bottom traces). Loreclezole greatly increased IPSC duration. B, Superimposed averaged sIPSC traces in control (n = 230) and in loreclezole (n = 250) for the cell in A. C, Cumulative probability distribution of sIPSC half-width (left; 277 events in control; 268 events in loreclezole) and 90% decay (right; 277 events in control; 268 events in loreclezole) for the cell in A. Solid lines, Control (ctr); dashed lines, loreclezole (LCZ). D, Graphs of sIPSC weighed decay time constant (τd,w), charge, amplitude, and frequency in all cells tested. Lines connect values in each cell before and after loreclezole. ***p < 0.0004; **p < 0.004; *p < 0.05; n.s., no significant difference; paired t test. E, Time course of the effect of loreclezole on sIPSC 90% decay time in an FS interneuron. Each dot represents an individual IPSC. The black bar indicates the time of drug application. Note the relative fast onset of the loreclezole-mediated effect and partial reversal during the wash-out.
Figure 6.

Effect of loreclezole on sIPSCs in LTS interneurons. A, Representative traces of sIPSCs recorded from an LTS interneuron in control (top traces) and in the presence of 10 μm loreclezole (bottom traces). Loreclezole increased IPSC durations. B, Superimposed averaged sIPSC traces in control (n = 200) and loreclezole (n = 180). C, Cumulative probability distribution of sIPSC half-width (left) and 90% decay (right) for the cell in A, in control (ctr; solid lines) and in the presence of loreclezole (LCZ; dashed lines). There were 191 and 248 events in control and loreclezole, respectively. D, Graphs of sIPSC weighted decay time constant (τd,w), charge, amplitude, and frequency in all cells tested in control and loreclezole. Lines connect values before and after loreclezole in each neuron. *p < 0.02; n.s., no significant difference; paired t test.
Figure 7.
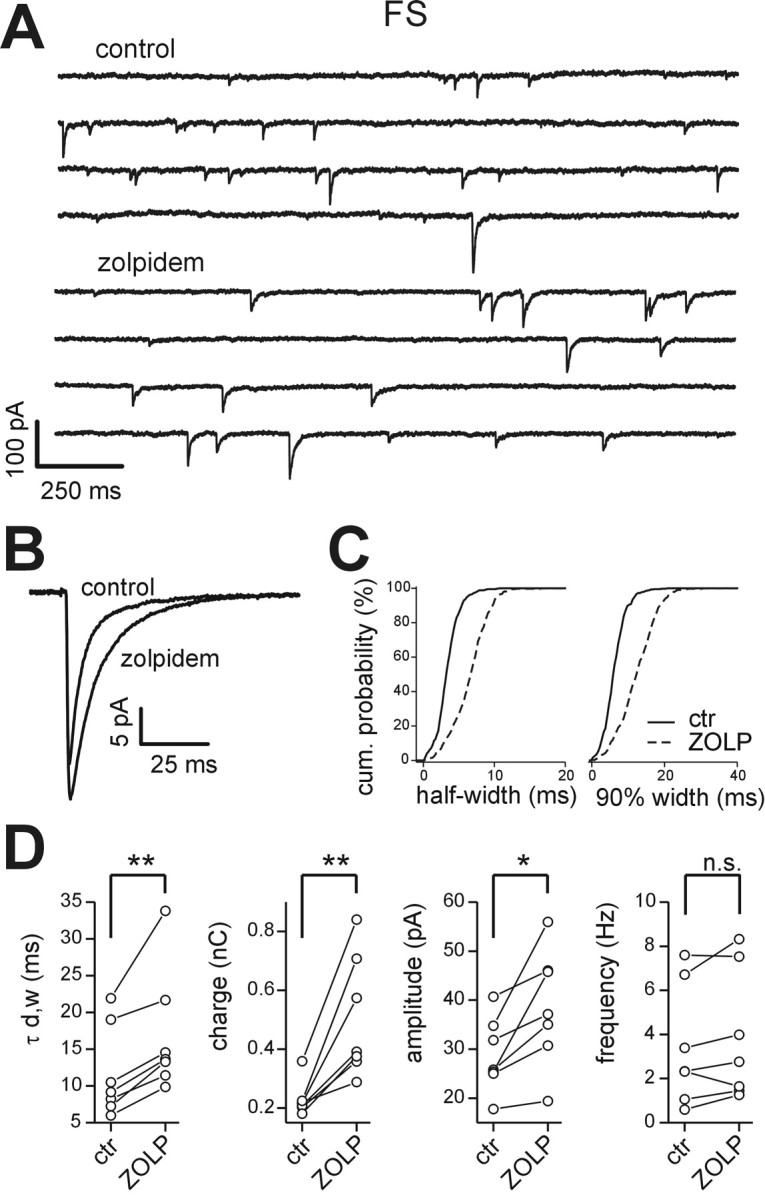
Effects of zolpidem on sIPSCs in FS interneurons. A, Representative traces of sIPSCs recorded from an FS interneuron in control (top continuous traces) and in the presence of 200 nm zolpidem (bottom traces). Zolpidem increased IPSC duration. B, Superimposed averaged sIPSC traces in control (n = 300) and in loreclezole (n = 300). C, Cumulative probability distribution of sIPSC half-width (left) and 90% decay (right) for the FS cell in A, in control (ctr; solid lines) and in the presence of zolpidem (ZOLP; dashed lines). There were 437 and 438 events in control and zolpidem, respectively. D, Graphs of sIPSC weighted decay time constant (τd,w), charge, amplitude, and frequency in all cells tested in control and zolpidem. Lines connect values before and after zolpidem in each neuron. **p < 0.005; *p < 0.05; n.s., no significant difference; paired t test.
Figure 8.
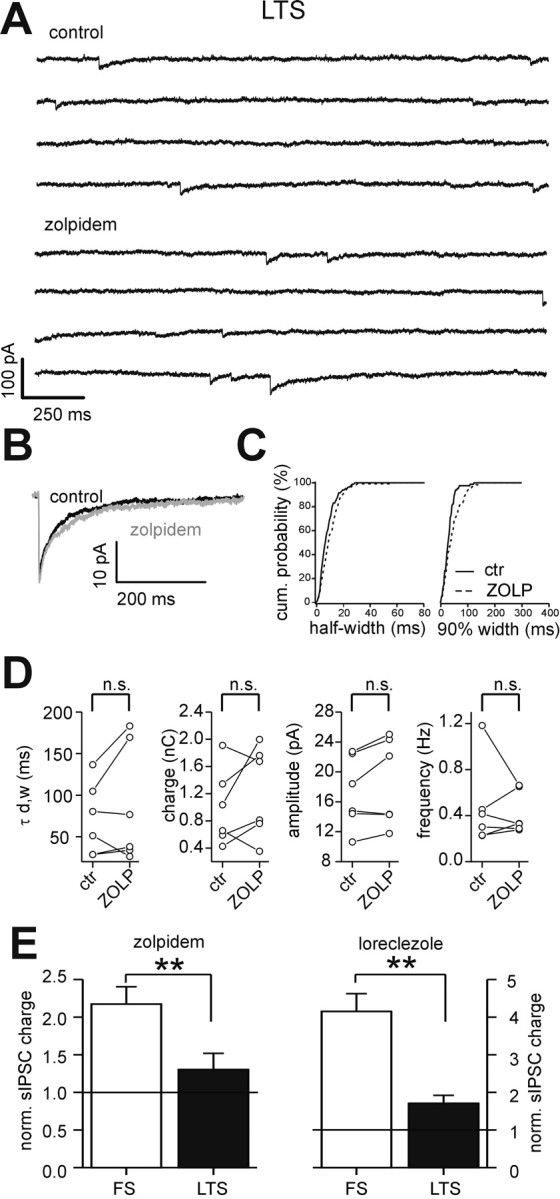
Effects of zolpidem on sIPSCs in LTS interneurons. A, Representative traces of sIPSCs recorded from an LTS interneuron in control (top traces) and in the presence of 200 nm zolpidem (bottom traces). Zolpidem did not modify IPSC waveform. B, Superimposed averaged sIPSC traces in control (black trace; n = 150) and in zolpidem (gray trace; n = 150). C, Cumulative probability distribution of sIPSC half-width (left) and 90% decay (right) for the LTS cell in A, in control (ctr; solid lines) and in the presence of zolpidem (ZOLP; dashed lines). There were 79 and 76 events in control and zolpidem, respectively. D, Graphs of sIPSC weighted decay time constant (τd,w), charge, amplitude, and frequency in all cells tested in control and zolpidem. Lines connect values before and after zolpidem in each neuron. n.s., No significant difference; paired t test. E, Graphs showing the mean relative change in sIPSC charge produced by 200 nm zolpidem (left) and 10 μm loreclezole (right) in FS (white bars) and LTS interneurons (black bars). Each drug produced significantly different modulation in the two cell types (**p < 0.01; independent t test).
Figure 9.
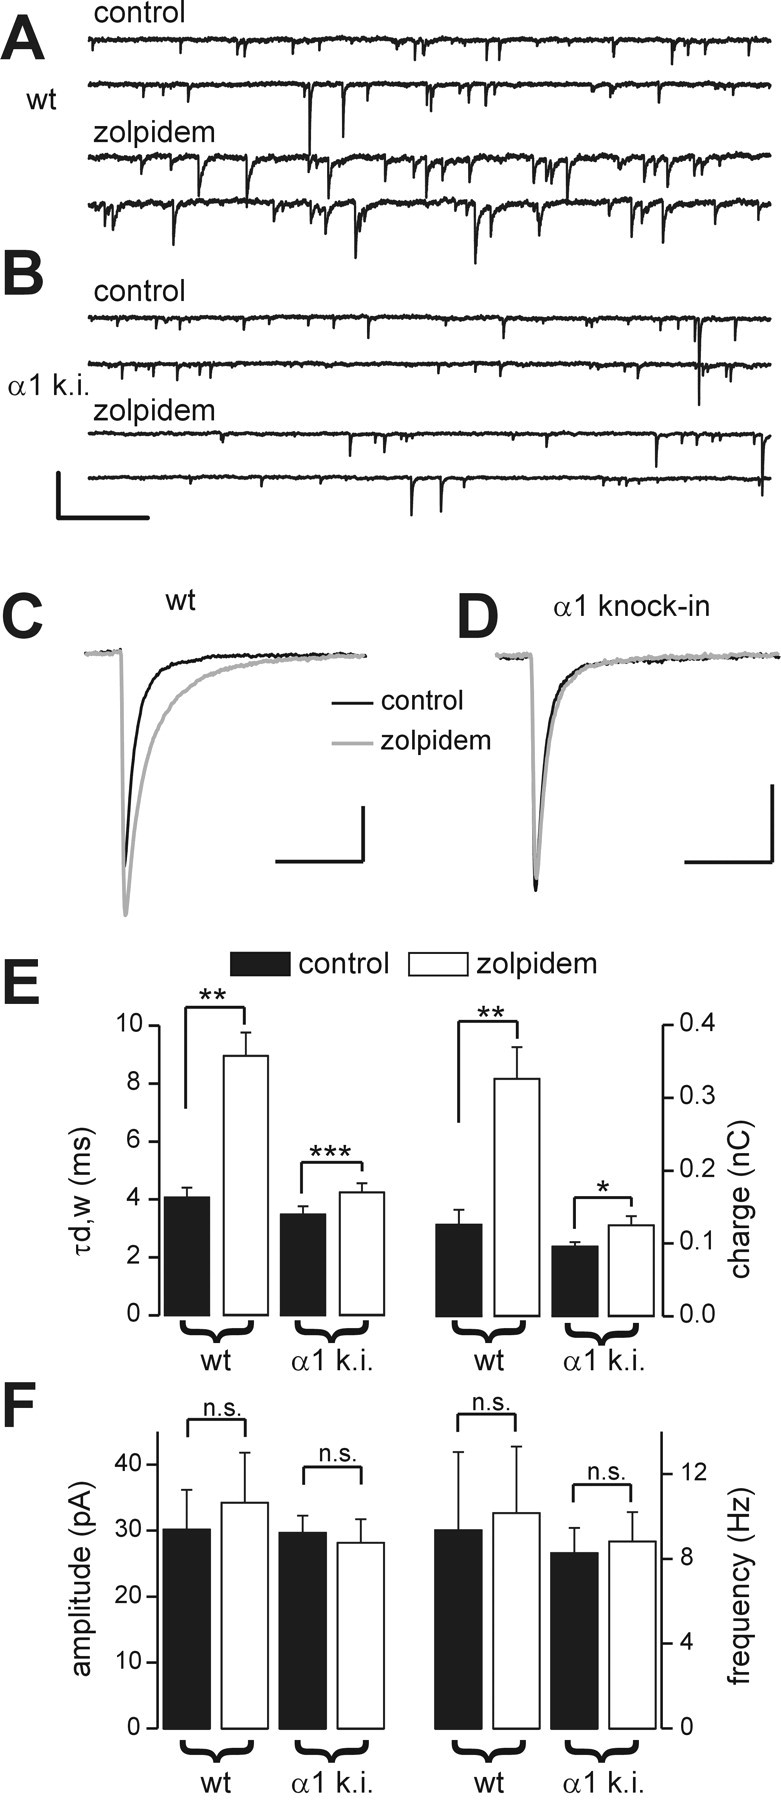
Effects of zolpidem on sIPSCs in FS interneurons of wild-type and α1(H101R) knock-in mice. A, Representative traces of sIPSCs recorded from an FS interneuron in a wild-type (wt) mouse in control (top traces) and in the presence of zolpidem (bottom traces). B, Representative traces of sIPSCs recorded from an FS interneuron in a mutated mouse (α1 k.i.) in control (top traces) and in the presence of 200 nm zolpidem (bottom traces). Calibration: (A, B) 200 pA, 500 msec. C, Superimposed averaged sIPSC traces in control (black trace; n = 280) and in zolpidem (gray trace; n = 310) in the wild-type mouse (same cell as in A). Calibration: 10 pA, 20 msec. D, Superimposed averaged sIPSC traces in control (black trace; n = 300) and in zolpidem (gray trace; n = 325) in the α1 knock-in mouse (same cell as in B). Calibration: 10 pA, 20 msec. E, Graphs of mean sIPSC τd,w (left) and charge (right) in wild-type and α1 knock-in (α1 k.i.) mice in control (black bars) and in the presence of zolpidem (white bars). ***p < 0.001; **p < 0.01; *p < 0.05; paired t test. F, Graphs of mean sIPSC amplitude (left) and frequency (right) in wild-type and α1 knock-in mice in control (black bars) and in the presence of zolpidem (white bars). n.s., No significant difference; paired t test; n = 4 and 9 for wild-type and α1 knock-in mice, respectively.
Data analysis. Locally written software [Detector, WinScanSelect (J.R.H.)] and PClamp software (Axon Instruments) were used to detect, sort, and measure sIPSCs, which were divided into three subtypes: type I events were isolated sIPSCs, the rising and decay phases of which did not overlap other events; type II events were followed by sIPSCs on their decay phase; and type III events were those rising on the decay phase of a previous IPSC (Ulrich and Huguenard, 1996). Aligned sIPSCs were scanned and pure type I events were sorted out and saved. The absence of type II or III events was also carefully checked manually. Rise times, half-widths, and 90% widths were measured from pure type I events. Several hundred aligned type I events were averaged, and the peak-to-baseline decay phase of the resulting trace was fitted by the following double exponential function:
 |
1 |
where Afast and Aslow are the fast and slow amplitude components, and τfast and τslow are the fast and slow decay time constants, respectively. The weighted decay time constant (τd,w) was calculated using the following equation:
 |
2 |
The mean charge transfer was calculated by integrating the averaged type I sIPSC traces. Mean sIPSC frequency was measured from the reciprocal of the inter-event intervals of all three event types averaged in 10-30 sec bins over a 4-8 min time period. Mean sIPSC amplitudes were measured from all event types as well.
Results are presented as means ± SEM. Unless otherwise noted, the paired Student's t test was used to compare data before and after drug applications among the same cell populations, and the independent Student's t test was used to compare data derived from different interneuronal populations (FS vs LTS comparisons). Differences were considered significant if p < 0.05.
Histology. Biocytin (0.05%; Sigma) was included in the internal solution to fill neurons during electrophysiological recordings. Slices were subsequently fixed overnight in 4% paraformaldehyde in phosphate buffer (PB; pH 7.4) at 4°C before they were cut into 40 μm thick serial sections on a Zeiss (Thornwood, NY) sliding microtome and collected in PB. Slices were rinsed with PBS and permeabilized with a solution containing 0.25% Triton X-100 and 0.5% bovine serum albumin (BSA). Slices were then incubated overnight with ABC solution (Vector Laboratories, Bulingame, CA) with 0.1% Triton X-100 and 0.2% BSA. After three rinses in PBS, slices were incubated with 0.8% 3′3′ diaminobenzidine (DAB; Sigma) with NiNH4SO4 and 0.3% H2O2 in Tris buffer. The reaction was terminated by rinsing with Tris-saline, and sections were mounted and coverslipped with mounting media. Somatodendritic and axonal compartments of biocytin-filled neurons were reconstructed using Neurolucida software (MicroBrightField, Williston, VT).
Results
Different properties of evoked GABAergic neurotransmission on FS and LTS interneurons
We performed patch-clamp whole-cell recordings from visually identified interneurons in layer V of rat sensorimotor neocortex. Under infrared videomicroscopy, interneurons were distinguished from pyramidal cells by their appearance as round, bipolar, or multipolar cells with small somata and the lack of a thick apical dendrite oriented toward the pia (Bacci et al., 2002, 2003). The firing behavior of neurons was characterized in current clamp using 600 msec depolarizing DC injections of different amplitudes and, on the basis of their membrane and firing properties, they could be classified into FS and LTS interneurons. Analysis of FS and LTS cells revealed large differences in single action potential half-width and afterhyperpolarization amplitude (Table 1). In addition, FS cells were characterized by much higher firing frequencies, more prominent spike frequency adaptation, and lower input resistance than LTS interneurons (Figs. 1C,D, inset, 2A,B; Table 1). FS cells were also characterized by the lack of rebound spikes after hyperpolarizing current step injections (Figs. 1C, 2A) and often displayed GABAergic autaptic responses after action potentials (data not shown) (but see Bacci et al., 2003). LTS interneurons were characterized by a rebound spike (Fig. 1D) or burst of action potentials (Fig. 2A) after injection of hyperpolarizing current steps (Figs. 1D, 2A). Finally, action potentials of both FS and LTS interneurons were brief compared with those of pyramidal neurons and had more pronounced and complex spike afterhyperpolarizations (data not shown). Several neurons were filled with biocytin (n = 12 and 7, for FS and LTS cells, respectively; see Materials and Methods) and reconstructed to assess their somato-dendritic structures and axonal projections (Fig. 1A,B). FS interneurons typically had a dense axonal plexus at the level of their cell body in layer V with some horizontal projections (Fig. 1A), whereas the axonal projections of LTS interneurons ascended to more superficial layers and had a less pronounced perisomatic distribution (Fig. 1B). These cell type-specific morphological features were observed in all biocytin-filled interneurons. The physiological and morphological criteria reported here have been used in several previous studies to distinguish FS and LTS interneurons from each other and from pyramidal neurons (Kawaguchi and Kubota, 1993, 1997, 1998; Cauli et al., 1997; Xiang et al., 1998; Beierlein et al., 2003; Xiang and Prince, 2003).
Table 1.
Membrane and firing properties of FS and LTS interneurons
|
|
FS |
LTS |
|---|---|---|
| Membrane resistance (MΩ) | 68.7 ± 3.9 | 130.9 ± 12.2 |
| Action potential half-width (msec)a | 0.2 ± 0.01 | 0.52 ± 0.03 |
| AHP amplitude (mV)ab | 24.3 ± 0.7 | 16.5 ± 0.7 |
| Maximal firing frequency (Hz)c | 167.2 ± 8.5 | 75.7 ± 6.1 |
| f-i slope (Hz/pA)ad | 0.2 ± 0.02 | 0.05 ± 0.004 |
| Spike frequency adaptatione
|
1.1 ± 0.06
|
0.8 ± 0.03
|
All values are means ± SEM; n = 18 for FS interneurons; n = 16 for LTS interneurons. Independent t test comparisons produced p < 0.001 for all above parameters.
Ranges completely nonoverlapping.
AHP, Afterhyperpolarization; calculated as the difference between the action potential threshold and the most negative level reached during the repolarizing phase.
Calculated from total spikes elicited by 600-msec-long current injections of 800 pA.
f-i slope = firing frequency versus injected current slope, with current injections ranging from 400 to 800 pA.
Spike frequency adaptation was calculated as the ratio of the instantaneous frequency at the fourth and last spike intervals in an action potential train.
IPSCs evoked by extracellular stimuli (Fig. 2B,C) were isolated in the presence of ionotropic glutamate receptor blockers DNQX (10 μm) and dl-APV (100 μm) and were selectively and reversibly abolished by the GABAA receptor blocker gabazine (10 μm; data not shown). eIPSCs in FS interneurons decayed much faster than in LTS cells (Fig. 2B-D). On average, the half-widths of the synaptic responses were 7.45 ± 0.7 and 18.46 ± 2.4 msec in FS and LTS cells, respectively (n = 19 FS; n = 16 LTS; p < 0.00005; independent t test) (Fig. 2D). The decay phase of eIPSCs, fitted with a double exponential and weighted time constants (τd,w; see Materials and Methods), measured 17.6 ± 1.9 and 36.0 ± 6.3 msec in FS and LTS cells, respectively (n = 19 FS; n = 16 LTS; p < 0.004; independent t test) (Fig. 2D). Higher extracellular stimulus intensities were required to evoke reliable suprathreshold eIPSCs in LTS interneurons, and responses were typically of lower amplitude than those in FS cells (note the different current calibration bars in Fig. 2B). These differences were not further analyzed. The data above indicate that GABAergic neurotransmission has distinctly different properties in these two interneuronal subtypes.
Different properties of spontaneous GABAergic transmission in FS and LTS interneurons
The above differences in the kinetics of evoked IPSCs in physiologically identified FS and LTS interneurons were also present when sIPSCs were recorded and analyzed. In our experimental conditions, sIPSCs represent a robust estimate of quantal release at individual GABAergic synapses. Indeed, we found no difference between sIPSCs and miniature IPSCs (mIPSCs) (the latter was recorded in the presence of 1 μm TTX) in terms of frequency, amplitude, and half-width in LTS interneurons (data not shown; n = 4; p > 0.1 in all cases). TTX application did not change amplitudes or half-width of sIPSCs in FS interneurons (data not shown; n = 5; p > 0.06). However, we found a significant, although modest (<25%), decrease of IPSC frequency in the presence of TTX in FS cells (data not shown; n = 5; p < 0.05). In LTS cells, the lack of a decrease in IPSC frequency and amplitude in the presence of TTX indicates that sIPSCs are essentially all mIPSCs and thus reflect release from individual sites. In FS cells, the lack of effect of TTX in IPSC half-width and amplitude indicates that the vast majority of spontaneous events recorded in the absence of TTX also reflects IPSC decay at individual synaptic boutons. Figure 3, A and B, shows examples of sIPSCs recorded in both cell types. Gabazine-sensitive (Fig. 3C,D) sIPSCs were strikingly more frequent, had a much larger amplitude, and decayed much more quickly in FS versus LTS cells (Figs. 3A,B,E, 4; Table 2). Although the properties of sIPSCs in FS interneurons were relatively homogenous, those in LTS cells showed a more pronounced variability, especially in decay time constant (coefficient of variation of τd,w, 0.21 and 0.53 in FS and LTS cells, respectively), suggesting a possible heterogeneity among LTS cells. Overall, kinetics of IPSCs in LTS interneurons was clearly slower than in FS cells (e.g., the fastest IPSCs in the population of LTS interneurons were longer in duration than the slowest IPSC in FS cells) (τd,w range, 5.3-10.6 in FS and 14-53.5 in LTS interneurons). To rule out the possibility that these differences in IPSC kinetics might derive from differences in synaptic location between the two interneuron subtypes, we analyzed sIPSC rise times, which are a sensitive measure of electrotonic distance (Hajos and Mody, 1997). In subsets of FS and LTS interneurons, we recorded sIPSCs under conditions that allow an accurate measure of rise-times [i.e., with less low-pass filtering (10 KHz vs normal 5 KHz) and sampling at 20 KHz]. Rise times were not different between FS and LTS interneurons (Fig. 4C; Table 2). These data indicate that the major differences in sIPSC waveform and frequency cannot be attributed to a different degree of electrotonic filtering of the synaptic response in LTS compared with FS cells.
Table 2.
Properties of sIPSCs in FS and LTS interneurons
|
|
FS |
LTS |
|---|---|---|
| Amplitude (pA)*** | 24.9 ± 1.9 (n = 17) | 14.7 ± 1.4 (n = 17) |
| Frequency (Hz)*** | 5.02 ± 0.7 (n = 17) | 2.0 ± 0.7 (n = 17) |
| Half-width (msec)* | 5.8 ± 0.4 (n = 17) | 9.7 ± 1.1 (n = 17) |
| τd,w (msec)*** | 8.0 ± 0.5 (n = 17) | 23 ± 3.5 (n = 17) |
| Rise time (msec)a
|
0.59 ± 0.07 (n = 9)
|
0.67 ± 0.06 (n = 9)
|
All values are means ± SEM. The number of tested cells is given in parentheses.
p < 0.05
p < 0.001; independent t test.
Rise times of sIPSCs were recorded at a sampling frequency of 20 kHz and filtering of 10 kHz.
The GABAA receptor β-subunit selective agonist loreclezole differentially affects sIPSC kinetics in FS and LTS interneurons
Differences in IPSC kinetics might derive from differences in GABAA receptor subunit composition (Macdonald and Olsen, 1994; Cherubini and Conti, 2001). We therefore tested the action of the GABAA receptor β-subunit selective agonist loreclezole (10 μm) on sIPSCs recorded from FS and LTS interneurons. At this concentration, loreclezole selectively augments responses in GABAA receptors that contain β2 or β3 subunits (Wafford et al., 1994; Wingrove et al., 1994; Korpi et al., 2002). Perfusion with loreclezole resulted in a robust modulation of sIPSCs recorded in FS interneurons (Fig. 5A-C, E). In particular, it produced a several-fold increase of both sIPSC decay time constant and total charge with no significant effect on sIPSC amplitudes (Fig. 5D; Table 3). Loreclezole perfusion increased sIPSC frequency (Fig. 5D; Table 3). Our local perfusion system (see Materials and Methods) allowed for relatively rapid and reversible drug effects (Fig. 5E).
Table 3.
Effects of 10 μm loreclezole and 200 nm zolpidem on sIPSCs in FS and LTS interneurons
|
|
FS |
LTS |
||||||||||||
|---|---|---|---|---|---|---|---|---|---|---|---|---|---|---|
|
|
Control
|
LCZ
|
Control
|
ZOLP
|
Control
|
LCZ
|
Control
|
ZOLP
|
||||||
| Amplitude (pA) | 31.8 ± 3.3 | 33.8 ± 2.6 | 28.8 ± 2.8 | 38.6 ± 4.5* | 14.3 ± 1.6 | 14.5 ± 1.9 | 17.2 ± 2.0 | 18.6 ± 2.4 | ||||||
| Frequency (Hz) | 8.7 ± 1.5 | 14.4 ± 2.3* | 3.4 ± 1.0 | 3.8 ± 1.1 | 1.1 ± 0.32 | 1.2 ± 0.4 | 0.47 ± 0.1 | 0.4 ± 0.07 | ||||||
| Half-width (msec) | 5.2 ± 0.4 | 17.8 ± 1.1*** | 4.5 ± 0.6 | 7.2 ± 0.9* | 10.8 ± 3.0 | 13.7 ± 3.9* | 7.5 ± 1.0 | 10.3 ± 1.9 | ||||||
| τd,w (msec) | 6.11 ± 0.7 | 23.5 ± 2.3*** | 11.7 ± 2.3 | 16.9 ± 3.2** | 38.4 ± 17 | 87.1 ± 17* | 71.7 ± 18 | 87.9 ± 29 | ||||||
| Charge (nC)
|
0.2 ± 0.01
|
0.7 ± 0.11**
|
0.2 ± 0.02
|
0.5 ± 0.07**
|
0.53 ± 0.2
|
0.82 ± 0.2*
|
1.0 ± 0.2
|
1.2 ± 0.3
|
||||||
LCZ, Loreclezole; ZOLP, zolpidem. All values are means ± SEM. Loreclezole: n = 6 for FS interneurons; n = 6 for LTS interneurons. Zolpidem: n = 7 for FS interneurons; n = 6 for LTS interneurons. *p<0.05; **p<0.01; ***p < 0.001; paired t test.
Loreclezole had a less prominent effect on LTS than FS neurons (Fig. 6A-C; Table 3). It increased LTS sIPSC decay time constant and charge but did not affect sIPSC amplitudes or frequencies (Fig. 6D; Table 3). Although loreclezole had a significant effect on both FS and LTS IPSC waveforms, the degree of the modulation was different in the two cell types. Indeed, loreclezole induced a change of sIPSC charge transfer of 315 ± 47 versus 71 ± 21% above control in FS cells and LTS interneurons, respectively (p < 0.002; independent t test; see below), suggesting that the latter cell type has a lower expression of β2-3 synaptic GABAA receptor subunits.
Differential effects of zolpidem on sIPSCs in FS and LTS interneurons
To test whether LTS and FS cells also differed in their GABAA receptor α-subunit composition, we recorded sIPSCs and applied 200 nm zolpidem. At this concentration, zolpidem is known to specifically bind the benzodiazepine site of α1-containing and, less efficiently, α2- and α3-containing GABAA receptors (Korpi et al., 2002; Mohler et al., 2002). In FS interneurons, zolpidem generated a consistent increase in sIPSC decay time constant (Fig. 7A-C; Table 3). Moreover, the drug significantly increased sIPSC amplitudes and charge, but it had no effect on sIPSC frequency (Fig. 7D; Table 3). As with loreclezole (Fig. 5E), the effects of zolpidem were rapid and at least partially reversible (data not shown).
As in FS cells, zolpidem did not alter the frequency of sIPSCs in LTS interneurons (Fig. 8A,D; Table 3). However, in contrast to its actions on FS interneurons, it did not significantly affect sIPSC decay time constants, charge, or amplitudes in LTS interneurons (Fig. 8B-D; Table 3). Although the overall effect in LTS cell population was not statistically significant, zolpidem did increase IPSC decay in some cells, suggesting heterogeneous expression of α1-3 containing GABAA receptors among LTS interneurons. Overall, the effect of zolpidem on FS sIPSC charge was much greater in FS than LTS cells (117 ± 23 vs 30 ± 22% above control predrug period for FS vs LTS; n = 7 and 6, respectively; p < 0.01; independent t test) (Fig. 8E).
Zolpidem requires GABAA receptors containing α1 subunits to exert its effects on FS interneurons
In layer V of the neocortex, α1 and α3 subunits of the GABAA receptor are highly expressed, in contrast to the α2 subunit that is almost undetectable but is expressed in more superficial layers (Wisden et al., 1992; Pirker et al., 2000), suggesting that the zolpidem-mediated effect on FS cell IPSCs could be at GABAA receptors containing either the α1 or α3 subunit. To distinguish between these possibilities, we tested the effect of zolpidem on sIPSCs in FS cells in control mice and in mice whose GABAA receptor α1 subunit had been mutated at the benzodiazepine-binding site. The mutation is a substitution of a histidine residue into an arginine [α1(H101R), hereafter referred to as α1 knock-in], which makes the benzodiazepine site of the α1 subunit insensitive to most benzodiazepines and imidazolines, including zolpidem (Rudolph et al., 1999). These mice represent a powerful tool for determining whether zolpidem effects on FS interneuron sIPSCs depend on GABAA receptors containing α1 or α3 subunits. The dramatic differences in sIPSC kinetics of FS and LTS interneurons in rats described above were also present in either wild-type or α1 knock-in mice (data not shown). In control (wild-type) mice, zolpidem generated a consistent large effect on IPSC half-width, τd,w, and charge (Fig. 9C,E; Table 4). Zolpidem did not affect sIPSC amplitude or frequency in either wild-type or knock-in mice (Fig. 9F; Table 4). In contrast, in FS interneurons of α1 knock-in mice, zolpidem application resulted in a modest increase on both half-width, τd,w, and charge of sIPSCs (Fig. 9E; Table 4) but had no effect on sIPSC amplitude or frequency (Fig. 9F; Table 4). Although the zolpidem effect was significant in both α1 knock-in and wild-type mice, it was much smaller in FS cells from knock-in animals (sIPSC charge was 164 ± 12 vs 31 ± 12% above control pre-drug period for wild-type vs α1 knock-in mice; n = 4 and 9, respectively; p < 0.0001; independent t test), suggesting that either zolpidem is highly selective for α1 subunits at these concentrations, or that the expression of α3 subunit in FS cells is modest.
Table 4.
Effect of 200 nm zolpidem on sIPSCs in FS interneurons of wild-type and α1 knock-in mice
|
|
Wild-type |
α1 Knock-in |
||||
|---|---|---|---|---|---|---|
|
|
Control
|
ZOLP
|
Control
|
ZOLP
|
||
| Amplitude (pA) | 30.2 ± 6.0 | 34.2 ± 7.5 | 29.7 ± 2.6 | 28.2 ± 3.6 | ||
| Frequency (Hz) | 9.3 ± 3.7 | 10.1 ± 3.1 | 8.3 ± 1.2 | 8.8 ± 1.4 | ||
| Half-width (msec) | 2.3 ± 0.1 | 4.6 ± 0.1*** | 2.1 ± 0.1 | 2.5 ± 0.1*** | ||
| τd,w (msec) | 4.1 ± 0.3 | 9.0 ± 0.8** | 3.5 ± 0.3 | 4.3 ± 0.3*** | ||
| Charge (nC)
|
0.13 ± 0.02
|
0.33 ± 0.04**
|
0.10 ± 0.01
|
0.12 ± 0.01*
|
||
ZOLP, Zolpidem. All values are means ± SEM. n = 4 for FS interneurons in wild-type mice; n = 9 for FS interneurons in knock-in mice. *p < 0.05; **p < 0.01; ***p < 0.001; paired t test.
Discussion
Major differences in GABAergic synaptic transmission onto two general classes of cortical interneurons.
We recorded inhibitory synaptic responses from two general classes of layer V neocortical inhibitory cells: fast-spiking and low-threshold spiking interneurons. Although many laboratories use different terminology to describe a variety of non-FS cells (Cauli et al., 1997; Kawaguchi and Kubota, 1997, 1998; Wang et al., 2002), layer V cortical nonpyramidal cells were clearly separated into two distinct groups in this study, FS and LTS interneurons (Fig. 1, Table 1), with membrane and firing properties similar to those described in FS and LTS interneurons in cortical layer IV (Beierlein et al., 2003).
We found that IPSCs are profoundly different in FS and LTS cells in terms of frequency, amplitude, and duration. The frequency of sIPSCs is much higher in FS than LTS cells. Given that interneurons are known to synapse onto cells of the same subclass (Tamas et al., 1998; Gibson et al., 1999; Beierlein et al., 2000), the differences in sIPSC frequency would be expected if FS cells were predominately innervated by other FS cells because they have a higher release probability than LTS interneurons (Gupta et al., 2000; Xiang et al., 2002; Beierlein et al., 2003). The higher IPSC frequency in FS cells might also be attributable to a larger number of GABAergic synaptic contacts on FS cells.
In addition to these sIPSC frequency differences, both sIPSCs and eIPSCs had much faster decay kinetics and larger amplitudes in FS than LTS cells. IPSC decay kinetics was slow and variable among LTS cells, whereas in FS interneurons the kinetics was fast and homogeneous. Several mechanisms may be responsible for the large difference in IPSC kinetic properties in the two interneuron subtypes, including differences in synaptic location and thus different electrotonic distance in the two neuronal populations, lifetime of neurotransmitter in the synaptic cleft (Thompson and Gahwiler, 1992) post-translational modification of GABAA receptors such as endogenous phosphorylation (Moss and Smart, 1996), and GABAA receptor subunit composition.
In the hippocampus, it has been reported that different interneuronal classes show distinct IPSC decays and rise times (Hajos and Mody, 1997). Various interneuron classes generate IPSCs with different rise times in pyramidal neurons of both the hippocampus (Banks et al., 1998; Maccaferri et al., 2000) and neocortex (Xiang et al., 2002), indicating differential location of synaptic contacts onto pyramidal cells. Our experiments suggest that the distinct IPSC waveforms in neocortical FS versus LTS interneurons cannot simply be attributed to different synaptic locations, because rise times were fast and comparable in both interneuron subtypes. These cell-specific differences in IPSC waveform and frequency have also been observed in adult rats (>30 d old; our unpublished observations), ruling out the possibility that this dichotomy in IPSC properties could arise from different maturational stages in the two cell types.
The difference in the IPSC decay time constant between FS and LTS interneurons is unlikely to be entirely mediated by a differential phosphorilation of GABAA receptors. Indeed, GABAA receptor phosphorylation is known to produce a change in IPSC decay (Jones and Westbrook, 1997; Nusser et al., 1999; Poisbeau et al., 1999; Brandon et al., 2000), but the reported level of IPSC modulation (25-60%) is unlikely to account for the magnitude of the difference of IPSCs waveforms between FS and LTS cells (approximately threefold difference in τd,w between FS and LTS interneurons). Similarly, a different lifetime of GABA in the synaptic cleft in FS and LTS cells could, in principle, explain different IPSC kinetics, but it is unlikely that it might generate the large differences between FS and LTS IPSCs (Hill et al., 1998; Nusser et al., 2001; Overstreet and Westbrook, 2003). Accordingly, it has been shown that mIPSCs (which, in our experimental condition, make up the largest part of sIPSCs) are unaffected by the blockade of GABA transporters (Overstreet and Westbrook, 2003). For this latter reason, and because rise times are similar in FS and LTS cells, differential neurotransmitter spillover is also unlikely.
Do differences in IPSCs on FS and LTS interneurons depend on different GABAA receptor subunit composition?
Fast inhibitory synaptic transmission between interneurons occurs through GABAA receptors that are pentameric chloride-permeable channels composed of combinations of multiple subunit subtypes (Vicini, 1999; Cherubini and Conti, 2001; Rudolph et al., 2001). In mammals, GABAA receptor subunits can be divided into several structurally related subfamilies (α1-6, β1-3, γ1-3, δ, ϵ, θ, and ρ1-3) (Vicini, 1999; Cherubini and Conti, 2001; Rudolph et al., 2001). The most common stoichiometry of GABAA receptors is 2α2βγ (Farrar et al., 1999; Cherubini and Conti, 2001), and different subunit combinations result in profound heterogeneity in the electrophysiological properties of the receptor (Macdonald and Olsen, 1994). Thus, different GABAA receptor subunit assemblies will likely generate different IPSC kinetics. Indeed, GABAA-mediated synaptic events change their kinetics during development (Hollrigel and Soltesz, 1997; Dunning et al., 1999; Huntsman and Huguenard, 2000; Okada et al., 2000; Vicini et al., 2001; Banks et al., 2002), and this is correlated with a rearrangement of GABAA receptor subunits (Dunning et al., 1999; Okada et al., 2000; Vicini et al., 2001). Here, we report that drugs that selectively activate different GABAA receptor α and β subunit subtypes differentially affect sIPSCs recorded in FS and LTS interneurons. Loreclezole, which selectively enhances the β2-3-containing GABAA receptors and is less potent for those containing β1 (Wafford et al., 1994; Wingrove et al., 1994; Korpi et al., 2002), dramatically increased sIPSC decay in FS interneurons with a much smaller, although significant, effect on LTS sIPSCs. These data indicate that LTS cells may have a lower expression of functional β2-3-containing GABAA receptors, suggesting that β1 expression may be an important factor in shaping IPSC decays in LTS interneurons. Indeed, the β1 subunit of the GABAA receptor is highly expressed in layer V of the rat neocortex (Pirker et al., 2000).
FS and LTS interneurons also showed a differential and more pronounced difference in α-subunits. We used the benzodiazepine-like drug zolpidem, which at the concentration used here (200 nm) enhances IPSCs generated primarily by α1-containing and, less potently, α2- and α3-containing GABAA receptors (Mohler et al., 2002). Zolpidem significantly increased IPSC decays in FS cells but did not have an effect on IPSCs recorded in LTS cells, indicating that, overall, LTS cells have very low expression of α1-3-containing GABAA receptors. However, a trend toward prolongation of IPSC decays was present in some neurons, suggesting that LTS cells are heterogeneous in their expression of α subunits. The differential effect by zolpidem in FS and LTS cells is in agreement with previously reported results of different zolpidem sensitivities in morphologically identified interneurons in the hippocampus (Thomson et al., 2000).
Both α1 and α3 subunits are highly expressed in layer V of the neocortex, whereas α2 is almost absent (Pirker et al., 2000). Because both α1 and α3 are zolpidem-sensitive (Mohler et al., 2002), we investigated the specific roles of α1 subunits in shaping FS IPSCs using α1(H101R) knock-in mice, in which the α1 subunit of the GABAA receptors was made insensitive to agonists acting at the benzodiazepine site (Rudolph et al., 1999). The zolpidem effect on FS cell IPSCs was very much reduced in the knock-in compared with wild-type mice. The small residual effect seen in the mutant mice perhaps reflects the expression of the α3 subunit and strongly suggests that the α1 subtype is the major α subunit expressed in FS interneurons. This is in good agreement with previous reports indicating that the α1 subunit plays a key role in rapid activation and deactivation of GABAA receptors (Lavoie et al., 1997) and is responsible for accelerating the time course of miniature IPSCs during development in the hippocampus (Goldstein et al., 2002) and cerebellum (Vicini et al., 2001).
Which α subunit is present in LTS cells? According to immunocytochemical studies, the α4 subunit is poorly expressed in neocortical layer V, whereas α5 is relatively highly expressed (Pirker et al., 2000). Interestingly, α5-containing GABAA receptors have a very low affinity for zolpidem (Mohler et al., 2002), suggesting that LTS cells may express this subunit subtype. Note that the finding of when zolpidem concentration was increased to nonspecific levels (1-2 μm), it strongly prolonged IPSCs in both cell types (our unpublished observation).
Interestingly, loreclezole, but not zolpidem, produced an increase of sIPSC frequency in FS interneurons. This frequency change might be because of a loreclezole-dependent increase in postsynaptic GABAA receptor sensitivity leading to the unmasking of small events that would have been buried in the noise. If this were the case, why were frequencies not increased by zolpidem? The larger increase of IPSC charge by loreclezole compared with zolpidem (∼4 × vs ∼2 ×) (Fig. 8E) would be more effective in disclosing the activity of remote synapses, given the efficient recovery of synaptic charge (but not amplitude) by somatic voltage clamp (Hausser and Roth, 1997). Consistent with the unmasking of remote events, we found that mean sIPSC rise times were increased more with loreclezole than zolpidem (our unpublished observation). However, we cannot exclude a possible GABAergic presynaptic effect (Zhang and Jackson, 1995).
Conclusion
Experimental and theoretical evidence indicates that GABAergic interneurons in the hippocampus and neocortex form synaptically connected networks that are crucial for generation of several kinds of oscillations associated with specific behaviors (McBain and Fishan, 2001). Rapidly decaying IPSCs between hippocampal interneurons are crucial for network oscillation coherence and frequency control (Bartos et al., 2001, 2002). Different GABAergic neurotransmission kinetics in distinct interneuronal networks might be responsible for entraining cortical oscillations at different frequencies.
Finally, recent data indicate that specific GABAA receptors may result in distinct functions in terms of behavioral and clinical perspectives (Rudolph et al., 2001; Mohler et al., 2002). The different pharmacological sensitivities of the two neocortical interneuronal subclasses provide possible avenues for selective pharmacological manipulation of cortical inhibitory circuits with important functional effects relevant to both normal and pathophysiological activities.
Footnotes
This work was supported by National Institutes of Health Grants NS39579 and NS12151 from the National Institute of Neurological Disorders and Stroke and the Pimley Research and Training Funds. We thank Fran Shen and Isabel Parada for their excellent assistance with histological data.
Correspondence should be addressed to Dr. David A. Prince, Department of Neurology and Neurological Sciences, Room M016, Stanford University Medical Center, 300 Pasteur Drive, Stanford, CA 94305. E-mail: daprince@stanford.edu.
Copyright © 2003 Society for Neuroscience 0270-6474/03/239664-11$15.00/0
References
- Bacci A, Huguenard JR, Prince DA ( 2002) Differential modulation of synaptic transmission by neuropeptide Y in rat neocortical neurons. Proc Natl Acad Sci USA 99: 17125-17130. [DOI] [PMC free article] [PubMed] [Google Scholar]
- Bacci A, Huguenard JR, Prince DA ( 2003) Functional autaptic neurotransmission in fast-spiking interneurons: a novel form of feedback inhibition in the neocortex. J Neurosci 23: 859-866. [DOI] [PMC free article] [PubMed] [Google Scholar]
- Banks MI, Li TB, Pearce RA ( 1998) The synaptic basis of GABAA, slow. J Neurosci 18: 1305-1317. [DOI] [PMC free article] [PubMed] [Google Scholar]
- Banks MI, Hardie JB, Pearce RA ( 2002) Development of GABA(A) receptor-mediated inhibitory postsynaptic currents in hippocampus. J Neurophysiol 88: 3097-3107. [DOI] [PubMed] [Google Scholar]
- Bartos M, Vida I, Frotscher M, Geiger JR, Jonas P ( 2001) Rapid signaling at inhibitory synapses in a dentate gyrus interneuron network. J Neurosci 21: 2687-2698. [DOI] [PMC free article] [PubMed] [Google Scholar]
- Bartos M, Vida I, Frotscher M, Meyer A, Monyer H, Geiger JR, Jonas P ( 2002) Fast synaptic inhibition promotes synchronized gamma oscillations in hippocampal interneuron networks. Proc Natl Acad Sci USA 99: 13222-13227. [DOI] [PMC free article] [PubMed] [Google Scholar]
- Beierlein M, Gibson JR, Connors BW ( 2000) A network of electrically coupled interneurons drives synchronized inhibition in neocortex. Nat Neurosci 3: 904-910. [DOI] [PubMed] [Google Scholar]
- Beierlein M, Gibson JR, Connors BW ( 2003) Two dynamically distinct inhibitory networks in layer 4 of the neocortex. J Neurophysiol, in press. [DOI] [PubMed]
- Benardo LS, Wong RKS ( 1995) Inhibition in the cortical network. In: The cortical neuron (Gutnick MJ, Mody I, eds), pp 141-155. Oxford, UK: Oxford UP.
- Brandon NJ, Delmas P, Kittler JT, McDonald BJ, Sieghart W, Brown DA, Smart TG, Moss SJ ( 2000) GABAA receptor phosphorylation and functional modulation in cortical neurons by a protein kinase C-dependent pathway. J Biol Chem 275: 38856-38862. [DOI] [PubMed] [Google Scholar]
- Cauli B, Audinat E, Lambolez B, Angulo MC, Ropert N, Tsuzuki K, Hestrin S, Rossier J ( 1997) Molecular and physiological diversity of cortical nonpyramidal cells. J Neurosci 17: 3894-3906. [DOI] [PMC free article] [PubMed] [Google Scholar]
- Cherubini E, Conti F ( 2001) Generating diversity at GABAergic synapses. Trends Neurosci 24: 155-162. [DOI] [PubMed] [Google Scholar]
- Cobb SR, Halasy K, Vida I, Nyiri G, Tamas G, Buhl EH, Somogyi P ( 1997) Synaptic effects of identified interneurons innervating both interneurons and pyramidal cells in the rat hippocampus. Neuroscience 79: 629-648. [DOI] [PubMed] [Google Scholar]
- DeFelipe J, Hendry SH, Jones EG ( 1989) Synapses of double bouquet cells in monkey cerebral cortex visualized by calbindin immunoreactivity. Brain Res 503: 49-54. [DOI] [PubMed] [Google Scholar]
- Deuchars J, Thomson AM ( 1995) Single axon fast inhibitory postsynaptic potentials elicited by a sparsely spiny interneuron in rat neocortex. Neuroscience 65: 935-942. [DOI] [PubMed] [Google Scholar]
- Dunning DD, Hoover CL, Soltesz I, Smith MA, O'Dowd DK ( 1999) GABA(A) receptor-mediated miniature postsynaptic currents and alpha-subunit expression in developing cortical neurons. J Neurophysiol 82: 3286-3297. [DOI] [PubMed] [Google Scholar]
- Farrar SJ, Whiting PJ, Bonnert TP, McKernan RM ( 1999) Stoichiometry of a ligand-gated ion channel determined by fluorescence energy transfer. J Biol Chem 274: 10100-10104. [DOI] [PubMed] [Google Scholar]
- Galarreta M, Hestrin S ( 1999) A network of fast-spiking cells in the neocortex connected by electrical synapses. Nature 402: 72-75. [DOI] [PubMed] [Google Scholar]
- Galarreta M, Hestrin S ( 2001) Electrical synapses between GABA-releasing interneurons. Nat Rev Neurosci 2: 425-433. [DOI] [PubMed] [Google Scholar]
- Gibson JR, Beierlein M, Connors BW ( 1999) Two networks of electrically coupled inhibitory neurons in neocortex. Nature 402: 75-79. [DOI] [PubMed] [Google Scholar]
- Goldstein PA, Elsen FP, Ying SW, Ferguson C, Homanics GE, Harrison NL ( 2002) Prolongation of hippocampal miniature inhibitory postsynaptic currents in mice lacking the GABA(A) receptor alpha1 subunit. J Neurophysiol 88: 3208-3217. [DOI] [PubMed] [Google Scholar]
- Gupta A, Wang Y, Markram H ( 2000) Organizing principles for a diversity of GABAergic interneurons and synapses in the neocortex. Science 287: 273-278. [DOI] [PubMed] [Google Scholar]
- Hajos N, Mody I ( 1997) Synaptic communication among hippocampal interneurons: properties of spontaneous IPSCs in morphologically identified cells. J Neurosci 17: 8427-8442. [DOI] [PMC free article] [PubMed] [Google Scholar]
- Halasy K, Buhl EH, Lorinczi Z, Tamas G, Somogyi P ( 1996) Synaptic target selectivity and input of GABAergic basket and bistratified interneurons in the CA1 area of the rat hippocampus. Hippocampus 6: 306-329. [DOI] [PubMed] [Google Scholar]
- Hausser M, Roth A ( 1997) Estimating the time course of the excitatory synaptic conductance in neocortical pyramidal cells using a novel voltage jump method. J Neurosci 17: 7606-7625. [DOI] [PMC free article] [PubMed] [Google Scholar]
- Hendry SH, Schwark HD, Jones EG, Yan J ( 1987) Numbers and proportions of GABA-immunoreactive neurons in different areas of monkey cerebral cortex. J Neurosci 7: 1503-1519. [DOI] [PMC free article] [PubMed] [Google Scholar]
- Hill MW, Reddy PA, Covey DF, Rothman SM ( 1998) Contribution of subsaturating GABA concentrations to IPSCs in cultured hippocampal neurons. J Neurosci 18: 5103-5111. [DOI] [PMC free article] [PubMed] [Google Scholar]
- Hollrigel GS, Soltesz I ( 1997) Slow kinetics of miniature IPSCs during early postnatal development in granule cells of the dentate gyrus. J Neurosci 17: 5119-5128. [DOI] [PMC free article] [PubMed] [Google Scholar]
- Huntsman MM, Huguenard JR ( 2000) Nucleus-specific differences in GABA(A)-receptor-mediated inhibition are enhanced during thalamic development. J Neurophysiol 83: 350-358. [DOI] [PubMed] [Google Scholar]
- Jones MV, Westbrook GL ( 1997) Shaping of IPSCs by endogenous calcineurin activity. J Neurosci 17: 7626-7633. [DOI] [PMC free article] [PubMed] [Google Scholar]
- Kawaguchi Y, Kubota Y ( 1993) Correlation of physiological subgroupings of nonpyramidal cells with parvalbumin- and calbindinD28k-immunoreactive neurons in layer V of rat frontal cortex. J Neurophysiol 70: 387-396. [DOI] [PubMed] [Google Scholar]
- Kawaguchi Y, Kubota Y ( 1997) GABAergic cell subtypes and their synaptic connections in rat frontal cortex. Cereb Cortex 7: 476-486. [DOI] [PubMed] [Google Scholar]
- Kawaguchi Y, Kubota Y ( 1998) Neurochemical features and synaptic connections of large physiologically-identified GABAergic cells in the rat frontal cortex. Neuroscience 85: 677-701. [DOI] [PubMed] [Google Scholar]
- Korpi ER, Grunder G, Luddens H ( 2002) Drug interactions at GABA(A) receptors. Prog Neurobiol 67: 113-159. [DOI] [PubMed] [Google Scholar]
- Lavoie AM, Tingey JJ, Harrison NL, Pritchett DB, Twyman RE ( 1997) Activation and deactivation rates of recombinant GABA(A) receptor channels are dependent on alpha-subunit isoform. Biophys J 73: 2518-2526. [DOI] [PMC free article] [PubMed] [Google Scholar]
- Maccaferri G, Roberts JD, Szucs P, Cottingham CA, Somogyi P ( 2000) Cell surface domain specific postsynaptic currents evoked by identified GABAergic neurones in rat hippocampus in vitro J Physiol (Lond) 524: 91-116. [DOI] [PMC free article] [PubMed] [Google Scholar]
- Macdonald RL, Olsen RW ( 1994) GABAA receptor channels. Annu Rev Neurosci 17: 569-602. [DOI] [PubMed] [Google Scholar]
- McBain CJ, Fishan A ( 2001) Interneurons unbound. Nat Rev Neurosci 2: 11-23. [DOI] [PubMed] [Google Scholar]
- Miles R, Toth K, Gulyas AI, Hajos N, Freund TF ( 1996) Differences between somatic and dendritic inhibition in the hippocampus. Neuron 16: 815-823. [DOI] [PubMed] [Google Scholar]
- Mohler H, Fritschy JM, Rudolph U ( 2002) A new benzodiazepine pharmacology. J Pharmacol Exp Ther 300: 2-8. [DOI] [PubMed] [Google Scholar]
- Moss SJ, Smart TG ( 1996) Modulation of amino acid-gated ion channels by protein phosphorylation. Int Rev Neurobiol 39: 1-52. [DOI] [PubMed] [Google Scholar]
- Nusser Z, Sieghart W, Mody I ( 1999) Differential regulation of synaptic GABAA receptors by cAMP-dependent protein kinase in mouse cerebellar and olfactory bulb neurones. J Physiol (Lond) 521: 421-435. [DOI] [PMC free article] [PubMed] [Google Scholar]
- Nusser Z, Naylor D, Mody I ( 2001) Synapse-specific contribution of the variation of transmitter concentration to the decay of inhibitory postsynaptic currents. Biophys J 80: 1251-1261. [DOI] [PMC free article] [PubMed] [Google Scholar]
- Okada M, Onodera K, Van Renterghem C, Sieghart W, Takahashi T ( 2000) Functional correlation of GABA(A) receptor alpha subunits expression with the properties of IPSCs in the developing thalamus. J Neurosci 20: 2202-2208. [DOI] [PMC free article] [PubMed] [Google Scholar]
- Overstreet LS, Westbrook GL ( 2003) Synapse density regulates independence at unitary inhibitory synapses. J Neurosci 23: 2618-2626. [DOI] [PMC free article] [PubMed] [Google Scholar]
- Pirker S, Schwarzer C, Wieselthaler A, Sieghart W, Sperk G ( 2000) GABA(A) receptors: immunocytochemical distribution of 13 subunits in the adult rat brain. Neuroscience 101: 815-850. [DOI] [PubMed] [Google Scholar]
- Poisbeau P, Cheney MC, Browning MD, Mody I ( 1999) Modulation of synaptic GABAA receptor function by PKA and PKC in adult hippocampal neurons. J Neurosci 19: 674-683. [DOI] [PMC free article] [PubMed] [Google Scholar]
- Prince DA ( 1999) Epileptogenic neurons and circuits. Adv Neurol 79: 665-684. [PubMed] [Google Scholar]
- Rudolph U, Crestani F, Benke D, Brunig I, Benson JA, Fritschy JM, Martin JR, Bluethmann H, Mohler H ( 1999) Benzodiazepine actions mediated by specific gamma-aminobutyric acid(A) receptor subtypes. Nature 401: 796-800. [DOI] [PubMed] [Google Scholar]
- Rudolph U, Crestani F, Mohler H ( 2001) GABA(A) receptor subtypes: dissecting their pharmacological functions. Trends Pharmacol Sci 22: 188-194. [DOI] [PubMed] [Google Scholar]
- Szabadics J, Lorincz A, Tamas G ( 2001) Beta and gamma frequency synchronization by dendritic gabaergic synapses and gap junctions in a network of cortical interneurons. J Neurosci 21: 5824-5831. [DOI] [PMC free article] [PubMed] [Google Scholar]
- Tamas G, Buhl EH, Somogyi P ( 1997a) Fast IPSPs elicited via multiple synaptic release sites by different types of GABAergic neurone in the cat visual cortex. J Physiol (Lond) 500: 715-738. [DOI] [PMC free article] [PubMed] [Google Scholar]
- Tamas G, Buhl EH, Somogyi P ( 1997b) Massive autaptic self-innervation of GABAergic neurons in cat visual cortex. J Neurosci 17: 6352-6364. [DOI] [PMC free article] [PubMed] [Google Scholar]
- Tamas G, Somogyi P, Buhl EH ( 1998) Differentially interconnected networks of GABAergic interneurons in the visual cortex of the cat. J Neurosci 18: 4255-4270. [DOI] [PMC free article] [PubMed] [Google Scholar]
- Tamas G, Buhl EH, Lorincz A, Somogyi P ( 2000) Proximally targeted GABAergic synapses and gap junctions synchronize cortical interneurons. Nat Neurosci 3: 366-371. [DOI] [PubMed] [Google Scholar]
- Thompson SM, Gahwiler BH ( 1992) Effects of the GABA uptake inhibitor tiagabine on inhibitory synaptic potentials in rat hippocampal slice cultures. J Neurophysiol 67: 1698-1701. [DOI] [PubMed] [Google Scholar]
- Thomson AM, West DC, Hahn J, Deuchars J ( 1996) Single axon IPSPs elicited in pyramidal cells by three classes of interneurones in slices of rat neocortex. J Physiol (Lond) 496: 81-102. [DOI] [PMC free article] [PubMed] [Google Scholar]
- Thomson AM, Bannister AP, Hughes DI, Pawelzik H ( 2000) Differential sensitivity to Zolpidem of IPSPs activated by morphologically identified CA1 interneurons in slices of rat hippocampus. Eur J Neurosci 12: 425-436. [DOI] [PubMed] [Google Scholar]
- Ulrich D, Huguenard JR ( 1996) GABAB receptor-mediated responses in GABAergic projection neurones of rat nucleus reticularis thalami in vitro J Physiol (London) 493: 845-854. [DOI] [PMC free article] [PubMed] [Google Scholar]
- Vicini S ( 1999) New perspectives in the functional role of GABA(A) channel heterogeneity. Mol Neurobiol 19: 97-110. [DOI] [PubMed] [Google Scholar]
- Vicini S, Ferguson C, Prybylowski K, Kralic J, Morrow AL, Homanics GE ( 2001) GABA(A) receptor alpha1 subunit deletion prevents developmental changes of inhibitory synaptic currents in cerebellar neurons. J Neurosci 21: 3009-3016. [DOI] [PMC free article] [PubMed] [Google Scholar]
- Wafford KA, Bain CJ, Quirk K, McKernan RM, Wingrove PB, Whiting PJ, Kemp JA ( 1994) A novel allosteric modulatory site on the GABAA receptor beta subunit. Neuron 12: 775-782. [DOI] [PubMed] [Google Scholar]
- Wang Y, Gupta A, Toledo-Rodriguez M, Wu CZ, Markram H ( 2002) Anatomical, physiological, molecular and circuit properties of nest basket cells in the developing somatosensory cortex. Cereb Cortex 12: 395-410. [DOI] [PubMed] [Google Scholar]
- Wingrove PB, Wafford KA, Bain C, Whiting PJ ( 1994) The modulatory action of loreclezole at the gamma-aminobutyric acid type A receptor is determined by a single amino acid in the beta 2 and beta 3 subunit. Proc Natl Acad Sci USA 91: 4569-4573. [DOI] [PMC free article] [PubMed] [Google Scholar]
- Wisden W, Laurie DJ, Monyer H, Seeburg PH ( 1992) The distribution of 13 GABAA receptor subunit mRNAs in the rat brain. I. Telencephalon, diencephalon, mesencephalon. J Neurosci 12: 1040-1062. [DOI] [PMC free article] [PubMed] [Google Scholar]
- Xiang Z, Prince DA ( 2003) Heterogeneous actions of serotonin on interneurons in rat visual cortex. J Neurophysiol 89: 1278-1287. [DOI] [PubMed] [Google Scholar]
- Xiang Z, Huguenard JR, Prince DA ( 1998a) Cholinergic switching within neocortical inhibitory networks. Science 281: 985-988. [DOI] [PubMed] [Google Scholar]
- Xiang Z, Huguenard JR, Prince DA ( 1998b) GABAA receptor-mediated currents in interneurons and pyramidal cells of rat visual cortex. J Physiol (Lond) 506: 715-730. [DOI] [PMC free article] [PubMed] [Google Scholar]
- Xiang Z, Huguenard JR, Prince DA ( 2002) Synaptic inhibition of pyramidal cells evoked by different interneuronal subtypes in layer V of rat visual cortex. J Neurophysiol 88: 740-750. [DOI] [PubMed] [Google Scholar]
- Zhang SJ, Jackson MB ( 1995) Properties of the GABAA receptor of rat posterior pituitary nerve terminals. J Neurophysiol 73: 1135-1144. [DOI] [PubMed] [Google Scholar]