Abstract
Persistent activity in prefrontal cortex during delayed response tasks is a putative neural correlate of spatial working memory. We tested whether this activity was sensitive to eye movements made during the memory interval by recording from prefrontal neurons while monkeys performed a delayed spatial matching saccade task in which they were allowed to make eye movements freely. We found that eye movements degraded the spatial tuning of persistent activity even as there was an improvement in behavioral performance. Although the strength of the memory signal decreased, delay activity continued to signal the location of cue. The results suggest that free eye movements reduce neuronal gain rather than add variability. The saccades performed during the delay suggest the existence of a rehearsal mechanism that could contribute to working memory maintenance. The results do not provide support for a segregation of storage and executive functions in the periarcuate cortex.
Keywords: spontaneous eye movements, saccade, population vector, rehearsal, spatial memory maintenance, frontal eye field
Introduction
A set of basic processes, including the maintenance, manipulation, and utilization of mental representations, has been postulated to constitute the operational working memory system (Baddeley, 1986; Goldman-Rakic, 1987). Working memory involves both a short-term storage capacity for maintaining mental representations and a capacity for manipulating stored information, often referred to as the “central executive” (Baddeley, 1986; Baddeley and Logie, 1999) or supervisory attentional systems (Shallice, 1982). The cognitive architecture of working memory consists of a central executive, an articulatory loop, and a visuospatial sketchpad (Baddeley, 1986). The visuospatial sketchpad subsystem is responsible for the temporary maintenance of visuospatial information and includes a passive perceptual store and an active rehearsal mechanism. The processes underlying the maintenance of information are not known. In the spatial working memory subsystem, a rehearsal process involving eye movements or the covert analog of eye movements has been proposed (Baddeley, 1986).
Experimental studies both in monkeys and humans have demonstrated the critical role played by the prefrontal cortex (PFC) in working memory (Goldman-Rakic, 1987; Fuster, 1997; Smith and Jonides, 1999; Levy and Goldman-Rakic, 2000). The frontal eye field (FEF) is a region of dorsolateral PFC that is involved in the planning and execution of voluntary eye movements (Bruce and Goldberg, 1990; Hanes and Schall, 1996). The FEF is defined functionally as the region of prearcuate cortex from which eye movements can be evoked at low thresholds by electrical microstimulation (Bruce et al., 1985). FEF neurons can be classified as visual, movement, or visuomovement (Bruce and Goldberg, 1985). The FEF sends visual, movement, and memory signals to the superior colliculus (Sommer and Wurtz, 2001). Ablation or reversible inactivation of the FEF or other prefrontal regions profoundly disrupts movements made toward remembered stimuli and also can impair visual perception, visual attention, and movements made toward visual stimuli (Jacobsen, 1935, 1936; Latto and Cowey, 1971; Latto, 1977; Deng et al., 1986; Funahashi et al., 1993; Dias and Segraves, 1999; Fuster, 1997; Sommer and Tehovnik, 1997; Tehovnik et al., 2000).
Based on current knowledge, one might expect a segregation of executive and storage functions such that FEF acts on information that is buffered in other parts of the PFC. To test this, we trained monkeys to perform a spatial delayed matching task. On half of the trials, the fixation requirement during the delay was eliminated, and the monkeys were allowed to move their eyes freely. We recorded the neuronal activity in the periarcuate region of the PFC. Recording sites were classified based on the results of microstimulation as low-threshold FEF or high-threshold non-FEF. We reasoned that eye movement should disrupt, or even abolish, the spatial tuning of delay activity in FEF, while having substantially less effect on delay activity outside the FEF. Previous studies (Miller et al., 1996) that compared PFC and inferior temporal (IT) cortex showed that the sample-selective delay activity in PFC was maintained throughout the trial even when other visual test stimuli intervened during the delay, whereas delay activity in IT cortex was disrupted by intervening stimuli. The results suggest that PFC plays a primary role in working memory storage. In the current study, we are essentially using a motor analog of the intervening stimuli paradigm.
Our results show that free eye movements degraded, but did not abolish, the spatial tuning of delay activity in FEF at both single neuron and population levels. At the same time, there was actually a small improvement in behavior performance. We also found a correlate of active rehearsal, in that free saccades were predominantly oriented toward the memorized cue direction. This may explain the relative increase in the percentage of correct responses for free eye movement trials and might also account for the residual spatial tuning observed on free saccade trials. There were only minor differences in the effects on spatial tuning at FEF versus non-FEF recording sites. We conclude that low-threshold FEF and non-FEF are equally likely to be involved in buffering spatial memory signals in the presence of spontaneous eye movements that intervene between the cue and response.
Materials and Methods
Subjects and surgical techniques. Experiments were performed on two juvenile male rhesus monkeys (Macaca mulatta). All methods were approved by the Institutional Animal Care and Use Committee at Columbia University and the New York State Psychiatric Institute. Monkeys were prepared for experiments by surgical implantation of a post used for head restraint and a recording chamber to give access to the cortex. A monocular scleral search coil was implanted for eye position recording (Judge et al., 1980).
Visual stimulation. Visual targets were generated and controlled by a Cambridge Research Systems (Kent, UK) VSG2/3F video frame buffer with an on-board microprocessor. The output from the video board was displayed on a calibrated color monitor with a 60 Hz noninterlaced refresh rate. The spatial resolution of the display was 1280 pixels by 1024 lines. The frame buffer was programmed to send out digital pulses (frame sync) for timing purposes at the beginning of each video frame in which a target was turned on or off. These pulses were recorded by the computer using a hardware timer (Lisberger Technologies, San Francisco, CA) and stored together with the eye movement data. Fixation and saccade targets were small (0.2 and 0.3°, respectively) squares of 15.0 cd/m2 luminance presented on a uniform dark background. The visual targets were fixation yellow square (0.2°), spatial cue white square (0.2°), and target and distractor yellow squares (0.3°). Except for the targets, the subject was in total darkness during each trial. Between trials, there was dim background illumination. The background luminance of the cathode-ray tube (CRT) monitor was below the threshold of our photometer (0.2 cd/m2; OptiCal; Cambridge Research Systems) and below the detection threshold of dark-adapted human observers.
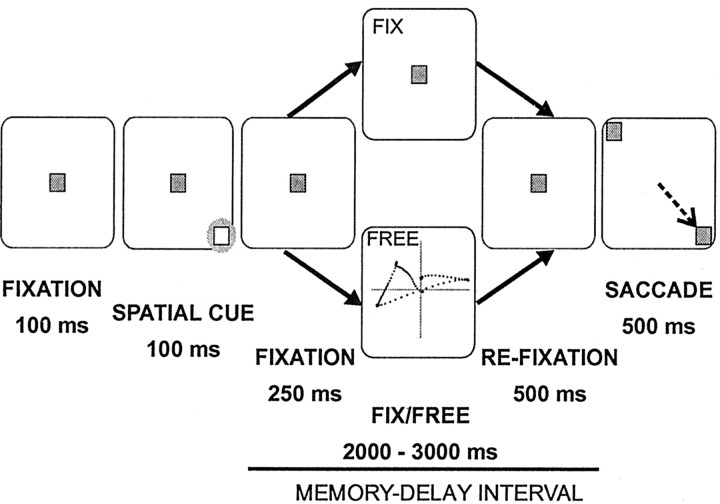
Behavioral task. We trained monkeys to perform a delayed spatial match-to-sample task (see Fig. 1). At the start of each trial, monkeys fixated on a target in the center of the screen (100 msec). Then a peripheral cue was flashed for 100 msec at one of eight locations (four cardinal and four oblique directions). Target eccentricity was adjusted according to the position of the responsive field. After the cue presentation, there was a variable memory-delay interval (2750-3750 msec, flat probability distribution). At the end of the delay, the fixation target disappeared and two choice targets appeared simultaneously. One target was at the location of the cue and the other at an equal eccentricity but in the opposite direction relative to fixation. The monkey was rewarded for making a saccade to the target that matched the cue location. The memory-delay interval was further divided into three subintervals. In the first subinterval (250 msec, delay-fixation) the monkey fixated on a target in the center of the screen. The second interval lasted 2000-3000 msec, and the behavioral requirement varied depending on the trial type. For fix trials, the monkey maintained fixation at the center of the screen in which the fixation target remained visible. For free trials, the fixation target disappeared and the monkey was allowed to move his eyes freely. In the last subinterval (refixation), the monkey either continued to fixate (fix trials) or the fixation target reappeared in the center of the screen and the monkey refixated within 400 msec (free trials). For the analysis of neuronal activity, the saccade interval was also subdivided into a presaccade period (50 msec before saccade onset) and a choice period (100 msec before onset of the presaccade interval). A complete block of trials had eight cue directions and two types of trial (fix and free), randomly interleaved, for a total of 16 trials. During each trial, the room lights were turned off so that the testing chamber was completely dark except for the stimuli on the CRT monitor.
Figure 1.
Spatial delayed matching task. The task starts with fixation (100 msec) and continues with spatial cue (100 msec), memory-delay interval (2750-3750 msec), and choice of target and saccade (500 msec). The memory-delay interval had three subintervals: fixation (250 msec), fix/free eye movements (2000-3000 msec), and refixation (500 msec). The behavioral requirements for the two types of trial (free and fix) are different only during the fix/free eye movements interval.
Neuronal recording and stimulation. Stainless-steel or plastic recording chambers were implanted at stereotaxic coordinates (lateral, 15-18; anterior, 20-25), following previous studies of FEF (Robinson and Fuchs, 1969). Neuronal activity was recorded using platinum-tungsten “8-trode” microelectrodes (typical impedance, 0.5 MΩ). The electrode signal was amplified, filtered, and passed through a time-amplitude window discriminator to separate action potentials from background noise. Amplification, filtering, and discrimination were performed by a digital signal processor-based multichannel slope/height window discriminator (MCD) designed in our laboratory. Using the multielectrode and MCD, we were able to record up to eight neurons simultaneously. The time of each action potential was recorded with a resolution of 0.02 msec.
Electrical microstimulation was used to determine whether recording sites were located within the physiologically defined FEF (Bruce et al., 1985). Biphasic pulses (67 msec trains, 0.2 msec/phase, 350 Hz) were delivered while monkeys fixated on a central target, which was turned off for 200 msec before the electrical stimulus was delivered (Opris et al., 2001). Pulse amplitude was varied between 0 and 100 μA to ascertain the threshold for electrically evoked saccades. Recording sites were assigned to the FEF if the stimulation threshold was ≤50 μA (Bruce et al., 1985). Recording sites were located on the anterior bank of the arcuate sulcus. Non-FEF sites were either at the same anteroposterior axis or anterior to the FEF recording sites. Non-FEF sites were generally not >1 mm away from FEF sites. Non-FEF sites were unlikely to have included premotor or periprincipalis cortex.
Eye movement recording and analysis. Eye position was monitored using a search coil system (CNC Engineering, Seattle, WA). Separate horizontal and vertical eye position signals were fed through an analog differentiator (low pass, -3 dB at 25 Hz) to yield horizontal and vertical eye velocity. The eye position and eye velocity signals were then digitally sampled by computer at 500 Hz/channel and stored on disk for offline analysis. Eye position and velocity records were used to estimate saccade latency and amplitude. Saccade onsets and end points were computed using an acceleration criterion.
Data analysis. Neural and behavioral data were analyzed in Matlab (MathWorks, Natick, MA). The peristimulus time histograms (PSTHs) were calculated by averaging the responses for all the available trials for a given target direction, using 1 msec bins. The resulting histogram was smoothed by convolving with a Gaussian of unit area (sigma, 12 msec). The average firing rate (FR) was calculated during various time intervals on each trial, and the results were subjected to two-way ANOVA (p < 0.05; cue direction and trial type). Simple regression and correlation analyses were used to relate different features of the activity. In concordance with the spatial distribution of the data we used also circular statistic (Rayleigh test for circular uniformity) and multivariate ANOVA (MANOVA) (Hotelling-Lawley) (Zar, 1999). Statistical tests and other characterizations of the data will be described in more detail as they are introduced in Results.
Results
We recorded eye movements along with neuronal activity in the periarcuate cortex. Recording sites were assigned to the FEF if the stimulation threshold was ≤50 μA (Bruce et al., 1985). Otherwise, sites were identified as non-FEF. Single-unit recordings (141 neurons in FEF; 122 neurons in non-FEF) were performed in two monkeys while they performed a delayed spatial match-to-sample task (Fig. 1).
Behavioral performance
Performance on the spatial matching task was quantified as the percentage of correctly completed trials. If one considers all sources of error (i.e., fixation breaks as well as incorrect choices), the average percent correct was 98.4% for free trials and 86.1% for fix trials for monkey A, and 85.6% for free trials and 81.6% for fix trials for monkey C. There were no noticeable differences between the average performances for different cue directions for both types of trial. Two-way ANOVA (factors: trial type and cue direction) showed that the effect of trial type on percent correct was statistically significant for each monkey (p < 0.0001) and that cue direction was significant only for monkey C (p < 0.03). If one considers only incorrect choices and not fixation breaks, then the performance of monkey A was essentially perfect (99.2% free, 99.1% fix), whereas monkey C still performed better on free (90.2%) than on fix (87.6%) trials. It is possible that monkey A adopted a strategy of breaking fixation to terminate the trial whenever he had a low expectation of reward because of forgetting the cue location. In general, performance on free trials ranged from no worse to significantly better than performance on fix trials.
Saccade analysis
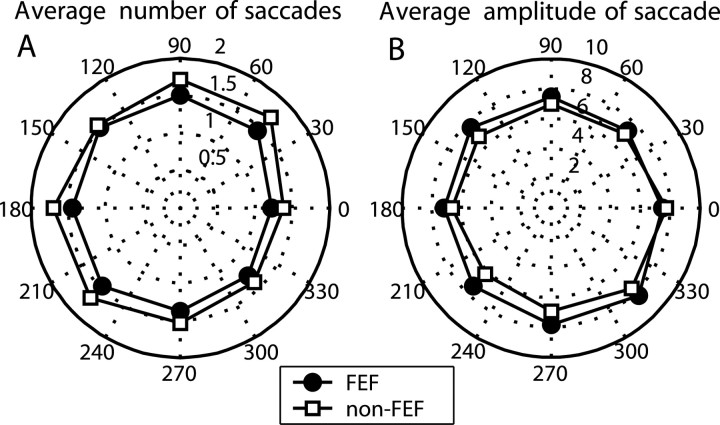
We calculated the average values for the number and amplitude of free saccades made during the delay interval. The average number of saccades as a function of cue direction for FEF recordings and for non-FEF recordings is presented in Figure 2A. The average number of saccades depended weakly on cue direction (one-way ANOVA; p < 0.05) for both FEF and non-FEF. The average saccade amplitude is plotted as a function of cue direction in Figure 2B. Cue direction also had a weak effect on average saccade amplitude (one-way ANOVA; p < 0.05) for both FEF and non-FEF. For both saccade direction and amplitude, the differences between FEF and non-FEF were comparable with the variability across cue direction. Both effects (i.e., cue direction and FEF vs non-FEF) were very small and reached significance primarily because of the large number of observations.
Figure 2.
The spatial distribution of the average number and average amplitude of saccade. A, Effect of cue direction on average number of saccades for FEF recordings (circles) and for non-FEF recordings (squares). B, Average amplitude of the saccade for FEF and non-FEF recordings.
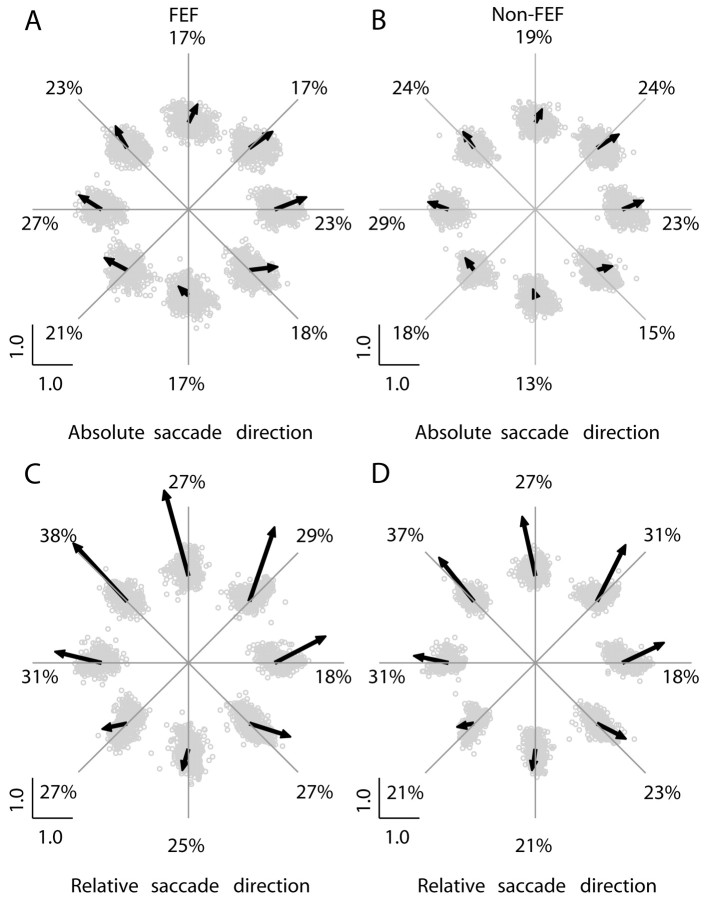
We also looked at the distribution of free saccade directions as a function of cue direction (Fig. 3). Each data point represents the end point of a vector whose direction corresponds to saccade direction and whose amplitude corresponds to saccade amplitude normalized to the amplitude of the largest saccade. The large arrows represent the vector average of the normalized saccade vectors. (Note: The average vector was magnified by a factor of 20 so that it could be plotted on the same graph as the individual vectors.) The saccade directions in Figure 3A,B show a tendency to be aligned with the direction of the cue relative to the center of the display (which is also the direction of the choice saccade required at the end of the trial). There is also an upward bias, which is commonly observed when subjects are in a completely dark environment (White et al., 1994). A Rayleigh test showed significant circular nonuniformity for the distribution of saccade directions (p < 0.04). A Hotelling test showed that the amplitude of the saccade vector average was significantly nonzero (p < 0.03) for each cue direction (except 270° for non-FEF recordings). The percentages of saccades directed within ±22.5° of the cue are indicated on the figure, and were significantly higher than chance (12.5%; p < 0.01; t test; n = 8).
Figure 3.
Distribution of the saccade direction and normalized amplitude for different cue directions. The saccade direction is represented in real coordinates (absolute saccade direction: A, FEF; B, non-FEF) or relative to the line connecting each saccade starting point with the cue location (relative saccade direction: C, FEF; D, non-FEF). In A and B, the radial lines represent the direction of the cue relative to the initial fixation point, whereas in C and D they represent the direction of the cue relative to the initial eye position for each saccade. The set of data for each of the eight directions was shifted to suggest the cue position. Gray circles represent normalized saccade end points. The large arrows represent the vector average of the normalized saccade vectors scaled by a factor of 20. The numbers represent the percentage of saccades directed toward the cue (±22.5°).
Absolute saccade direction does not necessarily indicate if the saccade was directed toward the cue location. This depends on the starting point of the saccade as well as its direction. Therefore, we performed a second analysis in which each saccade direction was plotted relative to the line connecting the saccade starting point with the cue location. When compensated for initial position in this manner, the saccade directions show an even stronger bias toward the cue location (Fig. 3C,D). This was confirmed by a Rayleigh test that showed nonuniform distribution of saccade directions for each cue direction (FEF, p < 10-4; non-FEF, p < 0.03), and a Hotelling test that showed the amplitude of the average saccade vector was significantly nonzero for each cue direction (FEF, p < 10-5; non-FEF, p < 10-7). The percentage of saccades directed toward the cue location (±22.5°) was significantly higher than chance (p < 10-6; t test; n = 8) for both FEF and non-FEF. It should be noted that the representation of saccade direction in Figure 3A,B coincides with a retinocentric representation of cue direction, whereas that in Figure 3C,D corresponds to an extraretinal (e.g., head-centered or world-centered) representation of the cue. Thus, the saccade bias is stronger when represented in extraretinal coordinates.
Most of the upward bias in all four subplots of Figure 3 was contained in the first saccade on each trial. We repeated the analysis excluding the first saccade; this reduced the upward bias but did not otherwise substantially affect the results.
Neuronal response
The spatial tuning of the neural response and its maintenance over time may indicate the contents of spatial working memory. An example of spatially tuned delay activity for a neuron recorded in FEF is presented in Figure 4. The outer ring of subplots represents the neural activity for different cue directions and different trial types with spike rasters and the associated histograms. The upper central subplot represents the mean FR and center-of-mass (CM) vector for the variable delay interval. Free eye movements decreased the amplitude of the neural tuning vector without changing the tuning direction drastically. The lower central subplot represents the electrically evoked saccades (stimulation threshold, 40 μA; average saccade amplitude, 4.8°, and angle, 9°). There was good agreement between the electrically evoked saccade and the direction tuning of the neuron. Note that the evoked saccade amplitude indicates that the recording site was in the small saccade region of the FEF, as were most of the FEF recording sites in this study.
Figure 4.
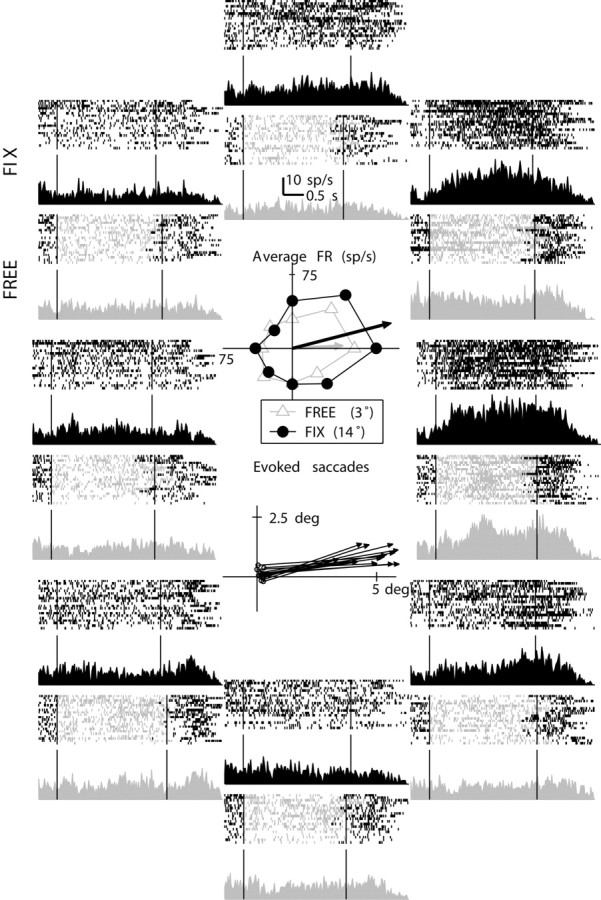
Example FEF neuron. The outer subplots represent the neural activity for different target directions (fix, dark gray, upper half of the subplot; free, light gray, lower half of the subplot) with spike rasters the associated PSTHs. The upper central subplot represents the average FR and tuning vector for the variable delay interval for fix (dark gray filled circles) and free (light gray triangles) trials. The lower central subplot represents the electrically evoked saccade (stimulation threshold, 40 μA; average saccade amplitude, 4.8° and angle 9°).
To measure the effect of free eye movements on the directional tuning of delay activity, we performed several analyses. The first was a two-way ANOVA (factors: cue direction and trial type) on average FR during subintervals of the delay period as presented in Figure 1, specifically delay fixation, delay variable (i.e., the subinterval for which the fixation requirement varied between fix and free trials), and delay refixation. The presaccade period was a 50 msec interval before the onset of the choice saccade and choice was an interval preceding the presaccade that has a minimum duration of 100 msec. Both presaccade and choice were subintervals of the saccade interval (Fig. 1). The results are presented in Table 1. The main result was that cue direction modulates the delay activity of approximately one-third of the neurons, whereas trial type (fix/free) modulated the delay activity of nearly half. The percentage of neurons modulated by cue direction increased over the time course of the trial, suggesting that more neurons were recruited into the pool that signaled the remembered cue direction as the time for the choice saccade approached. In contrast, the percentage of cells modulated by trial type decreased (but did not reach chance levels) as the trial progressed through the delay and saccade intervals. Even activity immediately before the choice saccade was modulated by trial type, which is surprising because the free and fix trials were identical during that interval.
Table 1.
Population statistics for two-way ANOVA (cue direction and trial type) on average FR for six intervals of the trial: cue, delay fixation (Del. fix), delay variable (Del. var.), delay refixation (Del. refix), choice, and presaccadic interval
|
|
Percentage of FEF cells (n = 141) with statistically significant effect (p < 0.05) for each of the following factors |
Percentage of non-FEF cells (n = 122) with statistically significant effect (p < 0.05) for each of the following factors |
||||||||
|---|---|---|---|---|---|---|---|---|---|---|
| Trial Interval
|
Cue direction
|
Trial type
|
Interaction
|
Cue direction
|
Trial type
|
Interaction
|
||||
| Cue | 35% (49) | 3% (3) | 5% (7) | 33% (40) | 5% (6) | 4% (4) | ||||
| Del.fix. | 26% (36) | 3% (3) | 7% (9) | 35% (42) | 5% (5) | 5% (5) | ||||
| Del. var. | 33% (46) | 47% (66) | 21% (29) | 30% (36) | 48% (59) | 20% (23) | ||||
| Del. refix | 32% (44) | 42% (59) | 12% (16) | 36% (43) | 55% (66) | 18% (21) | ||||
| Choice | 44% (61) | 48% (67) | 25% (35) | 36% (43) | 51% (62) | 19% (22) | ||||
| Presaccadic
|
62% (87)
|
36% (50)
|
22% (31)
|
55% (67)
|
40% (48)
|
21% (25)
|
||||
A statistically significant effect of cue direction on FR is necessary but not sufficient to demonstrate directionally tuned neuronal responses. To determine whether a tuning curve had a unique preferred cue direction, we computed a tuning vector. The tuning vector was computed using the CM equation. Specifically, the response to each of the eight cue directions was expressed as a vector with a direction identical to the cue direction and a length equal to the FR for that cue direction. The tuning vector was then computed as the vector average of the eight response vectors.
The variability of the tuning vector for each neuron was estimated using a bootstrap method. Essentially, this method used random subsets of the data to derive many tuning vectors from the same data set. To do this, we first constructed an FR matrix for each neuron, FR(i,j), where FR is the average FR for a single trial and i and j are indices that range over block number (each block comprised one trial of each cue direction and trial type) and cue direction, respectively. We generated a virtual sample for each neuron by randomly selecting both the block and the cue direction from the FR matrix. The responses were shuffled with respect to the cue directions. The size of this random virtual sample was 10,000 blocks in a 10,000 × 8 matrix. For each block of the virtual sample, we computed the CM vector to generate a distribution of tuning vectors. This allowed us to calculate the two-dimensional probability distribution associated with each tuning vector. The average vector that characterized the tuning of the considered cell was calculated using the original data. The significance level of each tuning vector was established relative to its probability distribution. Using this approach, the percentage of cells with statistically significant (p < 0.05) tuning for the variable delay interval was 21% for free and 30% for fix in FEF, and 20% for free and 29% for fix in non-FEF.
We quantified the spatial tuning of the neural response using a measure referred to as vector strength (VS). VS was calculated in many steps, using a similar bootstrap technique. We again generated a number of virtual blocks of data by randomly selecting a block number and cue direction from the FR matrix, FR(i,j). However, in this case, the responses were not shuffled with respect to cue direction. For each virtual block b, we calculated the CM vector, CMb, as the weighted vector average over all cue directions. This procedure was iterated to generate a large number (n = 2000) of tuning vectors. The computation was done for both free and fix trials. We introduced several different metrics for VS, each of which captured a different aspect of the tuning strength:
(1) VS measured in SD units (s.u.):
 |
1 |
where mean[(CMi)i=1,n] is the vector average of all n CM vectors and std[(CMi)i=1,n] is the SD for the same set. This VS is a measure of how much the average tuning of the cell exceeds the variability (noise) in the tuning.
(2) VS measured in mean units (m.u.):
 |
2 |
where mean[(CMi)i=1,n] is the mean amplitude for CM vector. This VS is a measure the tendency to respond beyond the uniform average response. This seems to be the best measure for the tuning.
(3) Maximum-minimum measure of VS (m.m.):
 |
3 |
where mean[maxj{FR(i,j)}i=1,n] is the average of the maximum FR for each block and mean[minj{FR(i,j)}i=1,n] is the average of the minimum FR for each block. This VS is a measure of the eccentricity of the tuning.
We emphasize that no single measures of the tuning gives a complete characterization of the neural response. A satisfactory overview is obtained only by considering them together and also including the results of the statistical tests that we performed. Population statistics for different values of these VS representations and also for the difference in tuning between free and fix trials is presented in Table 2. For the example neuron presented in Figure 4, the VS was 1.17 m.u. for free and 2.01 m.u. for fix.
Table 2.
Vector strength and change in tuning direction
|
|
|
FEF (n = 141) |
Non-FEF (n = 122) |
||||
|---|---|---|---|---|---|---|---|
| Parameter
|
Values
|
Free
|
Fix
|
Free
|
Fix
|
||
| VS (s.u.) | VS > 1.0 | 5% (7) | 13% (19) | 6% (7) | 10% (12) | ||
| VS > 0.5 | 23% (32) | 34% (48) | 25% (31) | 40% (49) | |||
| Med. | 0.32 | 0.36 | 0.30 | 0.39 | |||
| Wilc. | 0.01 | 0.000001 | |||||
| Mean ± SD | 0.40 ± 0.31 | 0.49 ± 0.41 | 0.36 ± 0.28 | 0.52 ± 0.45 | |||
| VS (m.u.) | VS > 1.0 | 21% (30) | 35% (49) | 17% (21) | 30% (37) | ||
| VS > 0.5 | 52% (74) | 64% (90) | 48% (59) | 66% (81) | |||
| Med. | 0.54 | 0.75 | 0.47 | 0.72 | |||
| Wilc. | 0.0002 | 0.000001 | |||||
| Mean ± SD | 0.75 ± 0.68 | 1.07 ± 1.02 | 0.62 ± 0.55 | 0.95 ± 0.86 | |||
| VS (m.m.) | VS > 1.0 | 94% (132) | 96% (136) | 83% (101) | 85% (104) | ||
| Med. | 1.79 | 2.13 | 1.68 | 1.86 | |||
| Wilc. | 0.00001 | 0.01 | |||||
| Mean ± SD | 2.01 ± 0.87 | 2.27 ± 1.05 | 1.87 ± 0.88 | 1.97 ± 0.92 | |||
| Δα (αfree - αfix) | |Δα| < 45 | 34% | 43% | ||||
|
|
Med.
|
83.33°
|
|
64.75°
|
|
||
The table presents values for different VS metrics. The first two rows of each block show the percentage of neurons with VS > 1.0 or 0.5. The next three rows report median values (Med.), results for Wilcoxon signed rank test of equality of medians (Wilc.), and mean ± SD (n = 2000). Δα = αfree - αfix represents the difference in tuning between free and fix trials.
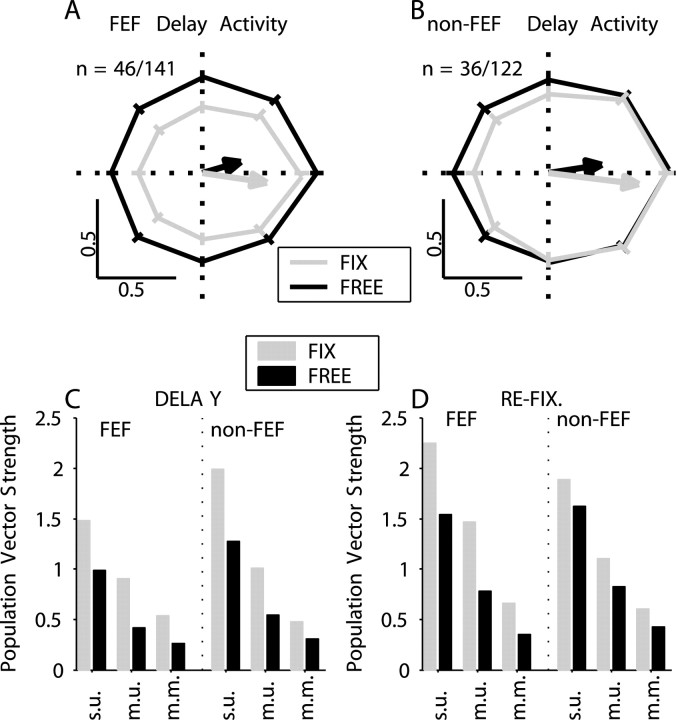
To evaluate the overall spatial tuning of the neural response, we calculated population tuning curves for both FEF (Fig. 5A) and non-FEF (Fig. 5B) neurons and for both types of trials. The population tuning curves were calculated in several steps. First, for each neuron, responses were normalized to the overall maximum of the cell. Then we computed a set of response vectors, in which the length of the vector was the average FR for the delay interval and the direction was the cue direction. Two sets of response vectors were computed, one for each trial type (fix/free). The tuning vector was computed as the vector average of the individual response vectors. The preferred direction of the cell was taken to be the average of the fix and free tuning vector directions. The response vectors for each cell were rotated by subtracting the preferred direction. After all the response vectors for the entire population of neurons were computed and rotated, they were grouped into eight directions (bin width of ±22.5°) and averaged. The population vector was the vector average of these eight population responses.
Figure 5.
Population tuning curves for variable delay interval. FEF (A) and non-FEF (B) recordings for fix (light gray) and free (dark gray) trials with the associated SEs. The bias in this technique is 0.16 m.u. or 0.28 s.u. The arrows represented the population CM vector. C, Population VS during delay interval for different metrics, fix (light gray) and free (dark gray) trials, FEF and non-FEF recordings. D, Population VS during refixation interval. Same conventions as C.
A two-way ANOVA showed that for both FEF and non-FEF recordings, cue direction and trial type had a statistically significant effect (p < 0.0005) on the normalized population delay activity for each monkey. Circular statistics (Rayleigh test) were used to test the uniformity of the distribution of tuning vectors. For FEF and non-FEF and for both types of trials (fix and free) the distribution of tuning vector directions was significantly (p < 10-7) nonuniform. This is consistent with the existence of a nonzero population vector. A MANOVA (Hotelling-Lawley) showed that the population vector amplitude was significantly (p < 10-7) nonzero for FEF and non-FEF and for both types of trials. An additional measure for the robustness of tuning is the difference in tuning direction between free and fix trials (Table 2). We found that the median values of this difference were relatively small compared with the width of the average tuning curve. The percentages of cells that had an absolute difference <45° were 34% in FEF and 43% in non-FEF.
Figure 5C shows the VSs for variable delay tuning vectors. The magnitude of the change in VS was quantified for each of the three metrics introduced previously (s.u., m.u., and m.m.) as follows:
 |
4 |
The changes in VS were: -38.8% (s.u.), -24.8% (m.u.), and -44.4% (m.m.) for FEF and -39.3% (s.u.), -36.1% (m.u.), and -34.5% (m.m.) for non-FEF. In all cases the spatial tuning of the response was reduced during free eye movements. Figure 5D shows the VSs for activity during the refixation interval that precedes the choice saccade. Overall, the direction tuning is stronger during this interval than during the delay. However, the difference between free and fix trials persists, although the monkey is no longer making free eye movements.
To characterize the effects of free-viewing on delay activity, we performed a regression analysis of the population responses for free versus fix trial types. We found that the population averages for free and fix trials (as shown in Fig. 5A,B) were significantly correlated (FEF, r = 0.91, p < 0.001, n = 8; non-FEF, r = 0.93, p < 0.001, n = 8). The regression lines had slopes of 0.65 and 0.66 for FEF and non-FEF, respectively. The intercepts were 0.31 and 0.25. The difference between fix and free trials appears to be a substantial decrease in gain as well as a general increase in firing across directions (additive offset).
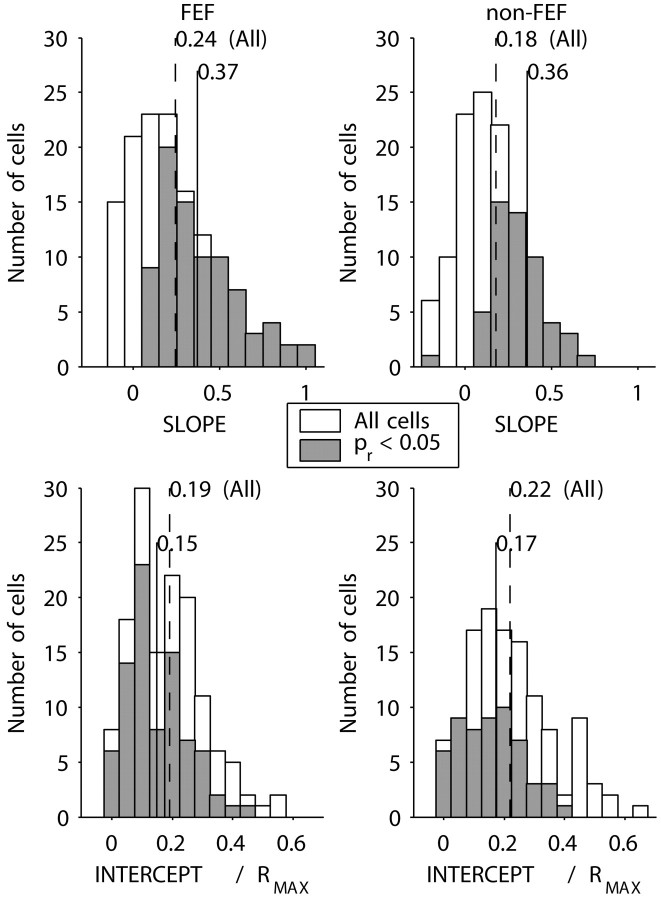
We were concerned that the population results might be affected by the manner in which the population averages were constructed. So we repeated the preceding analysis for each cell individually. The results are shown in Figure 6. We calculated the median slope and intercept for the entire population (divided into FEF and non-FEF subgroups) and for the subset of neurons for which the free-fix correlation was significant (p < 0.05). For the cells with a significant correlation, the regression slopes were much shallower (median, 0.37 and 0.36 for FEF and non-FEF, respectively), whereas the normalized intercepts (expressed as a proportion of the maximum FR for each cell) were closer to zero (median, 0.15 and 0.17), compared with the corresponding parameters derived from Figure 5A,B (see above). So, the effect of free viewing is mainly to reduce the gain of the response, while also additively increasing activity across all directions.
Figure 6.
Linear regression analysis of free versus fix delay activity for individual neurons. A, B, Regression slopes for FEF and non-FEF recordings. Gray bars represent the distribution of cells with a significant (p < 0.05) correlation between fix and free activity. The solid vertical lines are medians for the distributions of significant cells. The dotted vertical lines are the medians for all cells. C, D, Regression intercepts normalized to maximum activity (Rmax). Conventions are as in A and B.
To make the population analysis more complete, we considered the distribution of the change in VS (m.u.) between the fix and free type of trials (Fig. 7A, FEF; B, non-FEF) and the difference in tuning (Fig. 7C, FEF; D, non-FEF). Figure 7E,F (FEF and non-FEF) are complementary to the Figure 7A,B subplots presenting the median values for all VS representations. White bars represent the set of all recorded cells; black bars represent the subset of cells with statistically significant tuning. The changes in VS and the difference in tuning distributions for FEF and non-FEF were similar. For the majority of the cells (over 60%), the VS for fix trials was greater than the VS for free trials. Comparing the subset of cells with significant tuning with the complete set, the changes in VS were larger, whereas the changes in the direction of tuning were smaller. For free trials, we also looked at changes in VS as a function of the number of free saccades made during the delay and found no significant correlation for either FEF or non-FEF recordings.
Figure 7.
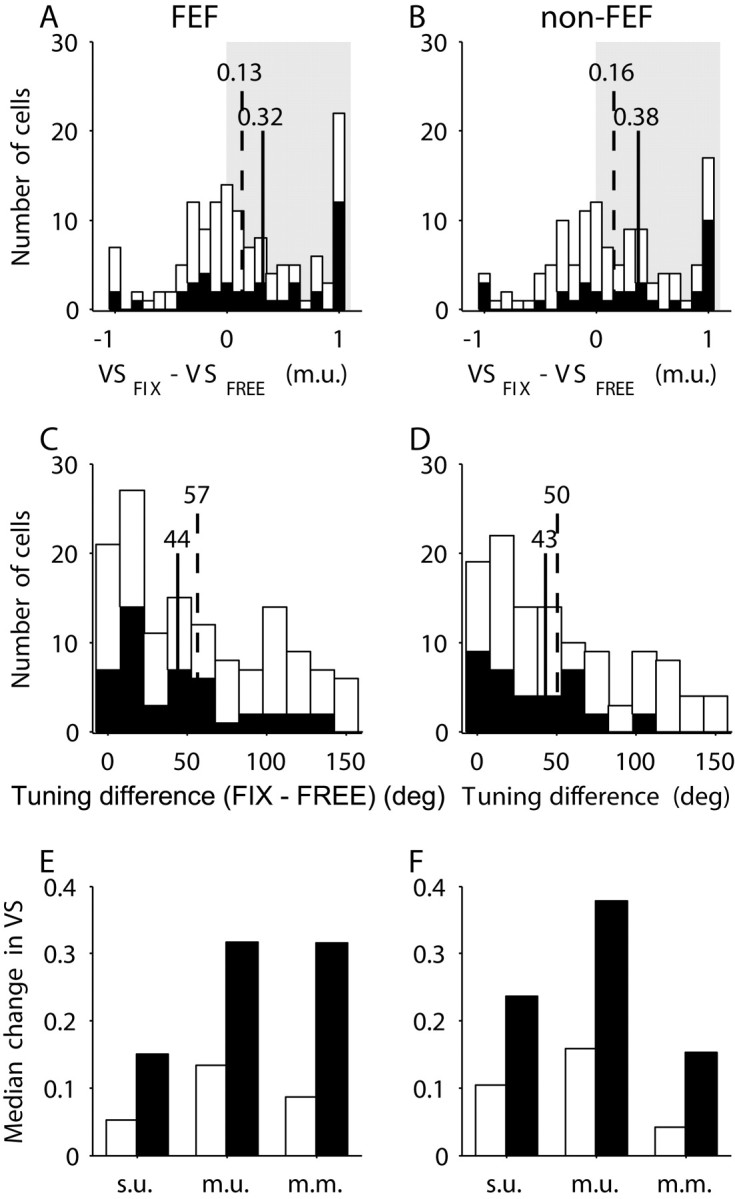
Changes in VS and changes in the direction of tuning. A, B, The distribution of the changes in VS (m.u.) for FEF (A) and non-FEF (B). C, D, The difference in tuning between fix and free trials for FEF (C) and non-FEF (D). Shown are the results for the global set of all recorded cells (white bars) and for the subset of the significantly tuned cells (black bars). For A-D subplots, the vertical lines represent the median values for the global set of cells (dotted line) and for the significantly tuned cells (solid line). E, F, The median values for the change in VS for different representations and for FEF (E) and non-FEF (F).
FEF neurons have been classified as visual, movement, or visuomovement based on activity in delayed oculomotor response tasks (Bruce and Goldberg, 1985). Accordingly, we assigned each neuron a sensorimotor index (SMI):
 |
5 |
where FR(cue) and FR(presaccadic) were the mean FR during the cue presentation and the presaccadic period, respectively. This index could vary from -1.0 (movement cell) to 1.0 (visual cell). Figure 8A,B shows the distributions of SMI for both FEF and non-FEF recordings. There is a predominance of movement neurons for FEF recordings (median SMI, -0.34), and a shift in distribution toward visuomovement for non-FEF recordings (median SMI, -0.12). The median values for FEF and non-FEF were significantly different (p < 0.01; Wilcoxon test), as were the means (p < 0.01; t test).
Figure 8.
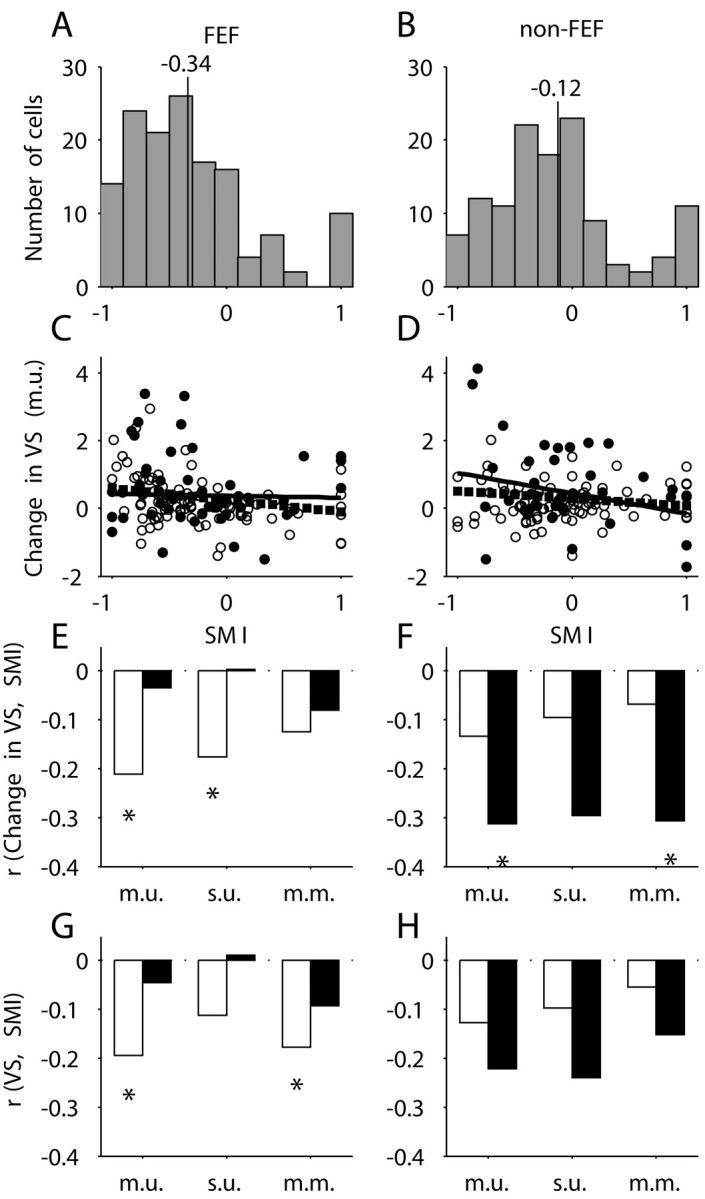
SMIs and their relation with the changes in VS. A, B, The distributions of SMI for FEF and non-FEF, respectively. The vertical lines represented the median values. C, D, The dependencies of the changes in VS (m.u.) on SMI. The results for the complete set of cells were represented with open symbols (circles or bars) and for the significantly tuned cells with filled symbols or bars. Linear regression lines are fitted to both sets of data: dotted lines for all cells and solid line for significantly tuned cells. E, F, Correlation coefficient between the change in VS (ΔVS) and SMI for FEF and non-FEF, respectively. G, H, Correlation coefficients between raw VS and SMI for FEF and non-FEF, respectively.
One would expect neurons with movement-related activity to be more strongly affected by spontaneous eye movements than visual neurons. For both FEF (Fig. 8C) and non-FEF (Fig. 8D), the change in VS (fix - free, m.u.) was indeed negatively correlated with SMI (filled symbols represent neurons with a statistically significant change in VS; p < 0.05; t test). Figure 8E,F shows the correlation coefficients (change in VS vs SMI) for all three VS metrics. Although there was a clear tendency toward negative correlations, only 4 of 12 correlation coefficients are significantly different from zero (p < 0.05; t test). The baseline VS for fix trials was also negatively correlated with SMI (Fig. 8G,H), indicating that movement cells tended to have stronger tuning on fix trials. If the change in tuning strength (fix to free) is proportionate to the tuning strength for fix trials, this might explain why movement cells tend to show a larger decrease.
What causes differences in tuning strength for fix and free trials?
We initially assumed that changes in tuning strength could be attributable to increased variance in the FR on free trials. Possible sources of additional variance might be signals related to eye position or perisaccadic bursts of activity associated with saccades. To look for evidence of such signals, we identified the occurrence of each saccade made during the delay interval of free trials using an eye velocity criterion. This allowed us to divide the delay into individual fixation epochs. For each fixation that was longer than 100 msec, we calculated the mean FR. We plotted the normalized activity of each neuron as a function of eye position relative to preferred cue direction and then combined the data across neurons. We found that for FEF neurons, there was a weak modulation attributable to eye position such that activity was higher when gaze was shifted away from the preferred direction than when gaze was shifted toward the preferred direction (Balan and Ferrera, 2003). The effect was statistically significant (p < 10-7; Rayleigh test), although the magnitude [as measured by a modulation index: MI = (FR0 - FR180)/(FR0 + FR180); 0 indicates preferred cue direction, 180 indicates opposite direction] was small (MI = -0.13). For non-FEF neurons, there was also a significant effect (p < 10-7; Rayleigh test), but the magnitude was even smaller (MI = -0.05).
A similar analysis was performed for saccade direction. The normalized FR was plotted as a function of saccade direction relative to preferred cue direction. For FEF neurons, there was a tendency for FRs to be highest when the saccade was directed toward the preferred location (p < 10-5; Rayleigh test), but this tendency was extremely weak (MI, 0.02). For non-FEF neurons, the effect was almost nonexistent (p < 0.01; Rayleigh test; MI, 0.01).
In addition to looking at activity averaged over entire fixations, we also analyzed perisaccadic activity in the 50 msec preceding each free saccade. For each cell, we expressed presaccadic activity as a function of saccade direction and computed the tuning strength in m.u. The presaccadic tuning strength tended toward zero (FEF: median, 0.3; non-FEF: median, 0.25) and was much weaker than the tuning of delay activity for fix trials (Fig. 5C). In addition, the direction of the presaccadic tuning vector tended to be random relative to the tuning vector for delay activity on fix trials.
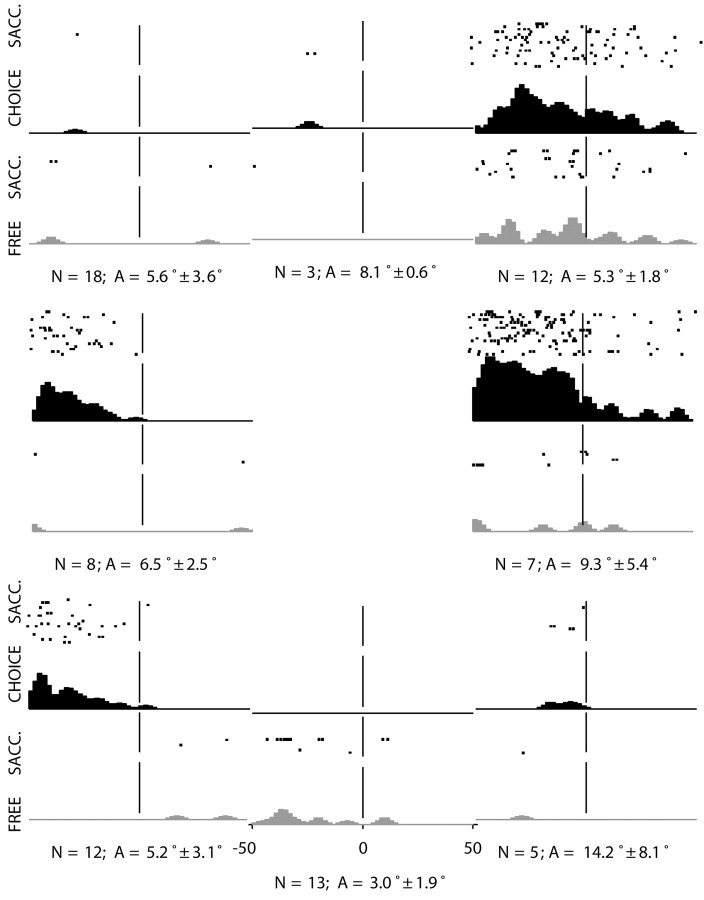
Previous investigators have noted that FEF neurons tend to fire very little before spontaneous saccades (Burman and Segraves, 1994); this may account for the lack of tuning we have observed in activity preceding free saccades. Figure 9 shows presaccadic activity for a single FEF neuron, comparing spontaneous saccades on free trials to choice saccades on fix trials. Fix trials are sorted by cue direction (which matches saccade direction). Free trials are organized according to saccade direction; each subplot includes saccades within ±22.5° of the mean direction. The mean number and amplitude of free saccades for each direction are shown in Figure 9.
Figure 9.
Perisaccadic activity around the time of free (gray bars) and choice (black bars) saccades as a function of saccade direction. For choice saccades, the average number of saccades across all directions was 18 and the average amplitude was 10° (±1.0 SD). N, Average number of saccades; A, average saccade amplitude (±SD) for free saccades as a function of saccade direction.
Of course, there may be sources of variability other than eye position and saccade direction. As a direct measure of total variability, we convolved each spike train with a Gaussian of unit area (sigma, 20 msec) and computed the variance in instantaneous FR. When averaged over all neurons and cue directions, there was a small increase in the median variance on free trials for both FEF (VARfix = 0.68, VARfree = 0.83; p < 0.02; Wilcoxon test) and non-FEF neurons (VARfix = 0.65, VARfree = 0.76; p < 0.02; Wilcoxon test). However, the variance on free trials showed only a slight dependence on the number of saccades performed during the delay (FEF, r = 0.03, regression slope = 0.03; non-FEF, r = 0.26, regression slope = 0.22).
How does one reconcile the observations that spontaneous eye movements generally reduce the spatial tuning delay activity, yet there is limited evidence of direct modulation attributable to eye position or saccade direction? One answer is suggested by the neuron shown in Figure 4. This neuron did not exhibit a broadening and flattening of its tuning curve, as one might expect if the effect of spontaneous eye movements were simply to add noise to its activity. Rather, it seems as if the gain of the neuron (which we imagine to be its sensitivity to the tuned recurrent inputs that presumably sustain the tuning of its delay activity) was reduced when the monkey made free eye movements. We tested this idea by constructing a simple gain model:
 |
6 |
where FR is firing rate, θ is cue direction, ge is an eye-movement-dependent gain, F is the spatial tuning function of recurrent feedback (assumed to be Gaussian), and P[x] is a Poisson spike count generator with mean equal to x. The difference between fix and free trials is captured in the behavior of ge; for fix trials, ge is constant, whereas for free trials, ge varies randomly, with the provision that the mean value of ge on free trials is less than that of ge on fix trials. Several features of the data can be accounted for with no additional assumptions (these predictions were tested by simulating the model in Matlab). First, the amplitude of the tuning vector is reduced when spontaneous eye movements are made. (Note that simply adding directionally isotropic noise will not cause any net reduction in tuning vector amplitude.) Second, the FR variance is greater for free than for fix, because the former includes variability in the gain as well as the variance associated with the spike count generator.
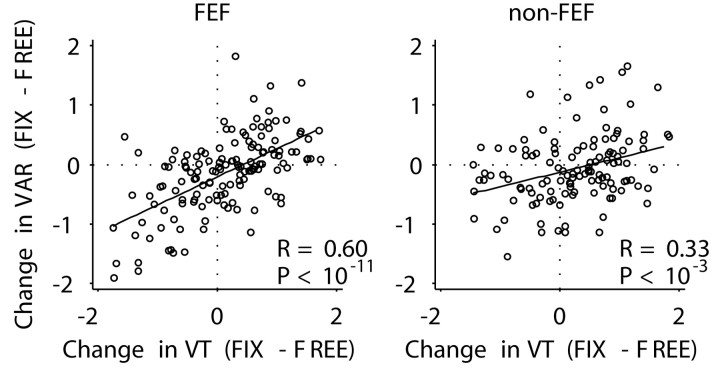
The gain model makes a counterintuitive prediction that is confirmed by the data. Intuitively, one might expect that if the reduction in tuning vector amplitude is caused by increased firing variability, then as variability increases, tuning amplitude should diminish. Another way of saying this is that there should be a negative correlation between the change in variability (fix-free) and the change in tuning vector amplitude. The gain model makes the opposite prediction; when the tuning vector amplitude is reduced, the variability is also reduced, because both tuning vector amplitude and response variability depend on the gain term. Figure 10 shows data confirming this prediction by plotting the relative change in variance, (VARfix - VARfree)/(VARfix + VARfree), against the relative change in tuning vector amplitude (VTfix - VTfree)/(VTfix + VTfree). The data in Figure 10 used the variance associated with the preferred direction. The correlations were smaller but remained positive, using the mean variance averaged over all cue directions (data not shown; FEF, r = 0.4, p < 10-5; non-FEF, r = 0.16, p < 0.1; not significant).
Figure 10.
Relationship between tuning vector amplitude (relative change in amplitude between fix and free trials) and FR variance (relative change in variance between fix and free trials). The regression lines had similar slope for FEF (0.47) and non-FEF (0.24) recordings. Solid line, Linear regression; R, correlation coefficient; P, significance level of correlation (t test).
Discussion
The FEF is a region of the PFC that is involved in the planning and execution of voluntary eye movements. Although many FEF neurons exhibit spatially tuned activity during delayed saccade tasks, there is good reason to believe that FEF plays more of an executive role, i.e., deciding (Kim and Shadlen, 1999) and selecting (Schall et al., 1995), rather than functioning as a spatial memory buffer (Balan and Ferrera, 2003). The periarcuate cortex, including FEF, is a region in which electrically evoked saccade thresholds can drop from >100 to <20 μA over the course of a few millimeters as one travels down the anterior bank of the arcuate sulcus. It is not unreasonable to expect that high-threshold regions on the anterior bank of the arcuate sulcus might be comparable with the principal sulcus region (area 46) in terms of their role in spatial working memory. Hence, the comparison of low-threshold FEF to high-threshold non-FEF sites in the arcuate sulcus is a well motivated approach for testing the hypothesis that executive and storage functions are regionally segregated in dorsolateral PFC.
The segregation hypothesis has led to several expectations. First, it was expected that FEF neurons would be more movement-oriented than non-FEF neurons, and this was confirmed (Fig. 8). However, spatial tuning was degraded by approximately equal amounts in both FEF and non-FEF (Fig. 5). It was also expected that neurons with movement-related activity would be less able to maintain spatially tuned delay activity in the presence of spontaneous eye movements. Within each area, there was a weak tendency for movement neurons to have a greater decrease in VS compared with visual neurons (Fig. 8). Yet, some neurons at low-threshold FEF sites exhibited robust spatially tuned delay activity in the presence of ongoing eye movements (Fig. 4). In general, this study provides little evidence to support a clear segregation of function between FEF and non-FEF regions of the periarcuate cortex.
The mechanism underlying changes in tuning strength was also somewhat counterintuitive. We found little evidence for saccade-related bursts of activity or for strong eye-position-dependent modulation during intersaccadic fixation periods. These results may be consistent with previous observations. First, Balan and Ferrera (2003) have proposed that signals apparently related to eye position may be partially accounted for by saccade planning. In the current experiments, there is no reason to expect that free saccades involve extensive planning; therefore, there is no reason to expect change in activity related to such saccades. Second, Burman and Segraves (1994) found that movement neurons in FEF might be silent during spontaneous saccades in the dark. This could explain our failure to find directionally tuned activity before free saccades.
Another observation suggesting that eye movements do not simply add noise to the neuronal response is that although tuning vector amplitude was generally reduced during free saccades, the variance in instantaneous FR increased modestly and showed little dependence on the number of free saccades made during the delay. An alternative to the idea that free saccades add noise to the delay activity is that the gain of the neuronal response may be modified during free saccades. Changes in response gain attributable to eye-position or attentional inputs are well documented (Salinas and Thier, 2000; McAdams and Maunsell, 1999). We propose that the mechanism underlying tuning changes is a reduction in the sensitivity of the neuron to synaptic inputs, including the recurrent connections that maintain spatially tuned delay activity. This mechanism predicts correlated changes in FR variability and tuning vector amplitude such that when the tuning vector decreases, the variance also goes down. This prediction was confirmed by the data (Fig. 10). This relationship is counterintuitive in that we expected that increases in FR variability might shorten the tuning vector, resulting in a negative correlation between variance and tuning amplitude. A reduction in neuronal gain might sacrifice some of the ability of the cell to maintain memory-related activity, but it would presumably also reduce the efficacy of sensory and movement-related inputs, which are generally much stronger. If the change in gain that resulted increased the compressiveness of the function relating FR to synaptic input, then it might confer a relative advantage to the weaker inputs.
Additional support for the gain-change hypothesis was the observation that the strength of spatial tuning on free trials did not match that on fix trials even after the variable delay period ended and the monkeys were required to refixate (Fig. 5D). This suggests that a component of the gain change is not tied to specific eye movements and may be related to the behavioral state of the animal (fixating vs nonfixating).
Although the spatial tuning of delay activity was degraded by free eye movements, behavioral performance was not disrupted. On the contrary, there was a small but significant improvement in the percentage of correct choices made by both monkeys. The direction of spontaneous saccades was clearly biased toward the cue location (Fig. 3). This may be a behavioral correlate of an active rehearsal mechanism for maintaining spatial working memory (Baddeley, 1986). The fact that overt rehearsal was allowed on free trials but inhibited on fix trials may explain why in general monkeys performed better when eye movements were allowed.
The directional bias of rehearsal saccades may also explain the residual tuning of neuronal activity during free trials. In fact, one could argue that rehearsal saccades might be expected to actually strengthen the tuning of delay activity on free trials. Increases in tuning strength were rarely observed. Presumably, rehearsal saccades would enhance delay activity only if accompanied by saccade-related or eye-position signals. We actually found such signals to be rather weak, thus minimizing the ability of rehearsal saccades to either enhance or degrade spatially tuned delay activity.
Footnotes
This work was supported by the EJLB Foundation and National Institute of Mental Health Grant MH59244. We thank Dr. Gilbert Case for designing and fabricating the multielectrodes used in this study, Dr. Andrei Barborica for building the multichannel discriminator, Dr. Ioan Opris for performing some of the neuronal recording, Dr. Jacqueline Gottlieb for helpful comments on this manuscript, and Jean Willi and Albert Banta for excellent technical assistance.
Correspondence should be addressed to Dr. Vincent P. Ferrera, Center for Neurobiology and Behavior, Columbia University, 722 West 68th Street, Psychiatric Institute Annex 729, New York, NY 10032. E-mail: vpf3@columbia.edu.
Copyright © 2003 Society for Neuroscience 0270-6474/03/2311392-10$15.00/0
References
- Baddeley A ( 1986) Working memory. Oxford: Clarendon.
- Baddeley AD, Logie RH ( 1999) Working memory: the multiple-component model. In Models of working memory: mechanisms of active maintenance and executive control (Miyake A, Shah P, eds), pp 28-61. New York: Cambridge UP.
- Balan PF, Ferrera VP ( 2003) Effects of gaze shifts on maintenance of spatial memory in macaque frontal eye field. J Neurosci 23: 5446-5454. [DOI] [PMC free article] [PubMed] [Google Scholar]
- Bruce CJ, Goldberg ME ( 1985) Primate frontal eye fields. I. Single neurons discharging before saccades. J Neurophysiol 53: 603-635. [DOI] [PubMed] [Google Scholar]
- Bruce CJ, Goldberg ME ( 1990) Primate frontal eye fields. III. Maintenance of a spatially accurate saccade signal. J Neurophysiol 64: 489-508. [DOI] [PubMed] [Google Scholar]
- Bruce CJ, Goldberg ME, Bushnell MC, Stanton GB ( 1985) Primate frontal eye field. II. Physiological and anatomical correlates of electrically evoked eye movements. J Neurophysiol 54: 714-734. [DOI] [PubMed] [Google Scholar]
- Burman DD, Segraves MA ( 1994) Primate frontal eye field activity during natural scanning eye movements. J Neurophysiol 71: 1266-1271. [DOI] [PubMed] [Google Scholar]
- Deng SY, Goldberg ME, Segraves MA, Ungerleider LG, Mishkin M ( 1986) The effect of unilateral ablation of the frontal eye fields on saccadic performance in the monkey. In: Adaptive processes in visual and oculomotor systems (Keller EL, Zee DS, eds), pp 201-208. Oxford: Pergamon.
- Dias EC, Segraves MA ( 1999) Muscimol-induced inactivation of monkey frontal eye field: effects on visually and memory-guided saccades. J Neurophysiol 81: 2191-2214. [DOI] [PubMed] [Google Scholar]
- Funahashi S, Bruce CJ, Goldman-Rakic PS ( 1993) Dorsolateral prefrontal lesions and oculomotor delayed-response performance: evidence for mnemonic “scotomas.” J Neurosci 13: 1479-1497. [DOI] [PMC free article] [PubMed] [Google Scholar]
- Fuster J ( 1997) The prefrontal cortex. New York: Raven.
- Goldman-Rakic PS ( 1987) Circuitry of primate prefrontal cortex and regulation of behavior by representational memory. In: Handbook of physiology, Vol 5 (Plum F, Mountcastle F, eds), pp 373-517. Washington, DC: American Physiological Society. [Google Scholar]
- Hanes DP, Schall JD ( 1996) Neural control of voluntary movement initiation. Science 274: 427-430. [DOI] [PubMed] [Google Scholar]
- Jacobsen CF ( 1935) Functions of the frontal association area in primates. Arch Neurol Psychiatry 33: 558-569. [Google Scholar]
- Jacobsen CF ( 1936) Studies of cerebral function in primates. I. The functions of the frontal association areas in monkeys. Comp Psychol Monogr 13: 3-60. [Google Scholar]
- Judge SJ, Richmond BJ, Chu FC ( 1980) Implantation of magnetic search coils for measurement of eye position: an improved method. Vision Res 20: 535-538. [DOI] [PubMed] [Google Scholar]
- Kim JN, Shadlen MN ( 1999) Neural correlates of a decision in the dorsolateral prefrontal cortex of the macaque. Nat Neurosci 2: 176-185. [DOI] [PubMed] [Google Scholar]
- Latto R ( 1977) The effects of bilateral frontal eye-field, posterior parietal or superior collicular lesions on brightness thresholds in the rhesus monkey. Neuropsychologia 15: 507-516. [DOI] [PubMed] [Google Scholar]
- Latto R, Cowey A ( 1971) Visual field defects after frontal eye-field lesions in monkeys. Brain Res 30: 1-24. [DOI] [PubMed] [Google Scholar]
- Levy R, Goldman-Rakic PS ( 2000) Segregation of working memory functions within the dorsolateral prefrontal cortex. Exp Brain Res 133: 23-32. [DOI] [PubMed] [Google Scholar]
- McAdams CJ, Maunsell JHR ( 1999) Effects of attention on orientation-tuning functions of single neurons in macaque cortical area V4. J Neurosci 19: 431-441. [DOI] [PMC free article] [PubMed] [Google Scholar]
- Miller EK, Erickson CA, Desimone R ( 1996) Neural mechanisms of visual working memory in prefrontal cortex of the macaque. J Neurosci 16: 5154-5167. [DOI] [PMC free article] [PubMed] [Google Scholar]
- Opris I, Barborica A, Ferrera VP ( 2001) On the gap effect for saccades evoked by electrical microstimulation of frontal eye fields in monkeys. Exp Brain Res 138: 1-7. [DOI] [PubMed] [Google Scholar]
- Robinson DA, Fuchs AF ( 1969) Eye movements evoked by stimulation of frontal eye fields. J. Neurophysiol 32: 637-648. [DOI] [PubMed] [Google Scholar]
- Salinas E, Thier P ( 2000) Gain modulation: a major computational principle of the central nervous system. Neuron 27: 15-21. [DOI] [PubMed] [Google Scholar]
- Schall JD, Hanes DP, Thompson KG, King DJ ( 1995) Saccade target selection in frontal eye field of macaque. I. Visual and premovement activation. J Neurosci 15: 6905-6918. [DOI] [PMC free article] [PubMed] [Google Scholar]
- Shallice T ( 1982) Specific impairments of planning. Philos Trans R Soc Lond B Biol Sci 298: 199-209. [DOI] [PubMed] [Google Scholar]
- Smith EE, Jonides J ( 1999) Storage and executive processes in the frontal lobes. Science 283: 1657-1661. [DOI] [PubMed] [Google Scholar]
- Sommer MA, Wurtz RH ( 2001) Frontal eye field sends delay activity related to movement, memory, and vision to the superior colliculus. J Neurophysiol 85: 1673-1685. [DOI] [PubMed] [Google Scholar]
- Sommer MA, Tehovnik EJ ( 1997) Reversible inactivation of macaque frontal eye field. Exp Brain Res 116: 229-249. [DOI] [PubMed] [Google Scholar]
- Tehovnik EJ, Sommer MA, Chou I-H, Slocum WM, Schiller PH ( 2000) Eye fields in the frontal lobes of primates. Brain Res Brain Res Rev 32: 413-448. [DOI] [PubMed] [Google Scholar]
- White JM, Sparks DL, Stanford TR ( 1994) Saccades to remembered target locations: an analysis of systematic and variable errors. Vision Res 34: 79-92. [DOI] [PubMed] [Google Scholar]
- Zar JH ( 1999) Biostatistical analysis. Upper Saddle River, NJ: Prentice Hall.


