

Abstract
The olfactory epithelium of fish contains three intermingled types of olfactory receptor neurons (ORNs): ciliated, microvillous, and crypt. The present experiments were undertaken to test whether the different types of ORNs respond to different classes of odorants via different families of receptor molecules and G-proteins corresponding to the morphology of the ORN. In catfish, ciliated ORNs express OR-type receptors and Gαolf. Microvillous ORNs are heterogeneous, with many expressing Gαq/11, whereas crypt ORNs express Gαo. Retrograde tracing experiments show that ciliated ORNs project predominantly to regions of the olfactory bulb (OB) that respond to bile salts (medial) and amino acids (ventral) (Nikonov and Caprio, 2001). In contrast, microvillous ORNs project almost entirely to the dorsal surface of the OB, where responses to nucleotides (posterior OB) and amino acids (anterior OB) predominate. These anatomical findings are consistent with our pharmacological results showing that forskolin (which interferes with Gαolf/cAMP signaling) blocks responses to bile salts and markedly reduces responses to amino acids. Conversely, U-73122 and U-73343 (which interfere with Gαq/11/phospholipase C signaling) diminish amino acid responses but leave bile salt and nucleotide responses essentially unchanged. In summary, our results indicate that bile salt odorants are detected predominantly by ciliated ORNs relying on the Gαolf/cAMP transduction cascade. Nucleotides are detected by microvillous ORNs using neither Gαolf/cAMP nor Gαq/11/PLC cascades. Finally, amino acid odorants activate both ciliated and microvillous ORNs but via different transduction pathways in the two types of cells.
Keywords: olfactory, receptor, G-protein, amino acid, bile salt, transduction
Introduction
The peripheral olfactory system of vertebrates consists of bipolar olfactory receptor neurons (ORNs) that convey information via the first cranial nerve to the olfactory bulb (OB). ORNs may be either ciliated or microvillous (Le Gros Clark, 1956; for review, see Farbman, 2000). In many terrestrial vertebrates, including snakes and rodents, ORNs are segregated into two separate compartments: microvillous ORNs lie in the vomeronasal organ (VNO), whereas ciliated ORNs populate the main olfactory epithelium (OE). Anatomical (Skeen, 1977; Stewart et al., 1979; Strotmann et al., 2000), molecular (Ressler et al., 1994; Vassar et al., 1994; Yoshihara et al., 1997; Mori et al., 1999), and functional studies (Kauer, 1991; Uchida et al., 2000) indicate an odotopic mapping of ORNs onto the OB and the accessory OB, i.e., distinct classes of ORNs respond best to particular molecular features of potential odorants and project to a limited number of glomeruli. Furthermore, in rodents, the type of receptor cell, ciliated or microvillous, correlates with the particular family of receptor molecules and G-proteins used in sensory transduction. The ciliated ORNs of the main OE use OR-type receptors (Buck and Axel, 1991) coupled to the G-protein Gαolf (Jones and Reed, 1989; Shinohara et al., 1992) and project to the main OB. The microvillous receptor cells of the VNO fall into two classes according to the G-protein used (Gαo versus Gαi) and project to different sites in the accessory OB (Jia and Halpern, 1996; for review, see Mori et al., 2000). A recent study reported that Gαq also is expressed in the VNO of rodents (Wekesa et al., 2003).
In vertebrates lacking a VNO, e.g., fish, birds, Old World monkeys, hominoid apes, and humans, microvillous and ciliated ORNs both occupy the same OE [fish (Zeiske et al., 1992); bird, Old World monkeys, apes (Meisami and Bhatnagar, 1998); human (Moran et al., 1982). Because these species also lack an accessory OB, both receptor cell types project to the main OB. Additionally, the OE of fish contains, less abundantly, a third type of ORN: the crypt receptor cell (Morita et al., 1996; Hansen and Zeiske, 1998; Hansen and Finger, 2000). Although these three types of ORN are intermingled in one OE, the concept of odotopic representation in the OB may also obtain for fish (Thommesen, 1978; Døving and Selset, 1980; Friedrich and Korsching, 1997; Nikonov and Caprio, 2001). To test this hypothesis in catfish, we used three complementary approaches: (1) retrograde tracing from small, identifiable areas of the OB to label small populations of ORN; (2) in situ hybridization for particular odorant receptors and immunocytochemistry for various G-proteins to test whether the three types of ORN in the OE use different transduction cascades and, if so, whether specific glomeruli of the OB exhibit complimentary immunoreactivity; and (3) electrophysiology of the olfactory epithelium to test whether particular transduction cascades are associated with detection of different classes of odorants.
Preliminary results have been published previously in abstract form (Anderson and Finger, 2000; Anderson et al., 2001; Hansen et al., 2001; Rolen et al., 2003b).
Materials and Methods
Juvenile catfish, Ictalurus punctatus, of both sexes ranging from 11 to 24.5 cm in standard length, were obtained commercially from the Hopper-Stephens Hatcheries (Lenoke, AR) and from the Louisiana State University aquaculture facility. The fish to be processed for histology were kept for at least 1 week in aquaria of the Animal Resources Center, University of Colorado Health Sciences Center. Fish for electrophysiological testing were held in the Louisiana State University Animal Care Facility in a 300 l aquarium filled with charcoal-filtered tap water (CFTW) and maintained on a 12 hr light/dark cycle. All procedures were performed with the approval of the institutional animal care and use committees of the respective institutions.
Immunocytochemistry for G-protein α-subunits
Different types of ORNs in mammals use different second messenger systems, i.e., the microvillous receptor neurons of the VNO express either Gαo or Gαi, whereas the ciliated ORNs of the main olfactory epithelium predominantly express Gαolf. We used antisera directed against mammalian forms of G-proteins [Gαolf/s, Gαo, αi, Gαq/11 (Santa Cruz Biotechnology, Santa Cruz, CA; Calbiochem, La Jolla, CA; Chemicon, Temecula, CA)] (Table 1) to assess the tissue distribution of these forms in catfish.
Table 1.
Antisera and peptides used for G-protein immunocytochemistry
|
|
Supplier |
Article number |
Lot number |
Sequence |
|---|---|---|---|---|
| Gαolf/s | Santa Cruz Biotechnology | SC-383 | L-0602, K-189 | Rat 377-394 |
| Gαo | Santa Cruz Biotechnology | SC-387 | K-291 | Rat 105-124 |
| Gαq/11 | Santa Cruz Biotechnology | SC-392 | H-071 | Mouse common domain 341-359 |
| Gαq/11 | Chemicon | AB1647 | 2106028 | Rat 283-300 |
| Gαq/11 | Calbiochem | 371751 | B44877 | Rat 115-133 |
| Peptide Gαolf/s | Santa Cruz Biotechnology | SC-383P | B138 | Rat 377-394 |
| Peptide Gαo | Santa Cruz Biotechnology | SC-387P | D171 | Rat 105-124 |
| Peptide Gαq/11
|
Santa Cruz Biotechnology
|
SC-392P
|
1041
|
Mouse 341-359
|
Western blot analysis
To test whether the antibodies against mammalian G-proteins recognized similar molecular species in catfish tissue, we performed Western blots in tissue from catfish OE, OB, and brain, and as a positive control, on tissue from mouse or rat brain. As a negative control the antibodies were preabsorbed with the blocking peptides supplied by Santa Cruz Biotechnology. Briefly, the fish were anesthetized, and dissected olfactory bulbs, olfactory organs, and brains were immersed in protein homogenate buffer (10% SDS, 10 mm EDTA, 100 mm Tris, pH 8.0). The samples were either sonicated or homogenized (Tissue Tearor, Biospec Products). Protein concentrations were determined for each sample in comparison with bovine serum albumin (BSA) standards using the BCA assay (Bio-Rad, Hercules, CA). Western blotting samples were prepared by normalizing the concentration to 2 mg/ml by suspension in 4× sample buffer and dH2O. Samples of mice and rat brains were prepared in an identical manner for positive controls. Lanes containing 20-40 μg of protein for each sample were separated by SDS-PAGE and transferred to PolyScreen polyvinylidene difluoride membranes (NEN, Boston, MA) and then preincubated in PBS containing 1% goat serum, 3% BSA, 0.1% Tween 20, pH 7.2, for 1 hr. The membranes were probed using antibodies against G-protein subunits overnight at 4°C. After washing, the protein bands were visualized with a peroxidase secondary antibody incubation followed by chemiluminescence using Super Signal West Dura Substrate. Data were captured with a ChemiImager 4400 chemiluminescence detection unit (Alpha Innotech, San Leandro, CA). Alternatively, the bands were visualized with a biotin-labeled secondary antibody followed by ABC (Vector Laboratories, Burlingame, CA) and diaminobenzidene (DAB) (Sigma, St. Louis, MO) reaction in the presence of hydrogen peroxide. The size standards used were biotin-labeled protein standards (Bio-Rad).
The Western blots showed strong double bands in the range of 42-44 kDa for the Gαolf/s antibodies (Santa Cruz Biotechnology) in all tissues tested. Western blots performed with the Gαo antibody (Santa Cruz Biotechnology) resulted in a band of ∼40 kDa in tissue from catfish bulb and brain and a faint band at the same level for OE of catfish. Gαq/11 antibodies (Santa Cruz Biotechnology, Chemicon, Calbiochem) revealed a band of ∼41 kDa. After preabsorption of the antisera supplied by Santa Cruz Biotechnology with the corresponding peptides, no bands appeared for the three antibodies (Fig. 1 A-C).
Figure 1.

Western blots of G-protein preparations using tissue of catfish OE, OB, and brain and mouse and rat brain. Bands in A and B were visualized by ABC/DAB reaction; C was visualized with chemiluminescence using Super Signal West Dura Substrate. Asterisks depict the correct band. A, Gαolf/s antiserum reacts with a major band of ∼42-44 kDa in all catfish tissues as well as in mouse brain. B, Gαq/11 reveals a consistent band at ∼40-42 kDa. A smaller band is also evident in some lanes. C, Gαo reacts with a band in all lanes at ∼40-42 kDa. The preparation from catfish OE shows a predominant band at this molecular weight, with few other reactive products. Preabsorption with the appropriate peptide resulted in no bands in any lane.
Light microscopic immunocytochemistry
Fish were anesthetized, perfused, and fixed as described above. After fixation, the olfactory rosettes and OBs were removed from the tissue block and either processed as whole-mount preparations or cryoprotected with 20% sucrose overnight. Cryostat sections of 10-20 μm were collected onto Superfrost Plus slides (Fisher Scientific, Houston, TX). The tissue was washed three times for 10 min in 0.1 m phosphate buffer, pH 7.2, and, if necessary, incubated in 0.3% H2O2 for 10 min to reduce endogenous peroxidase. Preincubation in blocking solution (0.2% BSA, 1% normal serum, 0.3% Triton X-100 in 0.1 m PBS) for 1-2 hr was followed by incubation in polyclonal primary antibodies overnight for cryostat sections or for one to two nights for whole-mount preparations. Primary antibodies (Santa Cruz Biotechnology) were diluted in blocking solution: Gαo 1:250; Gαolf/s 1:1,000; Gαi 1:500 (Santa Cruz Biotechnology). The antibodies against Gαq/11 (Calbiochem) were diluted 1:500. Experiments with antibodies directed against Gαi did not result in labeled tissue in catfish. Secondary antibodies were either fluorescence- coupled (dilution 1:400) (Alexa, Molecular Probes, Eugene, OR) or biotinylated (Jackson ImmunoResearch, West Grove, PA) (dilution 1:1000) that were processed with ABC (Vector) and DAB following standard methods. Controls included the omission of primary antibodies, omission of secondary antibodies, and preabsorption for 2 hr at room temperature with the blocking peptide (concentration, 4 μg/ml) supplied by Santa Cruz Biotechnology or Calbiochem. No labeled ORNs were observed under control conditions. Sections and whole-mount preparations were examined in a standard epifluorescence microscope (Zeiss) or a confocal laser scanning microscope (Olympus).
Transmission electron microscopic immunocytochemistry
Olfactory rosettes and bulbs of fixed fish were dissected and embedded in egg yolk. After fixation in 4% paraformaldehyde overnight, vibratome sections of 50 μm were collected in phosphate buffer and processed as floating sections as described for light microscopy, but omitting Triton X-100. After immunocytochemistry, selected sections and whole-mount preparations were postfixed in 2-4% buffered glutaraldehyde followed by 1% osmium tetroxide and embedded in Epon-Araldite following standard protocols as described previously (Hansen and Finger, 2000). Ultrathin sections (silver to gold) were examined in a Philips CM10 electron microscope.
DiI injections
Male and female fishes (n = 44) of the sizes mentioned above were used for 1,1′-dioctadecyl-3,3,3′,3′-tetramethylindocarbocyanine perchlorate (DiI) injections. To test whether specific types of ORN project to discrete regions of the OB, we used DiI as a retrograde postmortem tracer. Animals were anesthetized with MS222 (diluted 1:5000; Sigma) and perfused transcardially with 4% paraformaldehyde in 0.1 m phosphate buffer, pH 7.2. In some cases, the nasal cavity was gently flushed with a mixture of buffered 0.3% glutaraldehyde and 4% paraformaldehyde after anesthetization and during perfusion to stabilize the epithelial surface of the OE. The top portion of the head containing the olfactory rosettes and the OBs was dissected and left in the fixative for at least one additional night. After fixation, the bone and other covering tissues above the bulbs were removed. Small crystals of DiI were inserted under visual control into different areas of the bulbs by means of a sharpened insect needle or the end of a broken glass micropipette. To prevent the dye from inadvertent spread, the bulbs were covered with liquid agar. The tissue block then was placed into buffered 4% paraformaldehyde at room temperature for 14-30 d to permit diffusion of the dye. After the appropriate time of diffusion, the bulbs and olfactory organs were dissected from the tissue block and embedded in either egg yolk or 15% gelatin (Sigma). The block was fixed in 4% paraformaldehyde overnight. The next day, 50 μm sections were cut on a vibratome. Sections were viewed with epifluorescence in a Zeiss microscope or in a confocal laser scanning microscope (Olympus).
Of 87 injected bulbs, 15 bulbs were rejected because the dye did not travel well or the epithelium was damaged during dissection. The remaining 72 cases showed retrogradely labeled ORNs throughout the olfactory organ, which is consistent with the findings of Morita and Finger (1998). No differences were seen between male and female animals. To detect possible circannual differences, the injections were performed in every month of the year over a period of 4 years. The time of the year when the injection was performed had no obvious influence on the resulting label in the olfactory epithelium.
Transmission electron microscopy
To examine the ultrastructure of the retrogradely labeled olfactory receptor cells, selected sections were photoconverted with DAB. Photoconversion was performed according to the protocol of Sandell and Masland (1988). The sections were placed in DAB (1.25 mg/ml) dissolved in Tris buffer, pH 8.5, for 10 min and then, with a fresh supply of DAB solution, exposed to epifluorescence illumination for up to 25 min until a brown precipitate appeared. After photoconversion, the sections were postfixed in buffered 2% glutaraldehyde and 1% osmium tetroxide and embedded in Epon-Araldite for electron microscopy as described by Moran et al. (1992). Ultrathin sections (silver to gold) were examined in a Philips CM10 electron microscope.
In situ hybridization
To describe the expression pattern of receptor molecules in catfish ORNs, we tested four different catfish receptor probes: three different OR probes: CF1, GenBank accession number L09217; CF47, accession number L09221; OR202, accession number L09220 (courtesy of John Ngai, University of California Berkeley); and one V2R-type probe: CF64, accession number AY365191 (courtesy of Michele Rankin and Richard Bruch, Louisiana State University). RNA in situ hybridizations were performed on 12-15 μm cryostat sections of dissected catfish olfactory organs collected onto Superfrost Plus slides (Fisher Scientific). The sections were pretreated with 3% hydrogen peroxide to quench endogenous peroxidase and digested with Proteinase K (10-20 μg/ml) for 10-20 min to enhance probe penetration. Digoxigenin-labeled cRNA probes were hybridized at 58-60°C overnight followed by high stringency washings in 2× SSC (0.3 m NaCl, 0.03 m Na3C6H5O7) and 0.2× SSC (0.03 m NaCl, 0.003 m Na3C6H5O7) at 60°C. To visualize the hybridized probes we used either alkaline phosphatase-labeled sheep anti-digoxigenin antibodies (Roche Biochemicals, Indianapolis, IN) or peroxidase-labeled sheep anti-digoxigenin antibodies (Roche Biochemicals). For alkaline-phosphatase-based detection, nitroblue tetrazolium chloride and X-phosphate-5-bromo-4-chloro-3-indolyl-phosphate rendered a light purple chromogenic signal. Alternatively, an enhanced fluorescent signal was produced by the fluorophores tyramide cyanine 3 or tyramide fluorescein. For peroxidase-labeled antibodies the tyramide signal amplification technique (Molecular Probes) was used that enhances the signal of low copy numbers of mRNA up to 1000-fold.
Electrophysiological experiments
Animal preparation. Each catfish was immobilized with an initial intramuscular injection of Flaxedil (gallamine triethiodide, 0.03 mg/100 gm body weight). Subsequent injections of Flaxedil were provided as needed during experimentation via a hypodermic needle embedded in the flank musculature. The catfish was wrapped in wet tissue paper and secured with orbital ridge clamps in a custom-made Plexiglas container. The gills were irrigated via a constant flow of CFTW containing the general anesthetic MS-222 (ethyl-m-aminobenzoate methane sulfonic acid; initial concentration, 50 mg/l; Sigma). Minor surgery was performed to remove the skin and connective tissue superficial to the olfactory epithelium to facilitate electrode placement.
Stimulus solutions and delivery. The odorants included l-amino acids (alanine, arginine, glutamate, and methionine), bile salts [sodium salts of taurocholic acid (TCA) and taurolithocholic acid (TLCA)], and ATP (Sigma). Test solutions of amino acids, bile salts, and ATP were diluted daily with CFTW to experimental concentrations from stock solutions and pH adjusted to match control CFTW, pH ∼8.7, bathing the olfactory epithelium. Analysis of the CFTW by the Dionex AAA-Direct Amino Acid Analysis System (sensitivity in the mid femtomole to low picomole range) indicated that free amino acids were not present.
Stimuli were delivered via a “gravity-feed” system described previously (Sveinsson and Hara, 2000). Briefly, stimulus solutions and the CFTW used to bathe the olfactory epithelium were delivered through separate Teflon tubes (diameter 0.8 mm) at a flow rate of 5-7 ml/min. A foot switch connected to an electronic timer (Model 645, GraLab Instruments Division, Dimco-Gray Corporation, Centerville, OH) triggered a pneumatic actuator valve to introduce the stimulus for 3 sec applications. CFTW continuously irrigated the olfactory epithelium to (1) prevent the epithelium from desiccating, (2) facilitate stimulus delivery, (3) avoid introduction of mechanical artifacts, and (4) rinse the olfactory organ clear of any residual stimuli for a minimum of 2 min between stimulus applications.
Pharmacological agents
Forskolin (an adenylate cyclase activator; Sigma) and 1,9-dideoxyforskolin (inactive analog of forskolin; Calbiochem) were dissolved in dimethyl sulfoxide (DMSO) and added to CFTW. U-73122, a potent inhibitor of agonist-induced phospholipase C (PLC) activation (Yule and Williams, 1992), and U-73343 (Biomol Research Laboratories, Plymouth Meeting, PA), a weak inhibitor of agonist-induced PLC activation, were prepared in the same manner as forskolin. DMSO, to be used as a control, was adjusted in concentration to match that concentration of DMSO in the pharmacological solutions.
Electrophysiological recording techniques
We recorded underwater electro-olfactograms (EOGs) in vivo by means of calomel electrodes via Ringer's agar-filled capillary pipettes. The slow DC potential changes in the water above the olfactory epithelium represent the summed generator potentials of the ORNs in response to odorants (Ottoson, 1971). The pipette of the active electrode was positioned near the midline raphe of the olfactory organ; the pipette of the reference electrode was placed against the skin adjacent to the olfactory cavity. The fish was grounded via a hypodermic needle inserted into the flank musculature. The EOG was amplified (Grass P-18; Astro-Med, West Warwick, RI), displayed on an oscilloscope and DC chart recorder, digitized, and stored on a video channel of a high-fidelity VCR.
In vivo recordings of multiunit ORN activity were made using metal-filled glass capillary electrodes plated with platinum (Pt) (ball diameter, ∼18-20 μm; cross-sectional area of ∼300 μm2; impedance, 10-20 kΩ) placed against the sensory face of an olfactory lamella (Gesteland et al., 1959; Caprio, 1995). The electrode was resistance-capacitance-coupled (220 pF capacitor, 20 MΩ resistor) to a high-impedance probe at one input, with the other input grounded via a hypodermic needle embedded in the flank musculature of the fish. The multiunit neural activity was amplified (Grass P511; bandpass 30-300 Hz), observed on an oscilloscope, integrated (0.5 sec) and displayed on a pen recorder, digitized, and stored on a video channel of a high-fidelity VCR.
Pharmacological treatments
Electrophysiological experiments were used to investigate the signaling cascade used by ORNs to transduce odorant information. Each experiment consisted of three stages: odorant responses in the absence of the pharmacological agent (stage 1), odorant responses during pharmacological treatment (stage 2), and responses to the odorants subsequent to removal of the pharmacological agent (stage 3).
During stage 1, CFTW continuously bathed the olfactory epithelium for a minimum of 10 min before stimulus application. For the forskolin experiments, the odorant stimuli were adjusted in concentration to result in an EOG response with approximately the same relative magnitude as the EOG response to forskolin. Some stimulus solutions involved mixtures of odorants, in which case each component of a stimulus mixture was also adjusted in concentration to result in an approximately equal EOG response magnitude when tested individually. The adjusted concentrations ensured that the odorant stimuli and forskolin were equipotent to the cAMP signaling pathway. Neither 1 μm U-73122 nor 1 μm U-73343 elicited appreciable EOG responses; therefore, the concentrations for the odorant stimuli were chosen to reflect those used in the forskolin experiments. CFTW and DMSO served as controls.
During stage 2, the pharmacological agent at the previously adjusted concentration continuously bathed the olfactory epithelium for a minimum of 10 min before stimulus application. All odorants tested during stage 2 were dissolved in the pharmacological agent. Controls were aliquots of the adapting solution, DMSO and CFTW, respectively.
During stage 3, CFTW continuously bathed the olfactory epithelium for 10 min before stimulus application. Stimuli and controls were identical to those described during stage 1.
Electronic figure composition
Light micrographs were either scanned from film images or digitally imaged directly on a SPOT RT (Diagnostic Instruments, Sterling Heights, MI) camera attached to the Olympus or Zeiss microscope. Electron micrographs were scanned either from prints or film negatives on a flatbed scanner (UMAX Powerlook III, Dallas, TX). Images were then processed in Photoshop (Adobe Systems, Mountain View, CA). Adjustments to contrast and brightness were made electronically. Occasional dirt specks were removed electronically from areas of the figures that did not contain images of tissue.
Results
Even at the light microscopic level, we could distinguish three types of ORN retrogradely labeled by DiI injections into the OB (Fig. 2C-F). Ciliated ORNs possess long, undulating apical processes usually radiating from an olfactory knob at the distal ends of tall ORNs (Fig. 2C,D). Crypt receptor cells were obvious because of their typical ovoid shape and location in the top half of the olfactory epithelium (Fig. 2C,E). Most of the short (but not ovoid) and intermediate height ORNs bore small apical endings on olfactory knobs that were less pronounced than in ciliated ORNs. Ultrastructural analysis demonstrated that these small apical endings belonged to microvillous ORNs (Figs. 2C,F, 3). Despite this general morphological pattern, some cells of short and intermediate height bore cilia, whereas a few tall cells had small microvillous-like apical endings. To investigate the ultrastructure of the labeled ORNs, selected vibratome sections were photoconverted after injections into dorsal OB, midventral OB, and the two specific ventral sites for crypt ORNs. The photoconverted ORNs examined at the electron microscopic level matched our presumed morphological categorizations on the basis of the light microscopic findings. Transmission electron microscopy sections proved that ciliated ORNs were retrogradely labeled by injections into the ventral areas (Fig. 3A), and microvillous ORNs were labeled by injections into the dorsal areas (Fig. 3C). Crypt ORNs (Fig. 3B) occurred only when DiI crystals were placed into the two specific ventral sites.
Figure 2.

Retrograde postmortem DiI tracing from the olfactory bulb. A, Dorsal view of the head of a catfish showing the relationship between the olfactory organ and the olfactory bulb. The tissue above the olfactory structures was removed. Medial is up; anterior is to the left. B, Ventral view of the olfactory bulb in situ showing the approximate size of a typical injection of DiI. Tissue was removed to enable the DiI injection into the ventral OB. C, Three different morphological types of ORNs are retrogradely labeled after injections into the OB: left to right, microvillous ORNs with cell bodies in the middle to bottom part of the epithelium, ciliated ORNs with soma deep in the epithelium, and crypt ORNs, which reside in the top half of the epithelium. D-F, Sections through olfactory lamellas showing sensory cells on both top and bottom faces of a single lamella with the lamina propria forming the core of the structure. D, Injections into ventral and some medial sites retrogradely label tall ciliated ORNs. E, A ventrally placed injection of DiI retrogradely labels crypt cells as well as some additional cell types. Because the DiI injection site was large relative to the glomerular targets of crypt cells, other ORN cell types also were labeled in this case. Inset, Higher magnification of a crypt ORN and a ciliated ORN. Arrows point to axons. F, Injections into dorsal sites lead to labeled short microvillous ORNs.
Figure 3.

Ultrastructure of retrogradely labeled ORNs after various DiI injections in the OB. The DiI fluorescence is converted to a dark, electron-dense product with DAB. A, Labeled ciliated ORN (asterisk) is apparent adjacent to an unlabeled microvillous ORN (Mr). B, Labeled crypt ORN surrounded by unlabeled supporting cells (Sc) and microvillous ORNs (Mr). In the crypt ORN, both the membranes of the occult cilia (arrows) and the apical microvilli are labeled. Nu, Nucleus. C, DiI-labeled microvillous ORN. The fine microvillous processes are significantly smaller and distinct from nearby unlabeled ORN cilia (arrows).
To determine the pattern of projections of different ORN types into the OB, we divided the OB into different injection regions. These regions were defined not only by topographic location, e.g., anterior, posterior, and lateral, but also by morphological features such as obvious fiber bundles or the irregular shape of the bulb. This was important because in some animals the bulb was slightly rotated either to the lateral or medial side. DiI injections into different sites of the OB resulted in a distinct pattern of cell projections. We divided the types of ORN into three categories on the basis of their relative location in the height of the olfactory epithelium and, in the case of the crypt ORNs, on their unmistakable shape. Tall cells correspond to different sizes of ciliated ORNs with cell bodies in the bottom one-third of the epithelium; medium and short cells are considered microvillous ORNs in the top two-thirds of the epithelium; crypt ORNs occupy the top half of the epithelium.
The main difference in projections of ciliated and microvillous ORNs related to the dorsal versus the ventral regions of the bulb (Fig. 4). Tall ciliated ORNs were labeled by injections into the areas on the ventral side of the OB. In contrast, injections into the dorsal-most areas labeled medium and short presumed microvillous ORNs in the epithelium. Injections into the medial or lateral areas of the OB showed a less segregated pattern of label. Only injections into the medial middle area of the bulb resulted in predominantly tall ciliated ORNs in the olfactory epithelium, as summarized in Figure 4. The areas anteromedial and posteromedial and the three lateral injection sites anterolateral, middle lateral, and posterolateral revealed a mixed population of short, intermediate, and tall ORNs in the olfactory epithelium, bearing either cilia or microvilli.
Figure 4.

Semi-schematic summary diagram summarizing the results of the DiI retrograde labeling experiments. Dye placements in the dorsal part of the bulb generally labeled microvillous ORNs, whereas placements along the medial and ventral face predominantly label ciliated ORNs. Crypt cell ORNs are retrogradely labeled only when the DiI covers two relatively restricted regions along the midventral surface of the OB.
Labeled crypt ORNs occurred in the olfactory epithelium only after DiI injection into two discrete areas in the ventral bulb, one more anteriorly and one more posteriorly. Injections into the medial and lateral areas that led to mixed populations of labeled cells did not label crypt ORNs, nor were crypt ORNs detected in any injection into dorsal sites.
Counting types of ORN retrogradely labeled from particular dorsal or ventral sites in the OB proved that significantly different populations of ORN were labeled depending on the location of the DiI placement into the OB (Table 2). Injection sites on the ventral and medial OB resulted mostly in labeled ciliated ORNs, whereas injections in the dorsal anterior and posterior OB labeled mostly microvillous ORNs. The total number of crypt cells labeled from the two specific ventral sites of the OB was not as high as the number of microvillous and ciliated ORNs labeled by injections in dorsal and ventral OB (Table 2), indicating that the crypt ORNs are a relatively rare cell type projecting only to small regions in the OB. Consequently, ciliated ORNs projecting to neighboring glomeruli were also labeled by injections targeted to the crypt cell recipient zones.
Table 2.
Distribution of labeled ORN cell types according to site of injection in OB
|
Injection site |
Ciliated ORNs |
Microvillous ORNs |
Crypt cell ORNs |
Total |
|---|---|---|---|---|
| Dorsal OB | 3 | 13 | 0 | 16 |
| 4 | 17 | 0 | 21 | |
| 1 | 11 | 0 | 12 | |
| 3 | 10 | 0 | 13 | |
| 5 | 13 | 0 | 18 | |
| Total | 16 (20%) | 64 (80%) | 0 (0%) | 80 |
| Ventral/medial | 24 | 2 | 0 | 26 |
| 21 | 4 | 0 | 25 | |
| 8 | 4 | 0 | 25 | |
| 17 | 1 | 0 | 18 | |
| 10 | 2 | 0 | 12 | |
| Total | 80 (86%) | 13 (14%) | 0 (0%) | 93 |
| Ventral/crypt | 1 | 2 | 8 | 11 |
| 0 | 1 | 6 | 7 | |
| 8 | 5 | 5 | 18 | |
| 9 | 4 | 8 | 21 | |
| 14 | 5 | 4 | 23 | |
| Total
|
32 (40%)
|
17 (21%)
|
31 (39%)
|
80
|
Counts of the type of ORN retrogradely labeled by different injections of Dil into the olfactory bulb are shown. Each row is a different case. The total number of labeled cells is given for a representative sample of 300 μm of epithelium from each selected section. This distribution is significantly different than chance (X2 test; p <0.001). Because the crypt cell projecting areas are small (on the basis of the size of Gαo-immunoreactive glomeruli) relative to the size of the Dil injections, other cell types are frequently labeled by injections into the crypt cell target zone of the ventral OB, but crypt cells are never labeled by injections remote from their specific small targets in the ventral OB.
In summary, microvillous ORNs project mostly to the dorsal and lateral portions of the olfactory bulb, whereas ciliated ORN projections predominate ventrally and along the medial side of the OB. Crypt cell ORNs project to two small areas of the ventral OB (Fig. 4).
In situ hybridization with receptor probes
The procedure of in situ hybridization has a strong impact on tissue preservation. Fragile structures such as membranes and especially microvilli and cilia are easily and often damaged, e.g., by the incubation in proteinase K necessary to permeabilize the tissue. On the basis of light and electron microscopic experience (see above), the tall ORNs are ciliated ORNs, whereas ORNs with cell bodies higher in the epithelium tend to be microvillous ORNs. Most of the intermediate ORNs bear microvilli, although some intermediate ORNs may bear cilia instead. Crypt ORNs that would be easily distinguished even in in situ preparations because of their ovoid cell body and their location in the uppermost portion of the OE were not reactive with the in situ probes used in this study. As also seen in G-protein experiments (see below), some cells located near the base of the epithelium reacted with the in situ probes. These cells did not reach the top portion of the epithelium and were considered to be basal cells or ORNs in the process of differentiation.
OR-type receptor probes
The three OR-type probes tested (CF1, CF47, OR202) labeled intermediate and tall ORNs. These cells were slender, with cell bodies located predominantly in the bottom half of the OE, and therefore are interpreted to be ciliated ORNs. Each probe labeled only a small fraction of the numerous intermediate and tall cells. The absolute number of labeled ORNs varied slightly between individuals.
OR-labeled cells occurred in all areas of the lamellas from the midline raphe to the peripheral and basal areas close to the nonsensory epithelium (Fig. 5A,C). Within the lamellas, the OR-positive ORNs were spaced more or less evenly.
Figure 5.
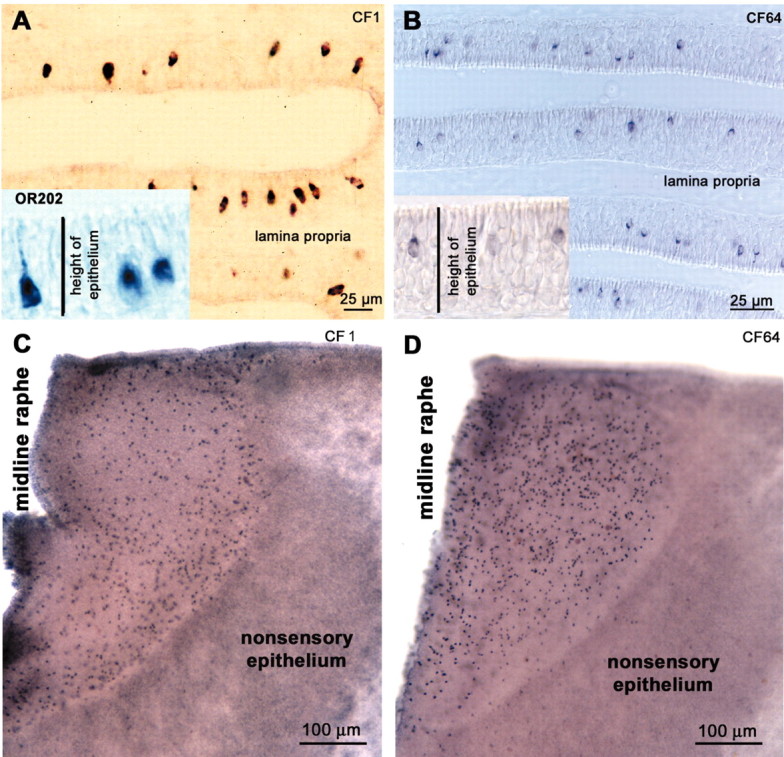
In situ hybridization of olfactory receptor probes in the catfish OE. A, B, Cryostat sections (12 μm). A, The probes against OR-type receptors (OR202, CF1) hybridize to cells with somata in the bottom half of the epithelium. B, The probe directed against CF64, a V2R-type receptor, hybridizes with cells generally situated in the top half of the epithelium. C, D, Whole-mount in situ hybridization of individual lamellas shows the overall pattern of distribution of ORNs reacted with in situ probe CF1 (OR type) and CF64 (V2R type). Note that the ORNs expressing OR-type reactivity (C) are denser near the sensory-nonsensory boundary, whereas the V2R-expressing ORNs (D) lie preferentially near the raphe.
V2R-type receptor probe
The only V2R-like probe (CF64) available labeled short or intermediate ORNs. Their nuclei were predominantly located in the top half of the OE. Because of their position and morphology, these cells were considered microvillous ORNs (Fig. 5B,D). Within the lamellas, the pattern of distribution of V2R-positive ORNs varied between individuals.
G-protein immunocytochemistry
Antisera directed against different G-protein α-subunits were used to examine whether the expression of these transduction-related proteins correlated with the morphological type of ORN and, if so, whether the distribution of these G-proteins in the glomeruli of the olfactory bulb corresponded to our findings on the basis of DiI injections. Of the four antisera used, only three (Gαolf/s, Gαo, and Gαq/11) resulted in unambiguous label in catfish tissue. Tissue sections of the olfactory epithelium and the OB as well as whole-mount preparations of single olfactory lamellas and OBs revealed distinct labeling for Gαolf/s, Gαo, and Gαq/11 (Fig. 6).
Figure 6.
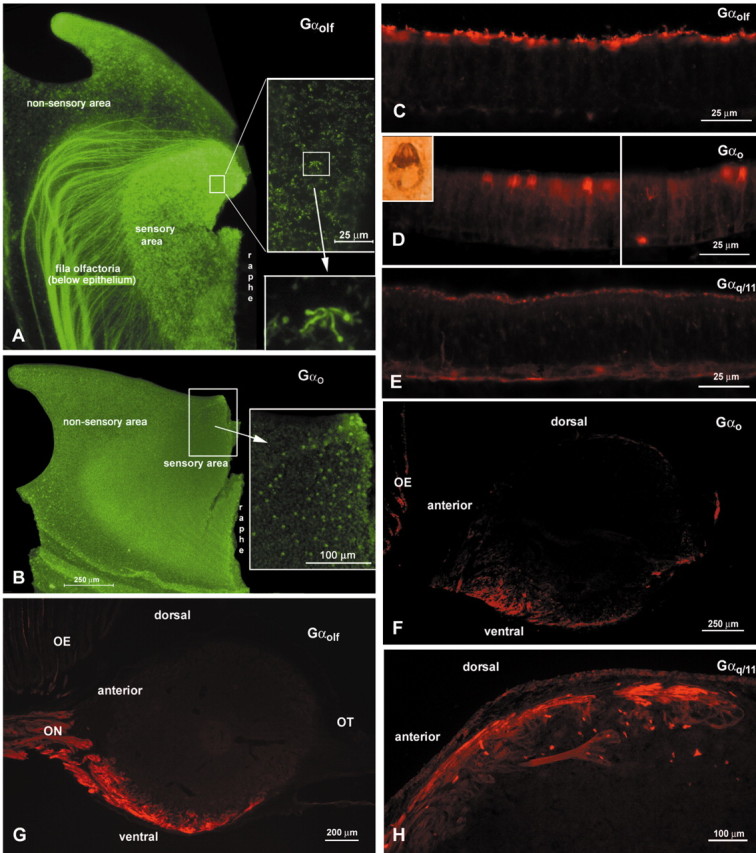
G-protein immunoreactivity in the epithelium and OB. A, B, Whole-mount preparations of catfish lamellas viewed en face. A, Gαolf/s immunoreactivity is present in ORNs relatively evenly distributed over the sensory area. Numerous labeled axon bundles of the fila olfactoria are evident sweeping beneath the nonsensory area of the lamella. Insets, Higher magnification of indicated areas of the OE. Cilia are readily apparent in the higher magnification, bottom inset. B, A similar view to A but showing Gαo immunoreactivity in crypt cell ORNs. The immunoreactive ORNs are confined primarily to the dorsomedial portion of the sensory area. The number of crypt ORNs is substantially lower than that of ciliated ORNs. C-E, Cryostat sections of catfish OE showing reactivity to various G-protein antisera. C, Strong Gαolf/s labeling is evident in cilia at the surface of the OE. Cell membranes are faintly labeled. D, Gαo antisera strongly label the cytoplasm of crypt ORNs. Inset, Higher magnification of a single crypt ORN, reacted with peroxidase-labeled detection system and DAB. Occasional labeled basal cells also are evident. E, Gαq/11 immunoreactivity is visible in many but not all microvillous ORNs. Cell membranes are labeled only faintly. F-H, Sagittal sections through the OB showing immunoreactivity to different G-protein antisera in the olfactory nerve and glomerular layers of different regions. Anterior is to the left. F, Gαo antisera label two distinct areas of the ventral OB corresponding in position to the areas receiving input from crypt cell ORNs. G, Gαolf/s antiserum labels axons projecting to the ventral glomeruli of the OB. H, Gαq/11 immunoreactivity in glomeruli and the nerve layer of anterodorsal areas of the OB.
Gαolf/s immunoreactivity
In the sensory areas of the olfactory epithelium, the Gαolf/s antiserum labeled only tall cells that were distributed evenly over the lamellas (Fig. 6A). The Gαolf/s label was most prominent in the cilia (Fig. 6C). Ultrathin sections revealed that, as seen at the light microscopic level, Gαolf/s is present in the cilia and faintly in the membranes of ciliated ORNs (Fig. 7A). Although on the light microscopic level all ciliated ORNs seemed to be immunoreactive for Gαolf/s, we found few unstained ciliated ORNs at the electron microscopic level.
Figure 7.
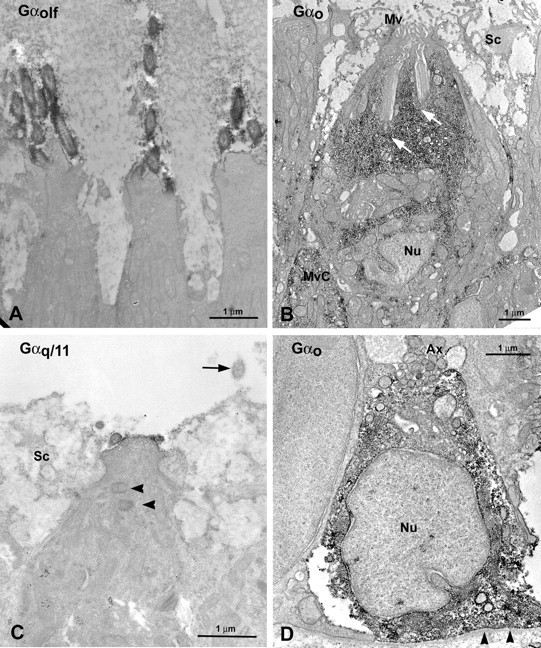
Ultrastructure of ORNs exhibiting immunoreactivity to various G-protein antisera. A, Gαolf/s labels ciliated ORNs. Immunoreactive cilia are clearly evident as dark oval profiles. B, Gαo immunoreactivity is evident throughout the cytoplasm of crypt ORNs. These small ORNs show characteristic cilia contained within the substance of the cell body situated entirely within the uppermost part of the epithelium. Arrows indicate occult cilia. C, Gαq11 immunoreactivity is seen in the apical end of microvillous ORNs. The cell body of the microvillous ORN is wider than those of ciliated ORNs (compare A). In the top portion of the microvillous cell, centrioles (arrowheads) are visible, typical for fish microvillous ORNs. Note the unlabeled profile of a nearby cilia from a ciliated ORN (arrow). D, Gαo immunoreactivity also is present in the cytoplasm of few basal cells. Mv, Microvilli; MvC, microvillous ORN; Nu, nucleus; Sc, supporting cell.
Numerous bundles of Gαolf/s-immunoreactive fibers were present in the olfactory nerve layer in ventral and medial areas of the OB (Fig. 6G). In addition, smaller numbers of Gαolf/s-immunoreactive fibers were present in the olfactory nerve layer of the rostrolateral portion of the OB. Some small bundles of labeled fibers coursed dorsoventrally in the caudal portion of the bulb.
Gαo immunoreactivity
Antibodies against Gαo strongly labeled the cytoplasm of crypt ORNs (Fig. 6D) and the cytoplasm of some basal cells. The Gαo immunoreactivity revealed that most of the crypt ORNs were located in the dorsomedian region of the lamellas close to the midline raphe (Fig. 6B). In addition, faint Gαo label was present in the membranes of some short and intermediate height cells, which were apparently microvillous ORNs. These cells appeared evenly distributed over the lamellas, although a rigorous quantitative analysis was not undertaken. In ultrathin sections of Gαo preparations, the membranes of some microvillous ORNs showed faint label, whereas crypt ORNs (Fig. 7B) as well as some basal cells were strongly labeled throughout the cytoplasm (Fig. 7D). The Gαo antibody labeled the majority of, but not all, crypt ORNs but only a few microvillous ORNs.
In the OB, Gαo labeling occurred in two distinct areas of the glomerular layer, one anteroventral and one posteroventral (Fig. 6F). These areas corresponded to the sites of DiI injections that resulted in retrogradely labeled crypt ORNs in the epithelium.
Gαq/11 immunoreactivity
Gαq/11-like immunoreactivity occurred in a punctate manner on the surface of the olfactory epithelium (Fig. 6E). Examination of ultrathin sections showed Gαq/11-labeled microvilli in a subset of microvillous ORNs (Fig. 7C), presumably corresponding to the punctate apical label seen at light microscopic levels. Somatic membranes of these cells were seldom labeled and then only faintly. The height of these cells within the epithelium was intermediate, consonant with these cells being microvillous ORNs. Gαq/11 antisera labeled many, but by no means all, microvillous ORNs.
In the olfactory bulb, the antibodies against Gαq/11 mostly labeled glomeruli in dorsal aspects of the bulb (Fig. 6H). Large glomeruli located anteriorly and posteriorly were Gαq/11 positive. Some smaller glomeruli appeared in lateral and medial locations.
In summary, ciliated ORNs express Buck and Axel (1991) OR-type receptors with Gαolf/s and project mostly to ventrally situated glomeruli. The V2R-type receptor probe hybridizes to intermediate height receptor cells, which are apparently microvillous ORNs. Most of the microvillous ORNs express Gαq/11 and project to dorsal OB. Crypt ORNs express Gαo and project to two unique glomerular territories along the ventral midline of the OB; the receptor molecules used by this cell type are unknown.
Electrophysiology and pharmacological agents
Effects of forskolin on odor-evoked responses
We used the EOG to assess ORN population responses to various odorants and drugs. Simultaneous recordings of the EOG and multiunit responses in the epithelium show that the magnitude of the negative-going component of the EOG correlates well with the level of multiunit activity in the OE (Fig. 8A). Accordingly, we used the magnitude of the negative-going component of the EOG as a basis for comparison across treatments.
Figure 8.

The effects of forskolin on odorant-evoked responses. A, EOG response and neural activity for ATP and control in two different fishes. Because only the negative portion (upward deflection) of the EOG response to ATP correlated with the phasic increase in neural activity, only the magnitude of the negative-going EOG response was quantified from trace B2 and graphed in C. B, Representative EOG recordings in response to a mixture of l-amino acids (AA) (0.01 μm alanine, methionine and 0.1 μm arginine, glutamate), 10 μm bile salts (BS) (Na+ taurocholate and taurolithocholate), and 10 μm ATP before (1), during (2), and after (3) treatment with 5 μm forskolin (For). Responses to DMSO and CFTW control (C) are also shown. C, Percentage of EOG responses (mean ± SD) in the absence of forskolin treatment compared with that during forskolin treatment (3-5 μm) for mixtures of l-amino acids (0.01-1 μm), bile salts (10 μm), ATP (3-40 μm), and a forskolin control (n = 3 fish). Asterisks in B and C designate EOG responses significantly reduced in the presence of forskolin (one-way ANOVA; Tukey post hoc; p < 0.05). D, Representative EOG responses to controls (CFTW and DMSO) and 5 μm 1,9-dideoxyforskolin (Deoxy).
To determine whether transduction of amino acid, bile salt, or nucleotide odorant information in catfish involves the Gαolf/s/cAMP second messenger pathway, forskolin (an adenylate cyclase activator) was applied continuously to the olfactory epithelium on the assumption that the treatment would either decrease the number of adenylate cyclase molecules available for G-protein-coupled receptor activation or desensitize certain components, resulting in an attenuation of responses to odorants that activate this pathway. Forskolin, when applied to the olfactory epithelium, elicited a robust EOG response (Fig. 8B1). By contrast, 5 μm 1,9-dideoxyforskolin (an inactive analog of forskolin), which is equivalent to the highest concentration of forskolin tested, did not evoke an appreciable EOG response above that of control (n = 3 fish) (Fig. 8D). Therefore, forskolin was adjusted in concentration to result in an EOG response approximately equivalent to the EOG response to the odorant stimuli (Fig. 8B1). This process equalizes the potency of the test stimuli to the cAMP signaling pathway. During forskolin (3-5 μm) treatment, the magnitude of the EOG responses to a mixture of l-amino acids (alanine, arginine, glutamate, and methionine) and bile salts (TCA and TLCA) was reduced by 70 and 74%, respectively, of the responses obtained in the absence of forskolin, whereas the magnitude of the EOG responses to ATP remained relatively unaffected (Fig. 8B,C). Importantly, adaptation to the mixture of bile salts did not attenuate the response to forskolin (n = 2; data not shown), which indicates that forskolin, the structure of which grossly resembles that of bile salts, did not compete for the bile salt receptors.
Effects of U-73122 and U-73343 on odor-evoked responses
To determine whether transduction of amino acid, bile salt, and nucleotide odorant information in catfish involves the IP3 second messenger pathway, U-73122 (a membrane-permeant potent inhibitor of agonist-induced PLC activation) was applied continuously to the olfactory epithelium. The assumption was that U-73122 treatment would inhibit Gαq coupling with PLC resulting in an attenuation of the response to odorants using this pathway. U-73122 (1 μm) did not elicit an appreciable EOG response (Fig. 9A1)(<0.09 mV); therefore, the concentrations of the odorant stimuli were selected to be equivalent to those used during the forskolin treatment. During treatment with 1 μm U-73122 (n = 3 fish), the magnitude of the response to a mixture of 0.1 μml-amino acids was reduced by two-thirds; however, this response remained significantly greater than the control response to U-73122 alone (one-way ANOVA; Tukey post hoc; p < 0.05). The EOG response to a mixture of 10 μm bile salts and to 40 μm ATP was not significantly affected by the presence of U-73122 (Fig. 9A,C) (one-way ANOVA; Tukey post hoc; p > 0.05). Furthermore, treatment with 1 μm U-73343 (a weak inhibitor of agonist-induced PLC activation) (n = 3 fish) had a less significant effect (one-way ANOVA; Tukey post hoc; p < 0.05) on the magnitude of the EOG response to amino acids than U-73122, whereas the magnitude of the EOG responses to bile salts and ATP remained unaffected (Fig. 9B,D).
Figure 9.

The effects of the potent inhibitor of agonist-induced PLC activity U-73122 (A) and its weaker analog U-73343 (B) on odorant-evoked responses. A, Representative EOG recordings to a mixture of 0.1 μml-amino acids (asterisk) (AA: alanine, arginine, glutamate, and methionine), 10 μm bile salts (BS: Na+ taurocholate and taurolithocholate), and 40 μm ATP before (1), during (2), and after (3) treatment with 1 μm U-73122. B, Representative EOG recordings in response to a mixture of 0.1 μml-amino acids (asterisk) (AA: alanine, arginine, glutamate, and methionine), 10 μm bile salts (BS: Na+ taurocholate and taurolithocholate), and 40 μm ATP before (1), during (2), and after (3) treatment with 1 μm U-73343. Responses to DMSO, solvent for U-73122 and U-73343, and CFTW control also are shown. C, D, Percentage of EOG responses (mean ± SD) to the pharmacological controls (U-73122 in C; U-73343 in D), l-amino acids, bile salts, and ATP during treatment with U-73122 (C) and U-73343 (D); n = 3 fish. The concentrations of the test stimuli in C and D are the same as in A and B. An asterisk designates EOG responses recorded during drug treatment that were significantly less than the EOG responses recorded in the absence of the pharmacological agent (one-way ANOVA; Tukey post hoc; p < 0.05).
Taken together, these physiological studies are consistent with the interpretation that ORN responses to bile salts are mediated predominantly by ORNs using the Gαolf/s transduction pathway. In contrast, responses to nucleotides are unaffected by blockade of this pathway. Because blockers of both Gαolf/s and PLC pathways diminish responses to amino acids, both transduction pathways are implicated in the detection of amino acids by different populations of ORNs.
In summary, antisera to the different G-protein α subunits labeled different types of ORNs and different glomerular territories in the OB. Taken together with the findings of Nikonov and Caprio (2001), the immunocytochemical and retrograde DiI tracings indicate that Gαolf/s-reactive, ciliated ORNs project to glomeruli in the medial and ventral portions of the OB responding to either amino acids or bile salts. Gαo antisera strongly label crypt cell ORNs and two glomerular regions on the ventral surface of the OB; however, nothing is known about the function of these ORNs. In addition, some microvillous ORNs exhibit fainter reactivity for Gαo. Finally, Gαq/11 immunoreactivity is present in a subpopulation of short microvillous ORNs and in the glomerular layer of the anterior dorsal and dorsolateral areas of the OB, areas that are responsive to amino acids (Fig. 10). Responses to nucleotides are mediated by microvillous ORNs but via a mechanism that does not involve PLC activation.
Figure 10.

Schematic drawing of the olfactory bulb summarizing our results. Dorsal and ventral views show the type of ORNs projecting to each region of the bulb along with their G-proteins and receptor types where known. The color coding of the OB reflects the type of odorant that activates bulbar neurons in that region. Blue depicts amino acid responses, green shows bile salt responsive regions, and red indicates areas responsive to nucleotides. The different types of ORNs projecting to a particular area are shown as icons. Crypt ORNs express Gαo and project to two areas in the ventral OB, nominally within the large amino acid-responsive area; however, because the projections of crypt ORNs are small, probably restricted to a few glomeruli, the physiology of these small regions is not clearly defined.
Discussion
The present study demonstrates that in catfish, as in rodents, the ORNs of the extended olfactory system are divisible into classes defined both by morphology and by transduction cascade. Furthermore, each of these classes of receptor cells projects to a restricted set of glomeruli within the OB. We identify three classes of ORNs in catfish: (1) tall ciliated cells using Gαolf/s and projecting predominantly to medially and ventrally situated glomeruli; (2) microvillous ORNs projecting to dorsal glomeruli, some of which use Gαq/11; and (3) crypt-cell ORNs using Gαo and projecting to two restricted glomerular territories at the anterior and posterior extremes of the ventralmost OB (Fig. 10).
Odorant specificity and ORN type
Fish respond to various classes of olfactory stimuli: amino acids, nucleotides, bile salts, and pheromones (Thommesen, 1983b; Carr, 1988; Hara and Zhang, 1996; Hara and Zhang, 1998; Sorensen and Caprio, 1998). The former two are generally feeding stimulants, whereas the latter two are implicated in social interactions (Sorensen and Caprio, 1998). Whether a particular type of ORN is invariably activated by a particular class of stimulus may vary according to the different species of fish. Comparison of the results of our DiI and immunocytochemistry experiments with a recent electrophysiological study in catfish (Nikonov and Caprio, 2001) leads to three conclusions regarding the correlation between receptor cell type and function. First, a subset of microvillous ORNs projecting to the dorsal OB mediates the responses to nucleotides. Second, ciliated ORNs projecting to the medial face of the OB mediate the response to bile acids. Finally, other ciliated ORNs mediate much, but not all, of the responsiveness to amino acids. Some responses to amino acids appear to rely on a PLC-based transduction pathway in microvillous ORNs projecting to the anterior part of the dorsolateral segment of the OB.
Nucleotides
Our studies suggest that transduction of nucleotide odorants by microvillous ORNs does not rely on a Gαq/11/PLC transduction cascade. The physiological studies of Nikonov and Caprio (2001) demonstrate that response to nucleotides occurs primarily within the dorsal and caudolateral OB. Placement of DiI into this same area of the OB predominantly labels microvillous ORNs; however, only a few Gαq/11-positive glomeruli are present in this region, suggesting that nucleotide-sensitive microvillous ORNs may not use Gαq/11. Similarly, treatment with U-73122 and U-73343 (inhibitors of PLC activation) does not attenuate responses to nucleotides, indicating that nucleotide-sensitive ORNs use a transduction mechanism that does not act via a PLC mechanism. Polyamine odorants also appear to be detected via a transduction cascade not involving either cAMP/Gαolf or PLC/IP3 systems (Rolen et al., 2002, 2003a). Additional studies are necessary to determine the transduction cascade underlying olfactory detection of nucleotides in catfish.
Bile salts
Responses to bile salts occur predominantly in the medial part of the olfactory bulb (Nikonov and Caprio, 2001), including dorsal and ventral aspects. Our anatomical results demonstrate that this medial face of the OB receives input predominantly from ciliated ORNs expressing Gαolf/s. Accordingly, the ciliated Gαolf/s-expressing ORNs projecting to the medial OB likely mediate detection of bile salts. In studies on salmonids, Thommesen (1983a) likewise attributed sensitivity to bile salts to ciliated ORNs. This conclusion also is supported by our pharmacological results: only forskolin, which disrupts the Gαolf/cAMP transduction system, attenuated the EOG response to bile salts, whereas inhibitors of the PLC pathway had no effect.
Amino acids
Responses to amino acids are prevalent in the rostral, ventral, and dorsolateral OB (Nikonov and Caprio, 2001), where ciliated cell projections predominate (present study). The conclusion that some ciliated ORNs mediate detection of amino acids is corroborated by studies in trout, goldfish, and zebrafish. Zielinski and Hara (1988) reported responses to amino acids in trout larvae at a time when only ciliated ORNs are present in the OE. Likewise, during regeneration after axotomy and bulbectomy in goldfish, responses to amino acids were correlated with the presence of ciliated ORNs (Zippel et al., 1996, 1997). That forskolin significantly reduces responses to amino acid odorants further supports this conclusion.
Other studies, however, attribute amino acid responses to microvillous ORNs. In salmonids, Thommesen (1983a) found responses to amino acids in the epithelium correlated with the presence of microvillous ORNs. Speca et al. (1999) postulated that microvillous ORNs mediate amino acid signals in goldfish. Hamandi et al. (2001a,b) report that in a carp, microvillous ORNs project to the posterolateral OB, which is crucial for feeding-related behaviors, thereby implicating microvillous ORNs in responses to food odors. In the present study, a subset of microvillous ORNs, immunoreactive for Gαq/11, project to the anterodorsal areas of the OB that are responsive to amino acids. These findings are consistent with several other studies that support the concept that subsets of both microvillous and ciliated ORNs respond to amino acids. In salmonids (Hara and Zhang, 1996, 1998), amino acids elicit responses in lateroposterior sites of the OB, sites that in catfish receive projections from both microvillous and ciliated ORNs (this study). A recent study by Sato and Suzuki (2001) reported that both microvillous and ciliated ORNs respond to amino acids in rainbow trout, with ciliated ORNs serving as “generalists,” whereas microvillous ORNs are “specialists.”
The hypothesis that subpopulations of both ciliated and microvillous ORNs are capable of responding to different amino acids is consistent with our electrophysiological results. Treatment with either forskolin (which disrupts the Gαolf/cAMP pathway) or U-73122 and U-73343 (which disrupts the PLC transduction cascade) led to partial attenuation of EOG responses to amino acids. Nikonov and Caprio (2001) recorded amino acid responses from anterodorsal areas of the OB where we find projections of microvillous ORNs expressing Gαq/11 and from ventral areas of the OB where we find Gαolf/s-positive ciliated ORNs. Two different second messengers involved in the transduction of amino acids have also been reported for salamanders (Delay and Dionne, 2002) and Xenopus (Manzini et al., 2002).
Studies on other species of fish also support the hypothesis that amino acids stimulate some ciliated ORNs as well as some microvillous ORNs. In salmonids, biochemical studies (Lo et al., 1993; Lo, 1994) show that amino acids activate an IP3 pathway. The activation of the IP3 pathway by amino acids is likewise supported by a study on zebrafish reporting the elimination or attenuation of amino acid-evoked responses after application of an IP3-gated channel blocker or a PLC inhibitor (Ma and Michel, 1998). Finally, Sato and Suzuki (2001) used single-cell patch methods to determine that both ciliated and microvillous ORNs can detect amino acids. Our results suggest that a similar situation obtains in catfish.
G-proteins and cell type
The different types of ORNs in the VNO and main OE of rodents use different transduction mechanisms and attendant G-proteins (Schandar et al., 1998; Wekesa and Anholt, 1999). Reports on fish including catfish also indicate the expression of different G-protein subunits (Abogadie et al., 1995; DellaCorte et al., 1996) using different transduction mechanisms (Miyamoto et al., 1992; Restrepo et al., 1993). Likewise in catfish, we find that the different types of ORNs use various G-proteins: Gαolf/s in ciliated ORNs, Gαq/11 in many microvillous ORNs, and Gαo in crypt ORNs. A previous study of G-proteins in catfish (DellaCorte et al., 1996) suggests that ciliated ORNs use Gαq. We cannot account for this report, which is at odds with our findings in the same species. Both our light and electron microscopic analyses show that Gαq/11 immunoreactivity occurs in cells situated in the top half of the epithelium, which possess microvilli. Perhaps the antiserum used by DellaCorte et al. (1996) cross-reacted with proteins other than Gαq/11. Our attempts to replicate their findings using an antiserum generated against the same peptide sequence yielded no specific staining in the OE. The ciliated ORNs in our preparations react only with the specific Gαolf/s antiserum and not with those directed against either Gαq/11 or Gαo.
In summary, the present study demonstrates that morphologically distinct classes of ORNs use different transduction cascades and maintain distinct patterns of projection to the OB. Ciliated ORNs using Gαolf/s project primarily to regions of the OB responding to amino acids or bile salts. In contrast, microvillous ORNs using Gαq/11 project predominantly to the anterior dorsal OB, an area also responsive to amino acid odorants. Responses to nucleotide odorants are mediated by microvillous ORNs but appear to involve a transduction cascade other than Gαolf/cAMP or Gαq/11 and PLC. Crypt ORNs, which react with Gαo antibodies, exclusively project to two well defined ventral areas of unknown function. Thus, the segregation of projections of different types of receptor cells to different parts of the olfactory bulb occurs in fish as well as in mammals that possess a VNO. This segregation in such widely disparate groups indicates that it is likely to be a primitive feature of the extended olfactory system in vertebrates.
Footnotes
This study was supported by National Institute on Deafness and Other Communication Disorders Grants RO1 DC 03792 (J.C.) and P30 DC04657 (to Diego Restrepo, University of Colorado, Denver, CO). We thank Pam Eller and Dot Dill (University of Colorado) for technical assistance with electron microscopic experiments.
Correspondence should be addressed to Thomas Finger, Department of Cellular and Structural Biology, University of Colorado Health Sciences Center, Denver, CO 80262. E-mail: tom.finger@uchsc.edu.
Copyright © 2003 Society for Neuroscience 0270-6474/03/239328-12$15.00/0
References
- Abogadie FC, Bruch RC, Farbman AI ( 1995) G-protein subunits expressed in catfish olfactory receptor neurons. Chem Senses 20: 199-206. [DOI] [PubMed] [Google Scholar]
- Anderson KT, Finger TE ( 2000) Immunohistochemical localization of Go in a subset of goldfish and catfish olfactory receptor neurons and bulbar glomeruli. Chem Senses 25: 669. [Google Scholar]
- Anderson KT, Hansen A, Morita Y, Finger TE ( 2001) Distribution of Go and Golf immunoreactivity in the olfactory bulbs of catfish. Chem Senses 26: 1118. [Google Scholar]
- Buck L, Axel R ( 1991) A novel multigene family may encode odorant receptors: a molecular basis for odor recognition. Cell 65: 175-187. [DOI] [PubMed] [Google Scholar]
- Caprio J ( 1995) In vivo olfactory and taste recordings in fish. In: Experimental cell biology of taste and olfaction (Spielman AI, ed), pp 251-261. Boca Raton, FL: CRC.
- Carr WES ( 1988) The molecular nature of chemical stimuli in the aquatic environment. In: Sensory biology of aquatic animals (Atema J, Fay RR, Popper AN, Tavolga WN, eds), pp 3-27. New York: Springer.
- Delay RJ, Dionne VE ( 2002) Two second messengers mediate amino acid responses in olfactory sensory neurons of the salamander, Necturus maculosus. Chem Senses 27: 673-680. [DOI] [PubMed] [Google Scholar]
- DellaCorte C, Restrepo D, Menco BPhM, Andreini I, Kalinoski DL ( 1996) Gαq/Gα11: immunolocalization in the olfactory epithelium of the rat (Rattus rattus) and the channel catfish (Ictalurus punctatus). Neuroscience 74: 261-273. [DOI] [PubMed] [Google Scholar]
- Døving KB, Selset R ( 1980) Behavior patterns in cod released by electrical stimulation of olfactory tract bundlets. Science 207: 559-560. [DOI] [PubMed] [Google Scholar]
- Farbman AI ( 2000) Cell biology of olfactory epithelium. In: The neurobiology of taste and smell (Finger TE, Silver WL, Restrepo D, eds), pp 131-158. New York: Wiley.
- Friedrich RW, Korsching SI ( 1997) Combinatorial and chemotopic odorant coding in the zebrafish olfactory bulb visualized by optical imaging. Neuron 18: 737-752. [DOI] [PubMed] [Google Scholar]
- Gesteland RC, Howland B, Lettvin JY, Pitts WH ( 1959) Comments on microelectrodes. Proc Inst Radio Eng 47: 1856-1862. [Google Scholar]
- Hamdani EH, Kasumyan A, Døving KB ( 2001a) Is feeding behaviour in crucian carp mediated by lateral olfactory tract? Chem Senses 26: 1133-1138. [DOI] [PubMed] [Google Scholar]
- Hamdani EH, Alexander G, Døving KB ( 2001b) Projection of sensory neurons with microvilli to the lateral olfactory tract indicates their participation in feeding behaviour in crucian carp. Chem Senses 26: 1139-1144. [DOI] [PubMed] [Google Scholar]
- Hansen A, Finger TE ( 2000) Phyletic distribution of crypt-type olfactory receptor neurons in fishes. Brain Behav Evol 55: 100-110. [DOI] [PubMed] [Google Scholar]
- Hansen A, Zeiske E ( 1998) The peripheral olfactory organ of the zebrafish, Danio rerio: an ultrastructural study. Chem Senses 23: 39-48. [DOI] [PubMed] [Google Scholar]
- Hansen A, Anderson KT, Finger TE ( 2001) Immunohistochemical and ultrastructural identification of G-proteins in the olfactory epithelium of catfish. Chem Senses 26: 1128. [Google Scholar]
- Hara TJ, Zhang C ( 1996) Spatial projections to the olfactory bulb of functionally distinct and randomly distributed primary neurons in salmonid fishes. Neurosci Lett 26: 65-74. [DOI] [PubMed] [Google Scholar]
- Hara TJ, Zhang C ( 1998) Topographic bulbar projections and dual neural pathways of the primary olfactory neurons in salmonid fishes. Neuroscience 82: 301-313. [DOI] [PubMed] [Google Scholar]
- Jia C, Halpern M ( 1996) Subclasses of vomeronasal receptor neurons: differential expression of G-proteins (Giα2 and Goα) and segregated projections to the accessory olfactory bulb. Brain Res 719: 117-128. [DOI] [PubMed] [Google Scholar]
- Jones DT, Reed RR ( 1989) Golf: an olfactory neuron-specific G protein involved in odorant signal transduction. Science 244: 790-795. [DOI] [PubMed] [Google Scholar]
- Kauer JS ( 1991) Contributions of topography and parallel processing to odor coding in the vertebrate olfactory pathway. Trends Neurosci 14: 79-85. [DOI] [PubMed] [Google Scholar]
- Le Gros Clark WE ( 1956) Observations on the structure and organization of olfactory receptors in the rabbit. Yale J Biol Med 29: 83-95. [PMC free article] [PubMed] [Google Scholar]
- Lo YH ( 1994) Signal transduction for taurocholic acid in the olfactory system of Atlantic salmon. Chem Senses 19: 371-380. [DOI] [PubMed] [Google Scholar]
- Lo YH, Bradley TM, Rhoads DE ( 1993) Stimulation of Ca2+ regulated olfactory phospholipase C by amino acids. Biochemistry 32: 12358-12363. [DOI] [PubMed] [Google Scholar]
- Ma L, Michel WC ( 1998) Drugs affecting phospholipase C-mediated signal transduction block the olfactory cyclic nucleotide-gated current of adult zebrafish. J Neurophysiol 79: 1183-1192. [DOI] [PubMed] [Google Scholar]
- Manzini I, Rössler W, Schild D ( 2002) cAMP-independent responses of olfactory neurons in Xenopus laevis tadpoles and their projection onto olfactory bulb neurons. J Physiol (Lond) 545: 475-484. [DOI] [PMC free article] [PubMed] [Google Scholar]
- Meisami E, Bhatnagar KP ( 1998) Structure and diversity in mammalian accessory olfactory bulb. Microsc Res Tech 43: 476-499. [DOI] [PubMed] [Google Scholar]
- Miyamoto T, Restrepo D, Cragoe J, Teeter JH ( 1992) IP3- and cAMP-induced responses in isolated olfactory receptor neurons from the channel catfish. J Membr Biol 127: 173-183. [DOI] [PubMed] [Google Scholar]
- Moran DT, Rowley III C, Jafek BW ( 1982) Electron microscopy of human olfactory epithelium reveals a new cell type: the microvillar cell. Brain Res 253: 39-46. [DOI] [PubMed] [Google Scholar]
- Moran DT, Rowley III C, Aiken GR, Jafek BW ( 1992) Ultrastructural neurobiology of the olfactory mucosa of the brown trout, Salmo trutta. Microsc Res Tech 23: 28-48. [DOI] [PubMed] [Google Scholar]
- Mori K, Nagao H, Yoshihara Y ( 1999) The olfactory bulb: coding and processing of odor molecule information. Science 286: 711-715. [DOI] [PubMed] [Google Scholar]
- Mori K, von Campenhausen H, Yoshihara Y ( 2000) Zonal organization of the mammalian main and accessory olfactory systems. Philos Trans R Soc Lond B Biol Sci 355: 1801-1812. [DOI] [PMC free article] [PubMed] [Google Scholar]
- Morita Y, Finger TE ( 1998) Differential projections of ciliated and microvillous olfactory receptor cells in the catfish, Ictalurus punctatus. J Comp Neurol 398: 539-550. [DOI] [PubMed] [Google Scholar]
- Morita Y, Eller PM, Böttger B, Finger TE ( 1996) Cell-type specific representation of olfactory sensory neurons onto the olfactory bulb of catfish. Chem Senses 21: 646. [Google Scholar]
- Nikonov AA, Caprio J ( 2001) Electrophysiological evidence for a chemotopy of biologically relevant odors in the olfactory bulb of the channel catfish. J Neurophysiol 86: 1869-1876. [DOI] [PubMed] [Google Scholar]
- Ottoson D ( 1971) The electro-olfactogram. In: Handbook of sensory physiology (Beidler LM, ed), pp 95-131. Berlin: Springer.
- Ressler KJ, Sullivan SL, Buck LB ( 1994) Information coding in the olfactory system: evidence for a stereotyped and highly organized epitope map in the olfactory bulb. Cell 79: 1245-1255. [DOI] [PubMed] [Google Scholar]
- Restrepo D, Boekhoff I, Breer H ( 1993) Rapid kinetic measurements of second messenger formation in olfactory cilia from channel catfish. Am J Physiol 264: C906-C911. [DOI] [PubMed] [Google Scholar]
- Rolen SH, Michel WC, Caprio J ( 2002) Update on polyamines as olfactory stimuli in goldfish. Chem Senses 27: A73. [Google Scholar]
- Rolen SH, Sorensen PW, Mattson D, Caprio J ( 2003a) Polyamines as olfactory stimuli in the goldfish Carassius auratus. J Exp Biol 206: 1683-1696. [DOI] [PubMed] [Google Scholar]
- Rolen SH, Hansen A, Anderson KT, Nikonov A, Finger TE, Caprio J ( 2003b) Structure-function correlations of transduction in olfactory neurons in catfish. Chem Senses 28: 48. [Google Scholar]
- Sandell JH, Masland RH ( 1988) Photoconversion of some fluorescent markers to a diaminobenzidine product. J Histochem Cytochem 36: 555-559. [DOI] [PubMed] [Google Scholar]
- Sato K, Suzuki N ( 2001) Whole-cell response characteristics of ciliated and microvillous olfactory receptor neurons to amino acids, pheromone candidates and urine in rainbow trout. Chem Senses 26: 1145-1156. [DOI] [PubMed] [Google Scholar]
- Schandar M, Laugwitz K-L, Boekhoff I, Kroner C, Gudermann T, Schultz G, Breer H ( 1998) Odorants selectively activate distinct G protein subtypes in olfactory cilia. J Biol Chem 273: 16669-16677. [DOI] [PubMed] [Google Scholar]
- Shinohara H, Kato K, Asano T ( 1992) Differential localization of G proteins, Gi and Go, in the olfactory epithelium and the main olfactory bulb of the rat. Acta Anat 144: 167-171. [DOI] [PubMed] [Google Scholar]
- Skeen LC ( 1977) Odor-induced patterns of deoxyglucose consumption in the olfactory bulb of the tree shrew, Tupaia glis. Brain Res 124: 147-153. [DOI] [PubMed] [Google Scholar]
- Sorensen PW, Caprio J ( 1998) Chemoreception. In: The physiology of fishes (Evans DH, ed), pp 375-405. Boca Raton, FL: CRC.
- Speca DJ, Lin DM, Sorensen PW, Isacoff EY, Ngai J, Dittman AH ( 1999) Functional identification of a goldfish odorant receptor. Neuron 23: 487-498. [DOI] [PubMed] [Google Scholar]
- Stewart WB, Kauer JS, Shepherd GM ( 1979) Functional organization of rat olfactory bulb analysed by the 2-deoxyglucose method. J Comp Neurol 185: 715-734. [DOI] [PubMed] [Google Scholar]
- Strotmann J, Conzelmann S, Beck A, Feinstein P, Breer H, Mombaerts P ( 2000) Local permutations in the glomerular array of the mouse olfactory bulb. J Neurosci 20: 6927-6938. [DOI] [PMC free article] [PubMed] [Google Scholar]
- Sveinsson T, Hara TJ ( 2000) Olfactory sensitivity and specificity of Artic char, Salvelinus alpinus, to a putative male pheromone, prostaglandin F2α. Physiol Behav 69: 301-307. [DOI] [PubMed] [Google Scholar]
- Thommesen G ( 1978) The spatial distribution of odor induced potentials in the olfactory bulb of char and trout (Salmonidae). Acta Physiol Scand 102: 205-217. [DOI] [PubMed] [Google Scholar]
- Thommesen G ( 1983a) Morphology, distribution, and specificity of olfactory receptor cells in salmonid fishes. Acta Physiol Scand 117: 241-250. [DOI] [PubMed] [Google Scholar]
- Thommesen G ( 1983b) The spatial concept in fish olfaction. PhD thesis, University of Oslo.
- Uchida N, Takahashi YK, Tanifuji M, Mori K ( 2000) Odor maps in the mammalian olfactory bulb: domain organization and odorant structural features. Nat Neurosci 3: 1035-1043. [DOI] [PubMed] [Google Scholar]
- Vassar R, Chao SK, Sitcheran R, Nunez JM, Vosshall LB, Axel R ( 1994) Topographic organization of sensory projections to the olfactory bulb. Cell 79: 981-991. [DOI] [PubMed] [Google Scholar]
- Wekesa KS, Anholt RRH ( 1999) Differential expression of G proteins in the mouse olfactory system. Brain Res 837: 117-126. [DOI] [PubMed] [Google Scholar]
- Wekesa KS, Miller S, Napier A ( 2003) Involvement of Gq/11 in signal transduction in the mammalian vomeronasal organ. J Exp Biol 206: 827-832. [DOI] [PubMed] [Google Scholar]
- Yoshihara Y, Kawasaki M, Tamada A, Fujita H, Hayashi H, Kagamiyama H, Mori K ( 1997) OCAM: a new member of the neural cell adhesion molecule family related to zone-to-zone projection of olfactory and vomeronasal axons. J Neurosci 17: 5830-5842. [DOI] [PMC free article] [PubMed] [Google Scholar]
- Yule DI, Williams JA ( 1992) U73122 inhibits Ca2+ oscillations in response to cholecystokinin and carbachol but not to JMV-180 in rat pancreatic acinar cells. J Biol Chem 267: 13830-13835. [PubMed] [Google Scholar]
- Zeiske E, Theisen B, Breucker H ( 1992) Structure, development, and evolutionary aspects of the peripheral olfactory system. In: Fish chemoreception (Hara TJ, ed), pp 13-39. London: Chapman and Hall.
- Zielinski B, Hara TJ ( 1988) Morphological and physiological development of olfactory receptor cells in rainbow trout (Salmo gairdneri) embryos. J Comp Neurol 271: 300-311. [DOI] [PubMed] [Google Scholar]
- Zippel HP, Sorensen PW, Hansen A ( 1996) High correlation between microvillous olfactory receptor cell abundance and sensitivity to pheromones in olfactory nerve-sectioned goldfish. J Comp Physiol [A] 180: 39-52. [Google Scholar]
- Zippel HP, Hansen A, Caprio J ( 1997) Renewing olfactory receptor neurons do not require contact with the olfactory bulb to develop normal responsiveness. J Comp Physiol [A] 181: 425-437. [Google Scholar]