

Abstract
The number of transmitter molecules released in a quantal event can be regulated, and recent studies suggest that the modulation of quantal size is associated with corresponding changes in vesicle volume (Colliver et al., 2000; Pothos et al., 2002). If so, this could occur either by distension of the vesicle membrane or by incorporation and removal of vesicle membrane. We performed simultaneous measurements of vesicle membrane area and catecholamine release in individual quantal events from chromaffin cells using cell-attached patch amperometry. Cells were treated with reserpine, a vesicular monoamine transport blocker that decreases quantal size, or l-dopa, a catecholamine precursor that increases quantal size. We show that decrease and increase in quantal size are associated with a respective decrease and increase in vesicle membrane area. These results point to a novel mechanism of vesicle membrane dynamics by which vesicles physically change their membrane area in response to changes in transmitter content such that the intravesicular concentration of transmitter is maintained.
Keywords: quantal size, exocytosis, membrane dynamics, transmitter release, transmitter transport, patch amperometry
Introduction
In most neurons, the postsynaptic response to released neurotransmitter from single vesicles shows significant variations in amplitude (Bekkers et al., 1990; Liu et al., 1999). Such variability may reflect presynaptic or postsynaptic mechanisms, or both (Auger and Marty, 2000). Evidence has been presented that quantal response is limited by availability of postsynaptic receptors (Tang et al., 1994; Auger and Marty, 1997); however, other studies suggest that quantal variability is caused by variations in the amount of transmitter released per synaptic vesicle fusion event (Frerking et al., 1995; Liu et al., 1999). Various studies indicated that variability in quantal size reflects the vesicle size distribution, whereas the transmitter concentration inside the vesicles is constant (Van der Kloot and Molgo, 1994; Finnegan et al., 1996; Albillos et al., 1997; Bruns et al., 2000).
Manipulations affecting the loading of vesicles with transmitter modulate quantal size (Sulzer and Pothos, 2000). In the neuromuscular junction and midbrain dopamine neurons, a marked increase in the amplitude of miniature excitatory postsynaptic currents is induced by overexpression of vesicular neurotransmitter transporters, suggesting that quantal size can be regulated by changes in vesicular transporter activity (Song et al., 1997; Pothos et al., 2000). In dopaminergic neurons and PC12 cells, the catecholamine precursor l-dopa increases quantal size by enhancing formation of cytosolic dopamine (Pothos et al., 1996, 1998), whereas the vesicular monoamine transport inhibitor reserpine decreases quantal size (Kozminski et al., 1998; Pothos et al., 1998).
If the concentration within vesicles remains constant, this poses an obvious problem for mechanisms that change quantal size by altering the number of transmitter molecules within secretory vesicles. The volume of secretory vesicles must change. Using amperometry and transmission electron microscopy, it was suggested that the alterations of quantal size by l-dopa and reserpine treatment were associated with swelling and shrinking of vesicles, respectively (Colliver et al., 2000). In chromaffin cells, manipulations that enhance vesicular pH gradients lead to an increase in both quantal size and vesicle volume, whereas conditions that collapse vesicle pH gradients decrease quantal size and vesicle volume (Pothos et al., 2002).
Swelling and shrinking of vesicles could occur by stretching and undulating the membrane of the vesicle or through incorporation and loss of membrane. Because the area of a cell membrane can be stretched by only ∼3% (Evans et al., 1976), the former mechanism does not involve significant changes in membrane area, whereas the latter mechanism does. Membrane capacitance measurements provide a direct assay of changes in membrane area (Neher and Marty, 1982). Cell-attached patch amperometry combines patch-clamp measurements of capacitance steps, indicating vesicle membrane area (Neher and Marty, 1982), with amperometric detection of released catecholamines by a carbon fiber electrode (Wightman et al., 1991; Chow et al., 1992) located inside the patch pipette (Albillos et al., 1997). We used this method for simultaneous measurements of vesicle membrane area and the amount of catecholamine secreted from the same vesicle. We found that vesicle membrane area changes markedly in parallel with changes in quantal size.
Materials and Methods
Cells and recording configurations. Bovine chromaffin cells were prepared and cultured as described (Parsons et al., 1995). Cell-attached patch amperometry recordings were performed using the method described previously (Albillos et al., 1997) on days 1-4 in culture. The patch pipette contained a carbon fiber electrode and an Ag/AgCl reference electrode for amperometric detection of catecholamines released into the pipette because of exocytosis in the cell-attached patch. The sine wave for patch capacitance measurements was applied to the bath. Changes of patch admittance were measured with a lock-in amplifier (SR 830, Stanford Research Systems) using a 20 kHz, 50 mV (root mean square) sine wave.
Whole-cell capacitance measurements were performed using cells with 15-17 μm diameter by adjustment of the C-slow capacitance compensation circuitry of a HEKA EPC-8 amplifier using a 5 mV square pulse.
Reagents and solutions. The bath solution contained (in mm): 140 NaCl, 5 KCl, 5 CaCl2, 1 MgCl2, 10 HEPES/NaOH, 10 glucose, pH 7.3. For cell-attached patch amperometry the pipette solution contained (in mm): 50 NaCl, 100 TEA-Cl, 5 KCl, 10 CaCl2, 1 MgCl2, 10 HEPES/NaOH, pH 7.3. For whole-cell capacitance measurements the pipette contained solution contained (in mm): 140 K-glutamate, 8 NaCl, 1 MgCl2, 0.1 EGTA, 1 Mg-ATP, 0.3 Na2GTP, 15 HEPES/KOH, pH 7.30. Chromaffin cells were treated with 100 μml-dopa, 1 μm reserpine, or (for controls) with the same amount of physiological saline or dimethylsulfoxide (DMSO) in bath solution for 60 min at room temperature. l-Dopa or reserpine was added from a 10 mm stock solution in physiological saline or 1 mm in DMSO, respectively. After treatment, the cells were transferred to bath solution without drug and allowed 20 min to recover before recording. All recordings were completed within 1-2 hr after the incubation period.
Data analysis. The number of catecholamine molecules in a vesicle (quantal size) was determined by integrating the amperometric current of a single event after baseline subtraction and dividing the resulting charge by 2e0 (e0 = elementary charge), assuming that two electrons are transferred per molecule (Baur et al., 1988). The volume of the individual vesicles was calculated using a specific capacitance of 9 fF/μm2 (Albillos et al., 1997) and assuming spherical geometry. To determine the average vesicular concentrations, quantal size was plotted as a function of vesicle volume for each vesicle, and a straight line through the origin was fitted to the data points. The slope of the fit provides the average concentration and the correlation coefficient provides an indication of the variability. Such fits were performed for pooled data as well as for single cells as described in Results.
Results
To simultaneously measure quantal size and vesicle membrane area we performed cell-attached patch amperometry capacitance measurements. Capacitance steps associated with amperometric spikes (Fig. 1) indicate exocytosis of individual chromaffin granules. The membrane area of individual exocytosed granules is proportional to the size of capacitance steps. The number of catecholamine molecules in a vesicle is obtained by integrating the amperometric current of the same vesicle after baseline subtraction (Fig. 1) and dividing the resulting charge by 2e0, assuming that two electrons are transferred per molecule (Baur et al., 1988).
Figure 1.
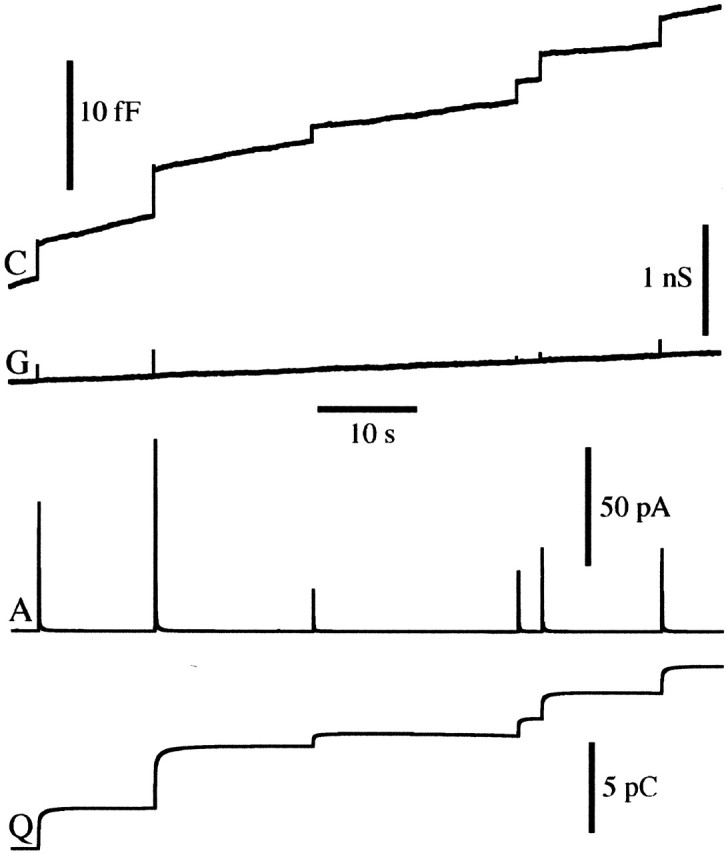
Patch amperometry recording showing detection of exocytosis of single vesicle from bovine chromaffin cell. Simultaneous recording of membrane capacitance (C), conductance (G), and amperometric current (A) together with the running integral of the amperometric current (Q).
l-Dopa and reserpine change quantal size
In control cells, the average amperometric charge was 1.81 ± 0.14 pC, corresponding to 5.7 ± 0.4 × 10⁶ molecules per vesicle. As expected, incubation of the cells for 1 hr in the presence of 100 μml-dopa increased the average quantal size by 70% to 3.05 ± 0.26 pC or 9.4 ± 0.8 × 10⁶ molecules per vesicle. In contrast, a 1 hr treatment with 1 μm reserpine decreased quantal size by 30% to 1.22 ± 0.1 pC or 3.8 ± 0.3 × 10⁶ molecules per vesicle (Fig. 2A). These mean values were obtained from catecholamine-containing vesicles only. In addition, some catecholamine-free vesicles are released, indicated by capacitance steps that were not associated with an amperometric spike. The fraction of catecholamine-free vesicles was 8% in control cells (12 of 153), 6% in l-dopa-treated cells (8 of 129), and increased to 19% in reserpine-treated cells (22 of 115), confirming previous observations in rat chromaffin cells (Tabares et al., 2001).
Figure 2.
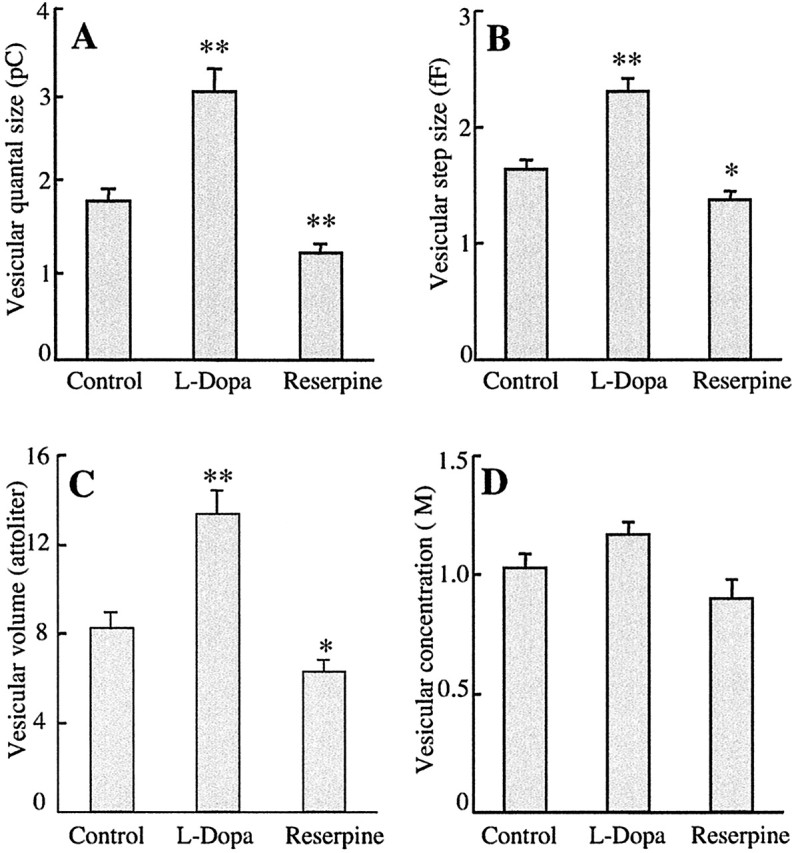
Effects of l-dopa and reserpine on average quantal size (A), capacitance step size (B), and vesicular volume (C). Values are expressed as mean ± SEM. The number of quantal events was 141 (from 30 cells) for control, 121 (from 27 cells) for l-dopa, and 93 (from 23 cells) for reserpine. Significantly different from control indicated as *p < 0.05 and **p < 0.001 (t test). The vesicular catecholamine concentrations (D) are the slopes of the straight lines in Figure 3 A, C,E.
l-Dopa and reserpine change vesicle membrane area
The average capacitance step size of catecholamine-containing vesicles in control cells was 1.64 ± 0.08 fF. Interestingly, the average step size was 41% higher in l-dopa-treated cells (2.31 ± 0.11 fF) and 16% lower in reserpine-treated cells (1.37 ± 0.08 fF) (Fig. 2B). A comparison between capacitance step size distributions and morphometric analysis revealed a specific capacitance of 9 fF/μm2 for granules of cultured bovine chromaffin cells (Albillos et al., 1997). The average membrane area of exocytosed granules is thus 0.182 ± 0.009 μm2 in control cells, 0.257 ± 0.012 μm2 in l-dopa-treated cells, and 0.152 ± 0.009 μm2 in reserpine-treated cells. Thus, the changes in vesicle volumes associated with changes in quantal size are caused by incorporation and removal of vesicle membrane. The average step size of catecholamine-free vesicles was smaller (0.60 ± 0.09 fF; n = 42), corresponding to an average vesicle membrane area of 0.067 ± 0.01 μm2 for empty vesicles.
Vesicular catecholamine concentrations remain constant
The average vesicle volume in control cells was 8.2 ± 0.73 al. l-Dopa increased the average volume by 62% to 13.3 ± 1.1 al, and reserpine decreased the average volume by 24% to 6.2 ± 0.6 al (Fig. 2C). Both l-dopa and reserpine had no significant effects on vesicular catecholamine concentrations (Fig. 2D), although they both significantly changed quantal size and the vesicle membrane area.
Variability of vesicular concentrations is modulated by l-dopa and reserpine
Figure 3A,C,E shows proportional relationships between quantal size and vesicle volume for all exocytotic events in each group as expected for constant vesicle concentration. In control cells (Fig. 3A) the average vesicular concentration (slope) was 1.03 ± 0.06 m, with a correlation coefficient of 0.78. The variability in vesicular concentration is much smaller in individual cells (Albillos et al., 1997). The fit for the single cell shown in Figure 3B gave a correlation coefficient of 0.92. Correlation coefficients were determined for each cell with three or more events. The median of correlation coefficients in individual cells was 0.92 for control cells (n = 16 cells). Thus, most of the scatter in Figure 3A comes from cell-to-cell variability. l-Dopa-treated cells (Fig. 3C) gave a correlation coefficient of 0.90 in the ensemble and a median correlation coefficient of 0.96 (n = 13 cells) in individual cells (Fig. 3D). In contrast, reserpine treatment (Fig. 3E) gave a much lower correlation coefficient (0.61) in the ensemble. The increased scatter in vesicular concentrations is also seen on the single cell level (Fig. 3F), with a median correlation coefficient of 0.63 (n = 8 cells). These results indicate a systematic change in variability of vesicular concentrations on the single cell level.
Figure 3.

Proportional relation between quantal size and vesicle volume for control cells (A, B), l-dopa-treated cells (C, D), and reserpine-treated cells (E, F). A, C, and E show data points from all cells in a group; B, D, and F show data points from individual cells only. Straight lines through the origin were fitted to the data points. The slopes and correlation coefficients are indicated on the panels.
Discussion
Using cell-attached patch amperometry we have shown that the increase in quantal size observed in cells treated with l-dopa and the decrease in quantal size in cells treated with reserpine are accompanied by a corresponding increase and decrease in capacitance step sizes under the different conditions. The capacitance step size distribution in cultured bovine chromaffin cells is in excellent agreement with morphometric analysis of vesicle profiles in thin sections when a specific capacitance of 9 fF/μm2 is used to convert capacitance step size into vesicle membrane area (Albillos et al., 1997). We thus interpret the increased capacitance step sizes in l-dopa-treated cells and the decreased capacitance step sizes in reserpine-treated cells as changes in vesicle membrane area.
Could there be an alternative explanation for the change in capacitance step sizes in l-dopa and reserpine-treated cells? In principle, two other phenomena could underlie this observation. One possibility would be that in l-dopa-treated cells preferentially large vesicles are released and that in reserpine-treated cells preferentially small vesicles are released. This would mean that with these treatments neither vesicle membrane area nor vesicle contents change but that these treatments instead would selectively make small or large vesicles available for exocytosis. We consider this possibility mechanistically very unlikely, and furthermore reserpine-treated cells release increasing amounts of catecholamine-free vesicles (Tabares et al., 2001), indicating that vesicular contents do change. In addition to membrane area, vesicle capacitance depends on the value of the specific capacitance (CS). Another possibility would thus be that l-dopa and reserpine change CS. For example, hydrophobic ions that incorporate into membranes can affect CS of mast cell granules (Oberhauser and Fernandez, 1995); however, such treatments affect not only the capacitance of the granules but also the capacitance of the plasma membrane (Oberhauser and Fernandez, 1995). We thus measured in the whole-cell configuration the plasma membrane capacitance of chromaffin cells treated with l-dopa and of control cells of similar size. The mean plasma membrane capacitance of l-dopa-treated cells was 6.6 ± 0.15 pF (SEM; n = 9 cells) and was not significantly different from that of control cells (6.8 ± 0.33 pF; SEM; n = 8 cells). Thus, l-dopa treatment does not change CS, and the observed increase in capacitance step sizes in l-dopa-treated cells reflects an increase in vesicle membrane area.
The 41% increase in vesicle membrane area and associated volume increase should be observable by electron microscopy. Indeed, such evidence has been reported previously (Colliver et al., 2000). Both the ultrastructural studies combined with amperometric recordings and our patch amperometry recordings lead to the same conclusion that the change in quantal size is associated with a change in vesicle volume. Our results provide a mechanistic explanation for the vesicle volume changes and show that the physical vesicle membrane area is dynamic. Changes in catecholamine content may lead to changes in osmotic pressure. The maximal fractional area increase of biological membranes before lysis occurs is ∼2-4% (Evans et al., 1976) and cannot explain the observed 41% increase of vesicle membrane area that occurs during incubation with l-dopa. The increase or decrease in quantal size must thus be associated with a physical addition or removal of parts of the vesicle membrane, respectively. Unusually large vesicles were also observed in rat basophilic leukemia cells after prolonged incubation with serotonin (Williams et al., 1999).
Changes in quantal size are not explained by compound exocytosis
One way to increase vesicle size would be via compound exocytosis, in which vesicles would fuse inside the cell forming multivesicular compounds leading to increased capacitance steps (Scepek and Lindau, 1993) and increased quantal size. If compound exocytosis were the cause of increased vesicle membrane area and quantal size, we would expect a proportional increase of quantal size and membrane area. In contrast, a 43% increase of average vesicle membrane area is associated with a 70% increase of average quantal size in l-dopa-treated cells. For instance, the two largest events in Figure 3D represent vesicles with a membrane area of ∼0.46 μm2. If these were each formed by fusion of two vesicles with area 0.23 μm2, then each of these smaller vesicles would have a volume of 10 al and a quantal size of 12 amol. The compound would have a quantal size of 24 amol and would deviate markedly from the straight line. In contrast, the data points for the large vesicles are on the same straight lines as the small ones (Fig. 3), with a quantal size of ∼33 amol. The observed proportional relation between vesicle volume and quantal size is thus not consistent with compound exocytosis as an explanation for events with large quantal size.
Vesicular membrane dynamics regulated by vesicle loading
The fact that reserpine decreases quantal size as well a vesicular membrane area suggests that the modulation of vesicle size may occur by a different mechanism. It appears that vesicle membrane can physically be added or removed. The average step size of catecholamine-free vesicles was 0.6 fF, significantly smaller than that of catecholamine-containing vesicles. A step size of 0.6 fF converts to a vesicle diameter of ∼150 nm, which is very close to the size of catecholamine-free vesicles in rat chromaffin cells (Tabares et al., 2001). It thus appears that there is a lower size limit to which chromaffin vesicles can be reduced. Over a wide range of concentrations, however, the vesicles can regulate their size such that their catecholamine concentration remains fairly constant after changes in vesicular catecholamine content. In l-dopa-treated cells, transport into the vesicles and quantal size are increased but there is no significant increase in vesicular concentration. Interestingly, the variability of vesicular concentration is decreased under these conditions, suggesting that the addition of vesicle membrane area is tightly coupled to the increase in quantal size. When the uptake is inhibited by reserpine, quantal size decreases as does vesicle membrane area, but the vesicular concentrations become more variable. The mechanism decreasing vesicular membrane area may thus be less tightly coupled to the decrease in quantal size.
We conclude that although vesicular catecholamine concentrations may vary from one cell to another (Albillos et al., 1997; Alés et al., 1999), chromaffin granules have a mechanism to add or remove parts of their membrane area when catecholamine contents are increased or decreased. This allows marked changes in average quantal size whereas the average vesicular concentration is kept at a constant level. Our results clearly indicate that membrane is selectively added to or subtracted from vesicles, in contrast to volume changes caused by altered membrane tension or undulation. The mechanism of vesicular membrane dynamics is presently unknown. The increase and decrease in vesicle membrane area could be produced by a change in osmotic pressure resulting from changes in vesicular content. A rapid exoendocytosis cycle driven by pressure changes has been reported in plant cell protoplasts (Zorec and Tester, 1993; Homann and Thiel, 2002) and may be a general mechanism of plasma membrane area regulation in various cell types including neurons (Morris and Homann, 2001), where increased osmotic pressure and membrane tension promote net exocytosis; decreased osmotic pressure and membrane tension promote net endocytosis (Dai et al., 1998). Alternatively, specific interactions of cargo molecules with low-affinity receptors in the vesicle membrane may regulate vesicle membrane dynamics. Previous electron microscopy studies of adrenal cell vesicles showed small microvesicles present between the dense core and the vesicle membrane (Ornberg et al., 1986). These intragranule microvesicles could contribute the material required to expand chromaffin granule membranes when granules are loaded with increased amounts of catecholamine; however, such intragranule vesicles were not reported in other studies (Plattner et al., 1997; Koval et al., 2001).
Another possibility is that cytosolic phospholipid transport proteins contribute to the changes in vesicle membrane area. An example is phosphatidylinositol transfer protein, which plays a role in secretory vesicle formation (Ohashi et al., 1995). Osmotically induced granule swelling and shrinking have been studied by direct observation for the large secretory granules from beige mouse mast cells (Brodwick et al., 1992). It was found that in disrupted cells, hypotonic swelling of secretory granules was limited to 8% before the vesicle lysed. In contrast, secretory vesicles in intact cells could swell by ∼50% (Brodwick et al., 1992). This suggests that the source of the added vesicle membrane may be cytosolic.
In addition to phospholipid transport proteins, vesicle membrane could be added by direct fusion or budding of small vesicles with chromaffin granules. In l-dopa-loaded cells, the average capacitance step size increases by 0.67 fF. Ultrastructural studies have shown that chromaffin cells contain multiple types of vesicles (Koval et al., 2001). Small synaptic-like microvesicles (SLMVs) have a mean diameter of 64 nm (Koval et al., 2001) corresponding to ∼0.12 fF per SLMV. Approximately five or six such vesicles must fuse with a chromaffin granule to produce the observed increase in membrane area; however, the number of such vesicles in unstimulated cells is small (Koval et al., 2001). Chromaffin cells also contain small dense-core vesicles (SDCGs) with a mean diameter of 72 nm corresponding to ∼0.15 fF per vesicle that are more numerous (Koval et al., 2001). These vesicles were seen to bud from the Golgi and also from large dense-core granules. SDCGs may thus represent the organelles mediating chromaffin granule membrane dynamics regulated by transmitter loading.
Footnotes
This work was supported by National Institutes of Health Grant R01-NS38200, the Nanobiotechnology Center (a National Science Foundation Science and Technology Center, agreement No. ECS-9876771), and the Spanish Ministry of Science and Technology. We thank Lori Kwan and Joan Lenz for the cell preparation and excellent technical assistance, and Dr. David Sulzer for his invaluable advice and comments on this manuscript.
Correspondence should be addressed to Dr. Manfred Lindau, School of Applied and Engineering Physics, Cornell University, Ithaca, NY 14850. E-mail: ml95@cornell.edu.
Copyright © 2003 Society for Neuroscience 0270-6474/03/237917-05$15.00/0
References
- Albillos A, Dernick G, Horstmann H, Almers W, Alvarez de Toledo G, Lindau M ( 1997) The exocytotic event in chromaffin cells revealed by patch amperometry. Nature 389: 509-512. [DOI] [PubMed] [Google Scholar]
- Alés E, Tabares L, Poyato JM, Valero V, Lindau M, Alvarez de Toledo G ( 1999) High calcium concentrations shift the mode of exocytosis to the kiss-and-run mechanism. Nat Cell Biol 1: 40-44. [DOI] [PubMed] [Google Scholar]
- Auger C, Marty A ( 1997) Heterogeneity of functional synaptic parameters among single release sites. Neuron 19: 139-150. [DOI] [PubMed] [Google Scholar]
- Auger C, Marty A ( 2000) Quantal currents at single-site central synapses. J Physiol (Lond) 526: 3-11. [DOI] [PMC free article] [PubMed] [Google Scholar]
- Baur JE, Kristensen EW, May LJ, Wiedemann DJ, Wightman RJ ( 1988) Fast-scan voltammetry of biogenic amines. Anal Chem 60: 1268-1272. [DOI] [PubMed] [Google Scholar]
- Bekkers JM, Richerson GB, Stevens CF ( 1990) Origin of variability in quantal size in cultured hippocampal neurons and hippocampal slices. Proc Natl Acad Sci USA 87: 5359-5362. [DOI] [PMC free article] [PubMed] [Google Scholar]
- Brodwick MS, Curran M, Edwards C ( 1992) Effects of osmotic stress on mast cell vesicles of the beige mouse. J Membr Biol 126: 159-169. [DOI] [PubMed] [Google Scholar]
- Bruns D, Riedel D, Klingauf J, Jahn R ( 2000) Quantal release of serotonin. Neuron 28: 205-220. [DOI] [PubMed] [Google Scholar]
- Chow RH, Rüden LV, Neher E ( 1992) Delay in vesicle fusion revealed by electrochemical monitoring of single secretory events in adrenal chromaffin cells. Nature 356: 60-63. [DOI] [PubMed] [Google Scholar]
- Colliver TL, Pyott SJ, Achalabun M, Ewing AG ( 2000) VMAT-Mediated changes in quantal size and vesicular volume. J Neurosci 20: 5276-5282. [DOI] [PMC free article] [PubMed] [Google Scholar]
- Dai J, Sheetz MP, Wan X, Morris CE ( 1998) Membrane tension in swelling and shrinking molluscan neurons. J Neurosci 18: 6681-6692. [DOI] [PMC free article] [PubMed] [Google Scholar]
- Evans EA, Waugh R, Melnik L ( 1976) Elastic area compressibility modulus of red cell membrane. Biophys J 16: 585-595. [DOI] [PMC free article] [PubMed] [Google Scholar]
- Finnegan JM, Pihel K, Cahil PS, Huang L, Zerby SE, Ewing AG, Kennedy RT, Wightman RM ( 1996) Vesicular quantal size measured by amperometry at chromaffin, mast, pheochromocytoma, and pancreatic β-cells. J Neurochem 66: 1914-1923. [DOI] [PubMed] [Google Scholar]
- Frerking M, Borges S, Wilson M ( 1995) Variation in GABA mini amplitude is the consequence of variation in transmitter concentration. Neuron 15: 885-895. [DOI] [PubMed] [Google Scholar]
- Homann U, Thiel G ( 2002) The number of K(+) channels in the plasma membrane of guard cell protoplasts changes in parallel with the surface area. Proc Natl Acad Sci USA 99: 10215-10220. [DOI] [PMC free article] [PubMed] [Google Scholar]
- Koval LM, Yavorskaya EN, Lukyanetz EA ( 2001) Electron microscopic evidence for multiple types of secretory vesicles in bovine chromaffin cells. Gen Comp Endocrinol 121: 261-277. [DOI] [PubMed] [Google Scholar]
- Kozminski KD, Gutman DA, Davila V, Sulzer D, Ewing AG ( 1998) Voltammetric and pharmacological characterization of dopamine release from single exocytotic events at rat pheochromocytoma (PC12) cells. Anal Chem 70: 3123-3130. [DOI] [PubMed] [Google Scholar]
- Liu G, Choi S, Tsien RW ( 1999) Variability of neurotransmitter concentration and nonsaturation of postsynaptic AMPA receptors at synapses in hippocampal cultures and slices. Neuron 22: 395-409. [DOI] [PubMed] [Google Scholar]
- Morris CE, Homann U ( 2001) Cell surface area regulation and membrane tension. J Membr Biol 179: 79-102. [DOI] [PubMed] [Google Scholar]
- Neher E, Marty A ( 1982) Discrete changes of cell membrane capacitance observed under conditions of enhanced secretion in bovine adrenal chromaffin cells. Proc Natl Acad Sci USA 79: 6712-6716. [DOI] [PMC free article] [PubMed] [Google Scholar]
- Oberhauser AF, Fernandez JM ( 1995) Hydrophobic ions amplify the capacitive currents used to measure exocytotic fusion. Biophys J 69: 451-459. [DOI] [PMC free article] [PubMed] [Google Scholar]
- Ohashi M, Jan de Vries K, Frank R, Snoek G, Bankaitis V, Wirtz K, Huttner WB ( 1995) A role for phosphatidylinositol transfer protein in secretory vesicle formation. Nature 377: 544-547. [DOI] [PubMed] [Google Scholar]
- Ornberg RL, Duong LT, Pollard HB ( 1986) Intragranular vesicles: new organelles in the secretory granules of adrenal chromaffin cells. Cell Tissue Res 245: 547-553. [DOI] [PubMed] [Google Scholar]
- Parsons TD, Coorssen JR, Horstmann H, Almers W ( 1995) Docked granules, the exocytic burst, and the need for ATP hydrolysis in endocrine cells. Neuron 15: 1085-1096. [DOI] [PubMed] [Google Scholar]
- Plattner H, Artalejo AR, Neher E ( 1997) Ultrastructural organization of bovine chromaffin cell cortex-analysis by cryofixation and morphometry of aspects pertinent to exocytosis. J Cell Biol 139: 1709-1717. [DOI] [PMC free article] [PubMed] [Google Scholar]
- Pothos E, Desmond M, Sulzer D ( 1996) l-3,4-dihydroxyphenylalanine increases the quantal size of exocytotic dopamine release in vitro. J Neurochem 66: 629-636. [DOI] [PubMed] [Google Scholar]
- Pothos EN, Davila V, Sulzer D ( 1998) Presynaptic recording of quanta from midbrain dopamine neurons and modulation of the quantal size. J Neurosci 18: 4106-4118. [DOI] [PMC free article] [PubMed] [Google Scholar]
- Pothos EN, Larsen KE, Krantz DE, Liu Y, Haycock JW, Setlik W, Gershon MD, Edwards RH, Sulzer D ( 2000) Synaptic vesicle transporter expression regulates vesicle phenotype and quantal size. J Neurosci 20: 7297-7306. [DOI] [PMC free article] [PubMed] [Google Scholar]
- Pothos EN, Mosharov E, Liu KP, Setlik W, Haburcak M, Baldini G, Gershon MD, Tamir H, Sulzer D ( 2002) Stimulation-dependent regulation of the pH, volume and quantal size of bovine and rodent secretory vesicles. J Physiol (Lond) 542: 453-476. [DOI] [PMC free article] [PubMed] [Google Scholar]
- Scepek S, Lindau M ( 1993) Focal exocytosis by eosinophils: compound exocytosis and cumulative fusion. EMBO J 12: 1811-1817. [DOI] [PMC free article] [PubMed] [Google Scholar]
- Song H, Ming G, Fon E, Bellocchio E, Edwards RH, Poo M ( 1997) Expression of a putative vesicular acetylcholine transporter facilitates quantal transmitter packaging. Neuron 18: 815-826. [DOI] [PubMed] [Google Scholar]
- Sulzer D, Pothos EN ( 2000) Regulation of quantal size by presynaptic mechanisms. Rev Neurosci 11: 159-212. [DOI] [PubMed] [Google Scholar]
- Tabares L, Ales E, Lindau M, Alvarez De Toledo G ( 2001) Exocytosis of catecholamine-containing and catecholamine-free granules in chromaffin cells. J Biol Chem 276: 39974-39979. [DOI] [PubMed] [Google Scholar]
- Tang CM, Margulis M, Shi QY, Fielding A ( 1994) Saturation of postsynaptic glutamate receptors after quantal release of transmitter. Neuron 13: 1385-1393. [DOI] [PubMed] [Google Scholar]
- Van der Kloot W, Molgo J ( 1994) Quantal acetylcholine release at the vertebrate neuromuscular junction. Physiol Rev 74: 899-991. [DOI] [PubMed] [Google Scholar]
- Wightman RM, Jankowski JA, Kennedy RT, Kawagoe DT, Schroeder TJ, Leszczyszyn DJ, Near JA, Diliberto Jr EJ, Viveros OH ( 1991) Temporally resolved catecholamine spikes correspond to single vesicle release from individual chromaffin cells. Proc Natl Acad Sci USA 88: 10754-10758. [DOI] [PMC free article] [PubMed] [Google Scholar]
- Williams RM, Shear JB, Zipfel WR, Maiti S, Webb WW ( 1999) Mucosal mast cell secretion processes imaged using three-photon microscopy of 5-hydroxytryptamine autofluorescence. Biophys J 76: 1835-1846. [DOI] [PMC free article] [PubMed] [Google Scholar]
- Zorec R, Tester M ( 1993) Rapid pressure driven exocytosis-endocytosis cycle in a single plant cell. Capacitance measurements in aleurone protoplasts. FEBS Lett 333: 283-286. [DOI] [PubMed] [Google Scholar]