

Abstract
Dendritic spines have two major structural elements: postsynaptic densities (PSDs) and actin cytoskeletons. PSD proteins are proposed to regulate spine morphogenesis. However, other molecular mechanisms should govern spine morphogenesis, because the initiation of spine morphogenesis precedes the synaptic clustering of these proteins. Here, we show that synaptic clustering of drebrin, an actin-binding protein highly enriched in dendritic spines, governs spine morphogenesis. We immunocytochemically analyzed developing hippocampal neurons of low-density cultures. Filopodia-like dendritic protrusions were classified into two types: diffuse-type filopodia, which have diffuse distribution of drebrin, and cluster-type filopodia, which have drebrin clusters with filamentous actin (F-actin). Most cluster-type filopodia were synaptic filopodia. Postsynaptic drebrin clusters were found in both most synaptic filopodia and spines. Postsynaptic PSD-95 clusters, however, were found in only one-half of synaptic filopodia but in most spines. These data indicate that cluster-type filopodia are not mature spines but their precursors. Suppression of the upregulation of drebrin adult isoform (drebrin A) by antisense oligonucleotides against it attenuated synaptic clustering of PSD-95, as well as clustering of drebrin and F-actin. Furthermore, the restoration of drebrin A expression by injection of the expression vectors of drebrin A tagged with green fluorescent protein into the neurons treated with the antisense oligonucleotides induced synaptic reclustering of PSD-95 on clusters of the labeled drebrin A. These data indicated that the synaptic clustering of drebrin is necessary for that of PSD-95 in developing neurons. Together, these data suggest that synaptic clustering of drebrin is an essential step for spine morphogenesis.
Keywords: drebrin, dendritic spine, actin cytoskeleton, postsynaptic density, synaptogenesis, hippocampus, antisense oligonucleotide, microinjection
Introduction
Dendritic spines are the postsynaptic-reception regions of most excitatory synapses in adult brains, and spine morphogenesis is fundamental to the development of neuronal networks and the regulation of synaptic plasticity (Harris and Kater, 1994; Harris, 1999; Yuste and Bonhoeffer, 2001). However, the molecular mechanisms that regulate spine morphogenesis are still unclear.
Dendritic spines have two major structural elements: postsynaptic densities (PSDs) and actin cytoskeletons. Recent studies have suggested that PSD scaffold proteins, such as PSD-95, spine-associated RapGAP, Shank, and Homer, govern spine morphogenesis (El-Husseini et al., 2000; Marrs et al., 2001; Pak et al., 2001; Prange and Murphy, 2001; Sala et al., 2001). However, the initiation of spine morphogenesis precedes synaptic assembly of PSD-95 (Okabe et al., 2001). Furthermore, mutant mice that lack PSD-95 expression exhibit standard spine morphology (Migaud et al., 1998). These data suggest that molecular mechanisms other than PSD scaffold proteins govern spine morphogenesis. The actin cytoskeleton predominates in spines (Matus et al., 1982) and regulates their morphological plasticity (Fischer et al., 1998). Consequently, the actin cytoskeleton has been proposed to be a key player in spine morphogenesis (for review, see Matus, 2000). However, few studies directly demonstrate the structural and functional changes of the actin cytoskeleton in spine morphogenesis during neuronal development.
Drebrin, a major actin-binding protein in the brain (Shirao and Obata, 1985; Maekawa and Sakai, 1988; Hayashi et al., 1996; Luna et al., 1996), is localized at spines in adult brains (Shirao et al., 1987; Hayashi et al., 1996). Drebrin inhibits the actin-binding activity of tropomyosin and α-actinin (Ishikawa et al., 1994). It also suppresses actomyosin interactions (Hayashi et al., 1996). Transfection experiments have shown that drebrin remodels straight actin bundles into thick and winding bundles in fibroblasts (Shirao et al., 1994) and elongates the spine length in cortical neurons (Hayashi and Shirao, 1999). Thus, drebrin endows specialized functional properties to the actin cytoskeleton of spines. There are two major drebrin isoforms: an embryonic-type isoform (drebrin E) and an adult-type isoform (drebrin A) (Shirao et al., 1988). Drebrin A is a neuron-specific isoform that is expressed as an alternative splicing mechanism (for review, see Shirao, 1995). The isoform conversion of drebrin, which induces the upregulation of drebrin A, occurs in parallel with synapse formation (Shirao, 1995; Hayashi et al., 1998). In light of these results, we hypothesize that the developmentally regulated reorganization of postsynaptic actin cytoskeleton by drebrin governs an essential process of spine morphogenesis.
To examine this hypothesis, we used immunocytochemistry of cultured hippocampal neurons and unique cell-biological manipulations of the upregulation of drebrin A to address the following three questions: (1) how does the actin cytoskeleton change during spine morphogenesis, (2) is drebrin involved in the developmental changes of the actin cytoskeleton, and (3) do the developmental changes of PSD components depend on those of the actin cytoskeleton? Our results suggest that drebrin clusters with actin filaments play a more fundamental role than PSD components in spine morphogenesis during neuronal development.
Materials and Methods
Antibodies. The following antibodies were used as primary antibodies: mouse monoclonal anti-drebrin (clone M2F6) (Shirao and Obata, 1986), rabbit polyclonal anti-drebrin A (Shirao et al., 1994), mouse monoclonal anti-PSD-95 (clone 7E3-1B8; Affinity BioReagents, Golden, CO), rabbit polyclonal anti-synapsin I (Chemicon, Temecula, CA), and mouse monoclonal anti-β-actin (clone AC-15; Sigma, St. Louis, MO) antibodies. The following antibodies were used for immunocytochemistry as secondary antibodies: fluorescein-5-isothiocyanate-conjugated goat anti-mouse IgG (Cappel, West Chester, PA), rhodamine-conjugated goat anti-mouse IgG (Cappel), and Cy5-conjugated goat anti-rabbit IgG (Jackson ImmunoResearch, West Grove, PA) antibodies. Horseradish peroxidase-conjugated goat anti-mouse IgG (Cappel) and horseradish peroxidase-conjugated goat anti-rabbit IgG (Cappel) antibodies were used for Western blots as secondary antibodies.
Hippocampal cell culture. Primary hippocampal cultures were prepared according to previously described methods with slight modifications (Goslin et al., 1998). Briefly, hippocampi were dissected from embryonic 18-d-old Wistar rats, dissociated by trypsin treatment, and trituration through a Pasteur pipette. The neurons were plated on coverslips coated with poly-l-lysine in Minimum Essential Medium (Invitrogen, San Diego, CA) supplemented with 10% fetal bovine serum. The cell density was ∼5000 cells/cm2 for immunocytochemistry and 15,000 cells/cm2 for Western blot. After attachment of cells, the coverslips were transferred into a dish containing a glial monolayer sheet and maintained in serum-free Minimum Essential Medium with a B-27 supplement (Invitrogen). Cytosine β-d-arabinofuranoside (10 μm) was added to the cultures at 4 d after plating to inhibit glial proliferation. All of the animal experiments were performed according to the Animal Care and Experimentation Committee (Gunma University, Showa Campus, Maebashi, Japan). Every effort was made to minimize animal suffering and reduce the number of animals used.
Immunocytochemistry, F-actin staining, and fluorescent microscopy. Neurons were fixed in 4% paraformaldehyde in PBS at room temperature for 20 min. Fixed neurons were permeabilized with 0.1% Triton X-100 in PBS for 5 min and blocked using 3% bovine serum albumin in PBS for 60 min. The cultures were incubated overnight at 4°C with primary antibodies and rhodamine-conjugated phalloidin (Molecule Probes, Eugene, OR), which labels filamentous actin (F-actin). After washing with PBS for 30 min, the cultures were incubated with secondary antibodies for 1 hr at room temperature. Fluorescent images of the labeled cells were obtained on a Zeiss (Jena, Germany) Axioplan 2 microscope equipped with a CoolSnap fx cooled CCD camera (Photometrics, Tucson, AZ) and operated with MetaMorph software (Universal Imaging, West Chester, PA) through a 63×, 1.4 numerical aperture objective lens (Zeiss). A filter set (86000 Sedat Quad; Chroma, Brattleboro, VT) was mounted in excitation and emission filter wheels (Ludl Electronic Products, Hawthorne, NY) on the microscope. All of the data were collected at 1300 × 1030 resolution at 12 bits/pixel. A single pixel in the images corresponded to a 106 nm square in the specimen plane. Captured fluorescent images were analyzed using MetaMorph software (Universal Imaging). Images for presentation were prepared using Adobe Photoshop software (Adobe Systems, San Jose, CA).
Western blot analysis. For Western blot analysis, cell lysates from 10 coverslips of each treated culture were solubilized in 200 μl of sample buffer composed of 2% SDS, 5% 2-mercaptoethanol, 10% glycerol, 1 mm EDTA, 40 mm Tris, and 240 mm glycine at pH 8.5, and one-twentieth of the extract was loaded into each lane. The samples were subjected to SDS-PAGE (8% acrylamide) and transferred to an Immobilon transfer membrane (Millipore, Bedford, MA) by electroblotting (Hayashi et al., 1996). The blots were blocked in 10% nonfat milk in PBS, immunostained with the appropriate antibodies, and visualized with enhanced chemiluminescence (Amersham Biosciences, Buckinghamshire, UK). The chemiluminescent signals were projected on x-ray film and digitally scanned, and the signal on the digital image was quantitated using NIH Image.
Antisense experiments and cDNA transfection. Antisense phosphorothioate oligonucleotides and reversed antisense phosphorothioate oligonucleotides (24-mers) were targeted to a drebrin A-specific exon. The sequence of the antisense oligonucleotides against drebrin A (AOD) was 5′-AGGAAGGCCCACTGTCCGATGCCT-3′, and the sequence of the reversed antisense oligonucleotides against drebrin A (ROD) was 5′-TCCGTAGCCTGTCACCCGGAAGGA-3′. These oligonucleotides were supplied by Fasmac (Atugi, Japan). All of the experiments were repeated at least three times with different cultures to eliminate the possibility that unique culture conditions contributed to the observed effects.
The cDNA of rat drebrin A tagged with enhanced green fluorescent protein (GFP) at the C terminus was described previously (Hayashi and Shirao, 1999). For expression of GFP-drebrin A in neurons, we used a microinjection method. Glass micropipettes were filled with Tris-EDTA buffer, pH 8.0, that contained the cDNA (0.5 μg/μl). We injected the cDNA solution into nucleus of the 14 d in vitro (DIV) neurons treated with the AOD for 2 d using a micromanipulator (Eppendorf, Hamburg, Germany). After the injection, the neurons were maintained in a medium containing the AOD. The neurons were fixed and immunolabeled for PSD-95 and synapsin I. Under these conditions, ∼5% of the injected neurons expressed GFP signals. The GFP signals were obtained through the filters for fluorescein-5-isothiocyanate. We found no unsuitable fluorescent leakage of GFP signals through the other filters.
Quantification. For quantification, spiny neurons with pyramidal morphology were selected from at least three separate cultures using F-actin labeling. The dendrites that existed between the cell soma and the second branch point were selected for the analysis. All of the clearly evident dendritic protrusions >0.5 and <8 μm in length were included in these analyses. The maximum length and width of each protrusion were manually measured. The form factor of each protrusion, defined as the ratio of its maximum length to its maximum width, was calculated.
The cluster of each protein was defined as a round staining region with a peak fluorescent level that was twofold greater than the averaged fluorescent level of the dendrites. For filopodia classification, we also measured the fluorescent intensity along a filopodium, and determined the maximum fluorescent intensity of drebrin and the averaged intensity in a filopodium.
Dendritic protrusions were judged to be associated with a presynaptic terminal when the phalloidin staining overlapped with the synapsin I clusters at one or more pixels of each fluorescent imaging. This criterion was also applied to the analyses of the association of synapsin I clusters with drebrin clusters or with PSD-95 clusters. To analyze changes in synaptic PSD-95 clusters after the reexpression of drebrin A in AOD-treated neurons, we measured the average pixel intensities of synaptic PSD-95 clusters.
Data were statistically analyzed by Student's t test for comparing between two groups, or by ANOVA, with a post hoc test using Scheffé's F test for multiple comparison, as applicable. All of the data were presented as a mean ± SEM. In the morphological classification of dendritic protrusions, n represents the number of dendritic protrusions. In Western blot analysis, n represents the number of cultures. In the other analysis, n represents the number of dendrites.
Results
Morphologies of dendritic protrusions labeled with F-actin marker during development
To analyze developmental changes in the actin cytoskeleton of dendritic protrusions during spine morphogenesis, we performed F-actin staining of hippocampal neurons in low-density cultures at 7, 14, and 21 DIV, using rhodamine-conjugated phalloidin (Fig. 1). At 7 DIV, long, thin, and headless (filopodia-like) protrusions labeled with the phalloidin were observed along dendrites (Fig. 1A,D). At 14 DIV, the dendritic protrusions showed various shapes, including long and thin protrusions, with or without a small head, and mushroom-type or stubby spine-like protrusions (Fig. 1B,E). Furthermore, the F-actin levels of the spine-like protrusions were higher than those of the filopodia-like protrusions (Fig. 1E). At 21 DIV, almost all of the dendritic protrusions exhibited mushroom-like or stubby shapes, which have enriched levels of F-actin (Fig. 1C,F). We classified dendritic protrusions labeled with the phalloidin into filopodia or spines with the following morphological characteristics based on F-actin distributions: (1) a headless protrusion that was longer than 1 μm and possessed a form factor, the ratio of length to width, that was >2° was classified as a filopodium; and (2) all of the dendritic protrusions other than filopodia were classified as spines (Fig. 1G). At 7 DIV, almost all of the dendritic protrusions were classified as filopodia (filopodia density at 7 DIV was 44.0 ± 3.0 per 100 μm dendrite length, and spine density at 7 DIV was 1.5 ± 0.1 per 100 μm; n = 7) At 14 DIV, one-half of the dendritic protrusions were filopodia, and the other one-half were spines (filopodia density at 14 DIV was 29.1 ± 4.0 per 100 μm, and spine density at 14 DIV was 31.4 ± 4.1 per 100 μm; n = 9). At 21 DIV, most of the dendritic protrusions were spines (filopodia density at 21 DIV was 13.0 ± 1.8 per 100 μm, and spine density at 21 DIV was 76.6 ± 3.7 per 100 μm; n = 8) (Fig. 1H). These morphological results using phalloidin, which show the sequential appearance of dendritic filopodia and spines during development, are consistent with the results of previous studies using fluorescent dyes (Papa et al., 1995; Ziv and Smith, 1996).
Figure 1.
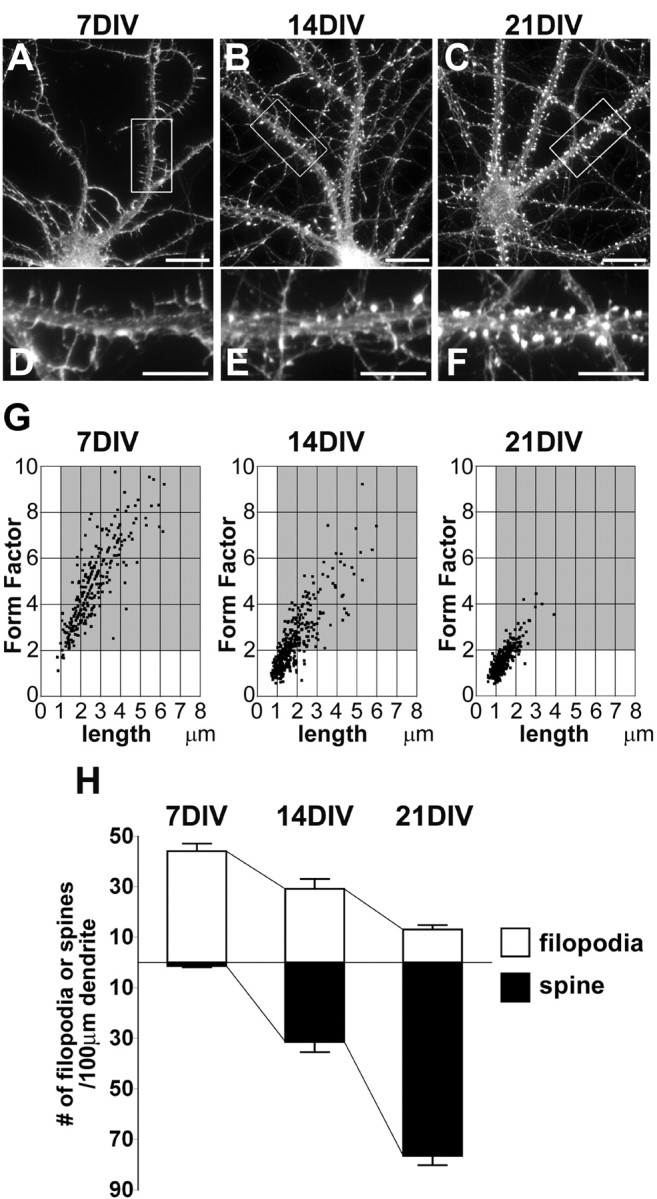
Morphological changes in dendritic protrusions of cultured hippocampal neurons during development. A-F, F-actin staining of hippocampal neurons in low-density cultures at 7, 14, and 21 DIV. Boxed regions in A-C are shown below at higher magnification in D-F, respectively. At 7 DIV, filopodia-like protrusions are detected along dendrites (A, D). At 14 DIV, the dendritic protrusions show various shapes (B, E). The F-actin levels of the spine-like protrusions are higher than those of the filopodia-like protrusions (E). At 21 DIV, most protrusions exhibit mushroom-like or stubby shapes, which have enriched levels of F-actin (C, F). Scale bars: A-C, 10 μm;D-F, 5 μm. G, Scatter plots of dendritic protrusion length versus its form factor (length/width) at 7, 14, and 21 DIV. Dendritic filopodia were defined as headless protrusions in the gray area (length, >1 μm; form factor, >2) of each plot (n = 275, 445, and 387 dendritic protrusions for 7, 14, and 21 DIV, respectively). H, Mean densities of filopodia and spines at 7, 14, and 21 DIV. During development, filopodia density decreases, whereas spine density increases. Error bars indicate SEM. Histograms show means + SEM (n = 7, 9, and 8 dendrites for 7, 14, and 21 DIV, respectively).
Developmental changes of drebrin and F-actin distributions
To investigate changes in the distributions of drebrin and F-actin in dendrites during neuronal development, we performed double labeling of hippocampal neurons for drebrin and F-actin at 7, 14, and 21 DIV (Fig. 2). At 7 DIV, the intense staining of drebrin and F-actin was observed in a similar pattern at the submembranous regions discontinuously along dendrites (Fig. 2A-C). The distributions of drebrin and F-actin within dendritic shafts were detected as a hazy and flecked staining pattern. The distributions of them at dendritic filopodia were observed as the fibrous staining pattern, although drebrin was hardly detected at the tip of some filopodia (Fig. 2C, arrows). At 21 DIV, most of the drebrin immunostaining was observed as clusters, which were colocalized with F-actin at spines (Fig. 2G-I). Drebrin staining was undetectable at dendritic shafts, although F-actin staining remained there (Fig. 2I). At 14 DIV, transitional distributions were observed (Fig. 2D-F). Throughout the culture periods, F-actin fluorescent labeling at sites of drebrin clusters was higher than those at neighbor sites.
Figure 2.

Developmental changes in distributions of drebrin and F-actin in dendrites. Double labeling of dendrites for drebrin (green) and F-actin (red) at 7, 14, and 21 DIV. A-C, At 7 DIV, the staining of drebrin and F-actin shows a fibrous pattern at filopodia, although the drebrin staining is hardly detected at the tip of some filopodia (C, arrows). The discontinuous staining of them is observed at the submembranous regions of a dendritic shaft. Their hazy and flecked staining is also observed in the cytosol of the dendrite. D-F, At 14 DIV, drebrin and F-actin clusters (yellow) are colocalized at dendritic protrusions. At a dendritic shaft, overlap of drebrin and F-actin stainings is reduced. G-I, At 21 DIV, many drebrin clusters with F-actin (yellow) are observed at spines. Staining of F-actin without drebrin (I, red) is observed at a dendritic shaft. Scale bars: C (for A-C), F (for D-F), I (for G-I), 5 μm.
Cluster formation of drebrin in dendritic filopodia
Drebrin immunostaining of dendritic filopodia exhibited two staining patterns (Fig. 3A): a diffuse staining pattern and a cluster staining pattern. The drebrin clusters were overlapped with the regions having enriched levels of F-actin (Fig. 3A, arrows). We classified dendritic filopodia into either cluster-type or diffuse-type filopodia in terms of drebrin clusters, using the following criteria of drebrin immunostaining intensity. When a filopodium had a drebrin cluster whose maximum intensity was higher than twice the average intensity of the filopodium, it was classified as a cluster-type filopodium (Fig. 3B, right column). When a filopodium did not have such a drebrin cluster, it was classified as a diffuse-type filopodium (Fig. 3B, left column). At 7 DIV, 86% of dendritic filopodia was classified as diffuse-type filopodia, and the rest (14%) was classified as cluster-type filopodia. At 14 DIV, the proportion of cluster-type filopodia increased to 48%. According to statistical analysis, the density of diffuse-type filopodia at 14 DIV was significantly lower than that at 7 DIV [the density of diffuse-type filopodia at 7 DIV was 34.8 ± 2.6 per 100 μm (n = 8), and that at 14 DIV was 14.1 ± 1.3 per 100 μm (n = 13); **p < 0.0001; t test]. Moreover, the density of cluster-type filopodia at 14 DIV was significantly higher than that at 7 DIV [the density of cluster-type filopodia at 7 DIV was 6.1 ± 2.0 per 100 μm (n = 8), and that at 14 DIV was 12.7 ± 1.5 per 100 μm(n = 13); *p < 0.01; t test)] (Fig. 3C).
Figure 3.

Two distinct types of dendritic filopodia based on drebrin staining. A, Double labeling of a typical dendrite at 14 DIV for drebrin and F-actin. Filopodium 1 shows diffuse staining of drebrin, and filopodium 3 shows the discontinuous staining of drebrin. However, drebrin clusters are observed at the middle region of filopodium 2 and at the basal region of filopodium 4. The drebrin clusters are overlapped with enriched F-actin area (arrows). Scale bar, 2 μm. B, Drebrin-immunofluorescent intensity along each filopodium in A. Each average intensity is indicated as a dotted line in each chart. A solid line in each chart indicates twice the average intensity of each filopodium. When a filopodium had a drebrin cluster whose maximum intensity exceeds the threshold of the solid line, it was defined as a cluster-type filopodium (right column). When a filopodium did not have such a drebrin cluster, it was classified as a diffuse-type filopodium (left column). AU, Arbitrary unit. C, Mean densities of diffuse-type and cluster-type filopodia at 7 DIV (n = 8 dendrites) and 14 DIV (n = 13 dendrites). The density of diffuse-type filopodia at 14 DIV is significantly lower than that at 7 DIV, whereas the density of cluster-type filopodia at 14 DIV is significantly higher than that at 7 DIV (*p < 0.01; **p < 0.0001; t test). Error bars indicate SEM. Histograms show means + SEM.
Drebrin clusters in dendritic filopodia are associated with presynaptic terminals
We examined the correlation between the cluster formation of drebrin in filopodia and the filopodia-axon contact. The neurons at 14 DIV were triple stained for F-actin, drebrin, and synapsin I [a presynaptic vesicle protein (DeCamilli et al., 1983)] (Fig. 4). Approximately one-half of filopodia (52%) were associated with synapsin I clusters. These filopodia were termed synaptic filopodia. The other one-half (48%) were not associated with synapsin I clusters. These filopodia were termed nonsynaptic filopodia, although some of nonsynaptic filopodia may have presynaptic terminals that have too few presynaptic vesicles to be immunocytochemically labeled. A majority of the cluster-type filopodia were synaptic filopodia, whereas most of the diffuse-type filopodia were nonsynaptic filopodia. Furthermore, in the synaptic cluster-type filopodia, drebrin clusters were always juxtaposed with synapsin I clusters. These data indicate that drebrin clusters in filopodia are precursors of postsynaptic structures of the spine synapses.
Figure 4.

Presynaptic contact and cluster formation of drebrin in dendritic filopodia. Triple labeling of dendritic filopodia at 14 DIV for drebrin (green), F-actin (red), and synapsin I (blue). Most cluster-type filopodia are associated with synapsin I puncta, whereas most diffuse-type filopodia are not. Each percentage is shown as mean ± SEM (n = 11 dendrites; *p < 0.01; **p < 0.001; Scheffé's F test). Scale bars, 2 μm.
Synaptic clustering of drebrin precedes that of PSD-95
Neurons at 14 DIV were triple stained for F-actin, synapsin I, and either PSD-95 or drebrin (Fig. 5A,C). We compared the postsynaptic clustering of PSD-95 and drebrin in synaptic filopodia with their clustering in synaptic spines that are associated with presynaptic terminals. Almost all of the synaptic spines (90.3 ± 2.3%) contained postsynaptic PSD-95 clusters, whereas approximately one-half of synaptic filopodia (56.7 ± 4.2%) contained postsynaptic PSD-95 clusters (n = 11; *p < 0.0001; t test) (Fig. 5B). In contrast, almost all of the synaptic spines (87.5 ± 3.2%) and almost all of the synaptic filopodia (86.7 ± 3.5%) contained postsynaptic drebrin clusters (n = 11; p = 0.99; t test) (Fig. 5D). These data indicate that the synaptic clustering of drebrin precedes that of PSD-95 in dendritic filopodia.
Figure 5.

Proportions of PSD-95 and drebrin clusters in synaptic filopodia and spines. A, Triple labeling of a dendrite for PSD-95 (green), F-actin (red), and synapsin I (blue) at 14 DIV. PSD-95 clusters are observed in synaptic filopodia (arrowhead) and in synaptic spines (asterisks). Note that PSD-95 clusters are not detected in some synaptic filopodia (double arrowheads). B, Comparison between a percentage of PSD-95 clustering in synaptic filopodia and that in synaptic spines. PSD-95 clustering in synaptic filopodia is significantly less than that in synaptic spines (n = 11 dendrites; *p < 0.0001; t test). C, Triple labeling of a dendrite for drebrin (green), F-actin (red), and synapsin I (blue) at 14 DIV. Drebrin clusters are observed in synaptic filopodia (arrowheads) and in synaptic spines (asterisks). D, Comparison between a percentage of drebrin clustering in synaptic filopodia and that in synaptic spines. Drebrin clusters are observed in synaptic filopodia at the same proportion in synaptic spines (n = 11 dendrites; p = 0.99; t test). Scale bars: A, C, 5 μm. Error bars indicate SEM (B, D). Histograms show mean + SEM (B, D).
Inhibition of clustering of drebrin with F-actin by drebrin A antisense treatment
We examined whether the synaptic clustering of PSD-95 depends on drebrin clustering with F-actin. For this investigation, we performed antisense experiments, because we showed that the AOD inhibited both drebrin A expression and cluster formation of drebrin in mature cortical neurons (S. Tanaka, Y. Sekino, and T. Shirao, unpublished observations). According to Western blot analysis, the application of 10 μm AOD for 2 d from 12 DIV significantly reduced drebrin A expression to 48% of control at 14 DIV, whereas the application of ROD (10 μm for 2 d) had no significant effect on the expression of drebrin A (n = 4; *p < 0.05, differences from control and ROD groups; Scheffé's F test) (Fig. 6A,B). However, both AOD and ROD had no significant effect on β-actin expression (n = 4; ANOVA; F = 1.00; p = 0.45) (Fig. 6A,B).
Figure 6.
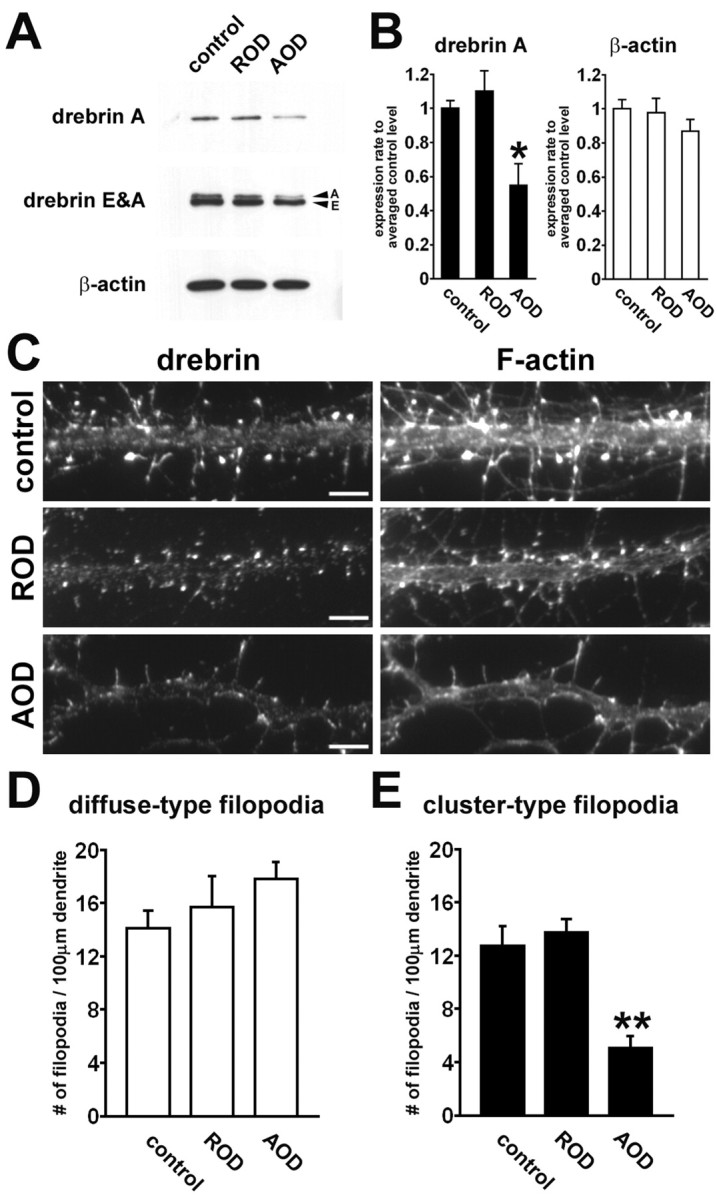
Changes of drebrin and F-actin distribution by antisense treatment. Cultured hippocampal neurons were treated with 10 μm AOD or ROD from 12 to 14 DIV. A, Western blots showing representative effect of AOD and ROD on expression of drebrin A, total drebrin (drebrin E and A), and β-actin. B, Densitometric analysis of the expression of drebrin A and β-actin. The AOD treatment significantly reduces drebrin A expression (n = 4 separate cultures; *p < 0.05, differences from control and ROD groups; Scheffé's F test). Neither AOD nor ROD has a significant effect on the expression of β-actin (n = 4 separate cultures; ANOVA; F = 1.00; p = 0.45). Error bars indicate SEM. Histograms show means + SEM. C, Double labeling of dendrites for drebrin (left) and F-actin (right) in control, ROD-treated, or AOD-treated neurons. The AOD treatment attenuates not only drebrin clustering but also F-actin clustering. Scale bars, 5 μm. D, E, Quantitative analysis of densities of diffuse-type (D) and cluster-type filopodia (E) in each group. The AOD treatment significantly reduces the density of cluster-type filopodia (n = 13, 10, 11 dendrites for control, ROD-treated, AOD-treated groups, respectively; **p < 0.001, differences from control and ROD groups; Scheffé's F test). Error bars indicate SEM. Histograms show means + SEM.
Double staining of cultured hippocampal neurons for drebrin and F-actin showed that the number of drebrin clusters and that of F-actin clusters were reduced in the AOD-treated neurons (Fig. 6C). These clusters were not located at filopodia or spines but were located at dendritic shafts. Quantitatively, the application of AOD significantly decreased the density of total and synaptic drebrin clusters at 14 DIV. The densities of total drebrin clusters in control, ROD-treated, and AOD-treated neurons were 97.3 ± 8.0, 88.3 ± 5.4, and 24.5 ± 2.5 per 100 μm, respectively (n = 6 for each group; p < 0.0001, differences from control and ROD groups; Scheffé's F test). The densities of synaptic drebrin clusters in control, ROD-treated, and AOD-treated neurons were 80.3 ± 7.2, 73.9 ± 4.6, and 14.6 ± 2.4 per 100 μm, respectively (n = 6 for each group; p < 0.0001, differences from control and ROD groups; Scheffé's F test). Furthermore, the application of AOD significantly decreased the density of cluster-type filopodia at 14 DIV to one-half that of control, although it did not significantly increase the density of diffuse-type filopodia (Fig. 6D). The densities of cluster-type filopodia in control, ROD-treated, and AOD-treated cultures were 12.7 ± 1.5, 13.7 ± 1.0, and 5.1 ± 0.9 per 100 μm, respectively (n = 13 for control, n = 10 for ROD-treated neurons, and n = 11 for AOD-treated neurons; **p < 0.001, differences from control and ROD groups; Scheffé's F test). The densities of diffuse-type filopodia in control, ROD-treated, and AOD-treated cultures were 14.1 ± 1.3, 15.7 ± 2.3, and 17.8 ± 1.3 per 100 μm, respectively (n = 13, 10, 11 for respective groups; ANOVA; F = 1.41; p = 0.26).
Inhibition of synaptic clustering of PSD-95 by drebrin A antisense treatment
We examined the effects of drebrin A downregulation on PSD-95 distribution at 14 DIV. Neurons in control, ROD-treated, and AOD-treated groups were double stained for PSD-95 and synapsin I (Fig. 7A-C), and the densities of total and synaptic PSD-95 clusters in each group was measured (D). PSD-95 distributions at cell soma are similar in each group (Fig. 7A-C), but PSD-95 clusters are diminished in AOD-treated neurons (C). Quantitatively, the densities of both total and synaptic PSD-95 clusters were significantly reduced by the AOD treatment, but not by the ROD treatment. The densities of total PSD-95 clusters in control, ROD-treated, and AOD-treated neurons were 69.9 ± 9.0, 69.4 ± 6.1, and 15.0 ± 3.2 per 100 μm, respectively (n = 10 for each group; *p < 0.0001, differences from control and ROD groups; Scheffé's F test). The densities of synaptic PSD-95 clusters in control, ROD-treated, and AOD-treated neurons were 54.8 ± 7.8, 57.6 ± 4.3, and 11.4 ± 2.1 per 100 μm, respectively (n = 10 for each group; *p < 0.0001, differences from control and ROD groups; Scheffé's F test). The effects of AOD treatment on drebrin and PSD-95 distributions were reversed after 48 hr of washout to ∼70% of control. These data suggest that synaptic clustering of PSD-95 is regulated by drebrin A expression.
Figure 7.

Synaptic clustering of PSD-95 is inhibited by the suppression of drebrin-A expression. Cultured hippocampal neurons were treated with 10 μm AOD or ROD from 12 to 14 DIV and were double labeled for PSD-95 and synapsin I. A-C, Top panels show grayscale images of PSD-95 immunolabeling of control (A), ROD-treated (B), and AOD-treated (C) neurons. Boxed regions in top panels are shown below at higher magnification as double labeling for PSD-95 (green) and synapsin I (red). Note that PSD-95 clusters are diminished in AOD-treated neurons, although PSD-95 distributions at cell soma are similar in each group. Scale bars: top panels, 10 μm; bottom panels, 5 μm. D, Quantitative analysis of densities of total and synaptic PSD-95 clusters in control, ROD-treated, or AOD-treated neurons. The AOD significantly reduces the densities of total and synaptic PSD-95 clusters (n = 10 dendrites for each group; *p < 0.0001, differences from control and ROD groups; Scheffé's F test). Error bars indicate SEM. Histograms show means + SEM.
Recovery of synaptic clustering of PSD-95 by reexpression of drebrin A
To confirm that cluster formation of drebrin regulates synaptic clustering of PSD-95, we investigated whether the replenishment of drebrin A into drebrin A knock-down neurons restores synaptic
clustering of PSD-95. We injected GFP-tagged drebrin A expression vectors into AOD-treated neurons at 14 DIV using a microinjection method and immunostained the neurons for PSD-95 and synapsin I after 36 hr (Fig. 8A). In neurons that moderately expressed GFP-drebrin A, the distribution of GFP-drebrin A showed a cluster pattern, and the GFP-drebrin A clusters were associated with synapsin I clusters. PSD-95 distribution also showed a cluster pattern in the expressing neurons, and the PSD-95 clusters were either overlapped or juxtaposed with GFP-drebrin A clusters. The averaged immunofluorescent intensity of synaptic PSD-95 clusters overlapping with GFP-drebrin A clusters in the expressing neurons was significantly higher than the averaged intensity of synaptic PSD-95 clusters in neighboring unexpressing neurons (*p < 0.0001; t test) (Fig. 8B). These results show that the disruption of synaptic PSD-95 clusters by AOD treatment is caused by the downregulation of drebrin A and suggest that synaptic clustering of PSD-95 depends on the level in the amount of drebrin A at postsynaptic sites.
Figure 8.
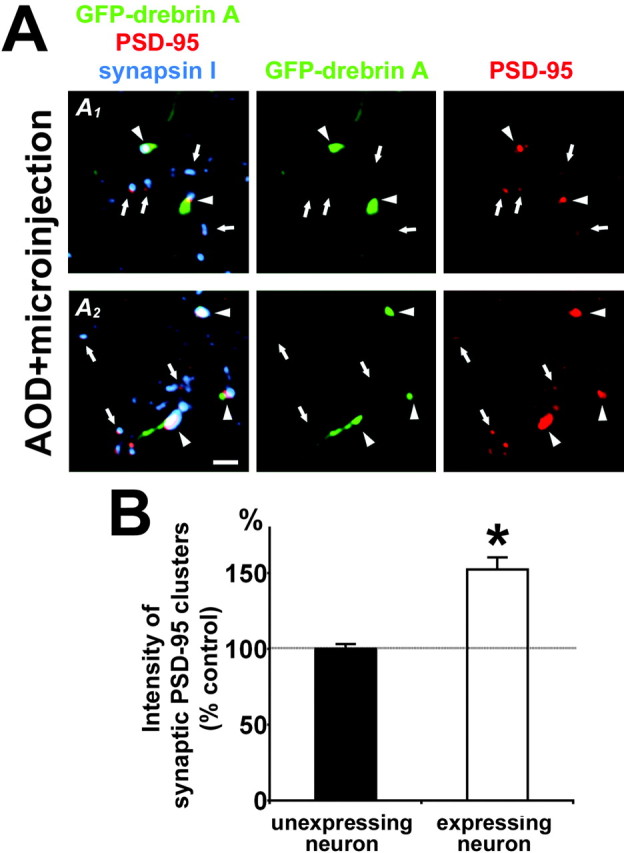
Replenishment of drebrin A into AOD-treated neurons restores synaptic clustering of PSD-95. A, Two examples (A1, A2) of triple labeling of the neurons in AOD-treated cultures for GFP-drebrin A (green), PSD-95 (red), and synapsin I (blue). We injected GFP-tagged drebrin A expression vectors into AOD-treated neurons at 14 DIV using a microinjection method and immunostained the neurons for PSD-95 and synapsin I after 36 hr. GFP-drebrin A clusters are juxtaposed with synapsin I clusters. The PSD-95 clusters overlapping with GFP-drebrin A clusters (arrowheads) are larger and brighter than other PSD-95 clusters that do not overlap with GFP-drebrin A clusters (arrows). Scale bar, 2 μm. B, Quantitative analysis of averaged intensities of synaptic PSD-95 clusters in AOD-treated neurons expressing or not expressing GFP-drebrin A. The solid horizontal line shows 100% of control. PSD-95 clustering is enhanced by replenishment of GFP-drebrin A (n = 8 dendrites; *p < 0.0001; t test). Error bars indicate SEM. Histograms show means + SEM.
Discussion
In this study, we demonstrate that synaptic clustering of drebrin is an essential step of establishment of postsynaptic structures during neuronal development. Clustering of drebrin with F-actin occurs at postsynaptic sites in dendritic filopodia that contact presynaptic terminals. Developmental upregulation of drebrin A is necessary for clustering of both drebrin and F-actin. Synaptic clustering of PSD-95 depends on the previous clustering of drebrin with F-actin. We propose the drebrin-regulated developmental change of the actin cytoskeleton as a novel molecular mechanism for synaptic targeting of postsynaptic molecules in spine morphogenesis.
Two distinct developmental states of dendritic filopodia
It has been proposed that dendritic filopodia serve as the precursor of dendritic spines during neuronal development (Dailey and Smith, 1996; Ziv and Smith, 1996; Dunaevsky et al., 1999), including the possibility that dendritic spines emerge from shaft synapses (Fiala et al., 1998). Furthermore, previous studies have suggested that the actin cytoskeleton mediates the morphology of both filopodia and spines (Fischer et al., 1998; Dunaevsky et al., 1999). However, developmental changes of the actin cytoskeleton during spine morphogenesis are undefined. Our findings about drebrin clusters with F-actin in filopodia enable the classification of filopodia into two distinct developmental states: immature diffuse-type filopodia and mature cluster-type filopodia. Low levels of PSD-95 clustering in synaptic filopodia indicate that a significant number of cluster-type filopodia does not contain PSD-95 clusters, although most of the mature spines contain PSD-95 clusters. Therefore, the cluster-type filopodia are different from mature spines. Furthermore, previous time-lapse studies have suggested the presence of a transitional stage in spine formation involving the conversion of dynamic filopodia to stable spines (Dailey and Smith, 1996; Ziv and Smith, 1996; Dunaevsky et al., 1999). The diffuse-type filopodia may represent the dynamic filopodia, and the cluster-type filopodia may represent the transitional stage.
However, mature spines also undergo rapid, actin-dependent shape changes (Fischer et al., 1998), and thin projections extend from spines in response to a strong repetitive neuronal activity (Colicos et al., 2001). It may be possible that the cluster-type filopodia that contain PSD-95 represent temporal snapshots of mature spines. However, previous electromicroscopical study has suggested that some filopodia have nascent synapses containing PSD structure and contribute to spine formation (Fiala et al., 1998). Furthermore, a recent time-lapse imaging study has shown that filopodia with mobile PSD-95 clusters directly transform into mature spines during development (Marrs et al., 2001). Therefore, most of the cluster-type filopodia containing PSD-95 clusters may represent the transitional stage into mature spines rather than temporal snapshots of mature spines. Together, these data suggest that dendritic spines develop via cluster-type filopodia that are transformed from diffuse-type filopodia.
Drebrin characterizes postsynaptic actin cytoskeleton during spine morphogenesis
Does drebrin actively initiate the cluster formation of actincytoskeletal components or merely bind with actin-cytoskeletal clusters that were initiated by other molecules? A previous study has shown that synaptic localization of drebrin is affected by actin depolymerization using latrunculin A (Allison et al., 2000), suggesting that drebrin may merely bind with actin-cytoskeletal clusters. However, our results show that the distribution of drebrin is not always identical with that of F-actin. This is consistent with previous studies that have shown that drebrin is associated with a structurally and functionally distinct pool of actin cytoskeletons (Asada et al., 1994; Sasaki et al., 1996; Peitsch et al., 1999; Fucini et al., 2000; Keon et al., 2000) (for review, see Shirao and Sekino, 2001). Furthermore, we showed that the suppression of drebrin A expression attenuates the cluster formation of F-actin (Fig. 6C). Together, these data show that drebrin, especially drebrin A, actively initiates the cluster formation of actincytoskeletal components at postsynaptic sites during spine morphogenesis.
How does drebrin change the structural and functional properties of actin cytoskeleton in spine morphogenesis? Drebrin can remodel straight actin bundles into thick and winding bundles in fibroblasts (Shirao et al., 1994). Furthermore, the drebrin A expression in fibroblasts induces cytochalasin D-resistant actin structures at their adhesion plaques (Ikeda et al., 1996). The dendritic spine is also a type of specialized adhesion machinery with cytochalasin D-resistant actin structures (Allison et al., 1998). Therefore, we suggest that drebrin forms the uniquely specialized F-actin subpool at postsynaptic sites. The specialized actin subpool may contribute to the establishment of cytoskeletal actin structure of dendritic spines such as meshwork-like arrangements of actin filaments in spine heads (Fifkova and Delay, 1982; Rao and Craig, 2000).
Cell signals that modify spine morphogenesis possibly via the reorganization of actin cytoskeleton have been reported. The Rho family of GTPases, a major intracellular signal transduction component that regulates actin cytoskeleton (Hall, 1998), is involved in spine morphology (Nakayama et al., 2000). Some cell surface molecules such as EphB2 receptor-syndecan-2 and N-cadherin also regulate spine morphogenesis via the actin cytoskeleton (Ethell et al., 2001; Irie and Yamaguchi, 2002; Togashi et al., 2002). Synaptic activity also modifies the cluster formation of F-actin. High KCl stimulation changes the neuronal actin cytoskeleton more resistant to an actin-depolymerizing reagent (Zhang and Benson, 2001). Furthermore, NMDA receptor (NMDAR) activity regulates F-actin clustering in mature hippocampal neurons (Halpain et al., 1998). Hence, it will be interesting to study the functional relationship between these cell signal cascades and the cluster formation of drebrin.
Relationship between synaptic clustering of drebrin and that of PSD-95 during spine morphogenesis
Synaptic molecules assemble in a stepwise manner at synaptic sites during synaptogenesis (Rao et al., 1998; Friedman et al., 2000). However, it is still unclear how postsynaptic molecules target to synaptic sites during spine morphogenesis, especially in process of the morphological change from filopodia to spines. PSD-95 clusters are rarely detected in filopodia of developing neurons (Okabe et al., 2001). AMPA receptors are sparsely distributed and rarely assemble in thin spines and filopodia (Matsuzaki et al., 2001). Our data clearly show that synaptic clustering of drebrin has occurred in filopodia associated with synapsin I clusters (synaptic filopodia). Furthermore, our data indicate that synaptic clustering of PSD-95 depends on the preceding formation of drebrin clusters. However, we cannot rule out the possibility that expression levels of drebrin A influence some aspects of PSD-95 clustering and spine morphogenesis independent of drebrin clustering. These data suggest that drebrin is involved in the initial step of the stepwise molecular assemblies during spine morphogenesis.
In mature hippocampal neurons, almost all of the PSD-95 clusters remain after treatment with latrunculin A, suggesting that PSD-95 distribution is independent of the actin cytoskeleton (Allison et al., 2000). In contrast, our experiments demonstrate that synaptic clustering of PSD-95 in developing neurons is dependent on cluster formation of drebrin with F-actin. It is consistent with the previous report that PSD-95 distribution in immature neurons is partially influenced by latrunculin A treatment (Zhang and Benson, 2001). Together, these data suggest that the molecular mechanisms of synaptic clustering of PSD-95 in immature neurons are different from those in mature neurons. Postsynaptic actin specialization regulated by drebrin may be critical for synaptic clustering of PSD components during neuronal development. However, once PSD components are assembled in mature spines, they may be stabilized by protein-protein interactions via their PSD-95-Dlg-ZO-1 domains and Src homology 3 domains (Sheng and Pak, 1999; McGee et al., 2001) or a lipid palmitoylation of them (El-Husseini et al., 2002) and become independent of the actin cytoskeleton.
A recent time-lapse study has shown that NMDAR transport packets are rapidly recruited to synaptic contact sites between neurons a few days after plating (e.g., at 3-4 DIV) (Washbourne et al., 2002). The observation does not seem to be consistent with our suggestion that drebrin triggers synaptic targeting of postsynaptic molecules, because drebrin is diffusely distributed at such culture days (Shirao and Sekino, 2001). The discrepancy is likely attributable to the differences of culture days and types of synaptic contact sites. We primarily observe synaptic contacts between a dendritic filopodium and an en passant axon at 7-21 DIV. This type of synaptic contact predominates at 7-21 DIV but is rarely detected at 3-4 DIV. The recruitment of NMDARs is observed primarily at synaptic contacts between a growth cone filopodium of a terminus axon and a dendrite shaft and between an axon and a dendrite shaft (Washbourne et al., 2002).
The roles of actin cytoskeleton and PSD components in spine morphogenesis
What is a functional difference between the actin cytoskeleton and PSD components in spine morphogenesis? A recent study has shown that the knock-out of LIMK-1 (LIM kinase-1), which regulates cofilin phosphorylation and actin dynamics, attenuates the normal accumulation of F-actin in spines, resulting in the abnormal spine morphology such as smaller spine heads and shortened PSD structures (Meng et al., 2002). In contrast, the knock-out of PSD-95 has no influence on spine morphology (Migaud et al., 1998). These results indicate that actin cytoskeleton is more crucial than PSD-95 for spine morphogenesis. However, it has been shown that PSD components can modify spine morphology. The overexpression of PSD-95 induces the enlargement of spines and synaptic AMPA receptor trafficking (El-Husseini et al., 2000). Coexpression of Shank and Homer also promotes the morphological maturation of spines (Sala et al., 2001). On the basis of these data, we suggest that the actin cytoskeleton establishes fundamental postsynaptic structures, which are required for synaptic targeting of postsynaptic molecules, whereas PSD components modify the established postsynaptic structures.
Footnotes
This work was supported by Grant-in-Aid 12053209 for Scientific Research from the Ministry of Education, Science, Sports and Culture of Japan. We thank Dr. Gary Banker for advice concerning our hippocampal culture techniques.
Correspondence should be addressed to Dr. Tomoaki Shirao, Department of Neurobiology and Behavior, Gunma University Graduate School of Medicine, 3-39-22 Showamachi, Maebashi 371-8511, Japan. E-mail: tshirao@med.gunma-u.ac.jp.
Copyright © 2003 Society for Neuroscience 0270-6474/03/236586-10$15.00/0
References
- Allison DW, Gelfand VI, Spector I, Craig AM ( 1998) Role of actin in anchoring postsynaptic receptors in cultured hippocampal neurons: differential attachment of NMDA versus AMPA receptors. J Neurosci 18: 2423-2436. [DOI] [PMC free article] [PubMed] [Google Scholar]
- Allison DW, Chervin AS, Gelfand VI, Craig AM ( 2000) Postsynaptic scaffolds of excitatory and inhibitory synapses in hippocampal neurons: maintenance of core components independent of actin filaments and microtubules. J Neurosci 20: 4545-4554. [DOI] [PMC free article] [PubMed] [Google Scholar]
- Asada H, Uyemura K, Shirao T ( 1994) Actin-binding protein, drebrin, accumulates in submembranous regions in parallel with neuronal differentiation. J Neurosci Res 38: 149-159. [DOI] [PubMed] [Google Scholar]
- Colicos MA, Collins BE, Sailor MJ, Goda Y ( 2001) Remodeling of synaptic actin induced by photoconductive stimulation. Cell 107: 605-616. [DOI] [PubMed] [Google Scholar]
- Dailey ME, Smith SJ ( 1996) The dynamics of dendritic structure in developing hippocampal slices. J Neurosci 16: 2983-2994. [DOI] [PMC free article] [PubMed] [Google Scholar]
- DeCamilli P, Cameron R, Greengard P ( 1983) Synapsin I (protein I), a nerve terminal specific phosphoprotein. I. Its general distribution in synapses of the central and peripheral nervous system demonstrated by immunofluorescence in frozen and plastic sections. J Cell Biol 96: 1337-1354. [DOI] [PMC free article] [PubMed] [Google Scholar]
- Dunaevsky A, Tashiro A, Majewska A, Mason C, Yuste R ( 1999) Developmental regulation of spine motility in the mammalian central nervous system. Proc Natl Acad Sci USA 96: 13438-13443. [DOI] [PMC free article] [PubMed] [Google Scholar]
- El-Husseini AE, Schnell E, Chetkovich DM, Nicoll RA, Bredt DS ( 2000) PSD-95 involvement in maturation of excitatory synapses. Science 290: 1364-1368. [PubMed] [Google Scholar]
- El-Husseini AE, Schnell E, Dakoji S, Sweeney N, Zhou Q, Prange O, Gauthier-Campbell C, Aguilera-Moreno A, Nicoll RA, Bredt DS ( 2002) Synaptic strength regulated by palmitate cycling on PSD-95. Cell 108: 849-863. [DOI] [PubMed] [Google Scholar]
- Ethell IM, Irie F, Kalo MS, Couchman JR, Pasquale EB, Yamaguchi Y ( 2001) EphB/syndecan-2 signaling in dendritic spine morphogenesis. Neuron 31: 1001-1013. [DOI] [PubMed] [Google Scholar]
- Fiala JC, Feinberg M, Popov V, Harris KM ( 1998) Synaptogenesis via dendritic filopodia in developing hippocampal area CA1. J Neurosci 18: 8900-8911. [DOI] [PMC free article] [PubMed] [Google Scholar]
- Fifkova E, Delay RJ ( 1982) Cytoplasmic actin in neuronal processes as a possible mediator of synaptic plasticity. J Cell Biol 95: 345-350. [DOI] [PMC free article] [PubMed] [Google Scholar]
- Fischer M, Kaech S, Knutti D, Matus A ( 1998) Rapid actin-based plasticity in dendritic spines. Neuron 20: 847-854. [DOI] [PubMed] [Google Scholar]
- Friedman HV, Bresler T, Garner CC, Ziv NE ( 2000) Assembly of new individual excitatory synapses: time course and temporal order of synaptic molecule recruitment. Neuron 27: 57-69. [DOI] [PubMed] [Google Scholar]
- Fucini RV, Navarrete A, Vadakkan C, Lacomis L, Erdjument-Bromage H, Tempst P, Stamnes M ( 2000) Activated ADP-ribosylation factor assembles distinct pools of actin on Golgi membranes. J Biol Chem 275: 18824-18829. [DOI] [PubMed] [Google Scholar]
- Goslin K, Asumussen H, Banker G ( 1998) Rat hippocampal neurons in low-density culture. In: Culturing nerve cells (Banker G, Goslin K, eds), pp 339-370. Cambridge, MA: MIT.
- Hall A ( 1998) G proteins and small GTPases: distant relatives keep in touch. Science 280: 2074-2075. [DOI] [PubMed] [Google Scholar]
- Halpain S, Hipolito A, Saffer L ( 1998) Regulation of F-actin stability in dendritic spines by glutamate receptors and calcineurin. J Neurosci 18: 9835-9844. [DOI] [PMC free article] [PubMed] [Google Scholar]
- Harris KM ( 1999) Structure, development, and plasticity of dendritic spines. Curr Opin Neurobiol 9: 343-348. [DOI] [PubMed] [Google Scholar]
- Harris KM, Kater SB ( 1994) Dendritic spines: cellular specializations imparting both stability and flexibility to synaptic function. Annu Rev Neurosci 17: 341-371. [DOI] [PubMed] [Google Scholar]
- Hayashi K, Shirao T ( 1999) Change in the shape of dendritic spines caused by overexpression of drebrin in cultured cortical neurons. J Neurosci 19: 3918-3925. [DOI] [PMC free article] [PubMed] [Google Scholar]
- Hayashi K, Ishikawa R, Ye LH, He XL, Takata K, Kohama K, Shirao T ( 1996) Modulatory role of drebrin on the cytoskeleton within dendritic spines in the rat cerebral cortex. J Neurosci 16: 7161-7170. [DOI] [PMC free article] [PubMed] [Google Scholar]
- Hayashi K, Suzuki K, Shirao T ( 1998) Rapid conversion of drebrin isoforms during synapse formation in primary culture of cortical neurons. Brain Res Dev Brain Res 111: 137-141. [DOI] [PubMed] [Google Scholar]
- Ikeda K, Kaub PA, Asada H, Uyemura K, Toya S, Shirao T ( 1996) Stabilization of adhesion plaques by the expression of drebrin A in fibroblasts. Brain Res Dev Brain Res 91: 227-236. [DOI] [PubMed] [Google Scholar]
- Irie F, Yamaguchi Y ( 2002) EphB receptors regulate dendritic spine development via intersectin, Cdc42 and N-WASP. Nat Neurosci 5: 1117-1118. [DOI] [PubMed] [Google Scholar]
- Ishikawa R, Hayashi K, Shirao T, Xue Y, Takagi T, Sasaki Y, Kohama K ( 1994) Drebrin, a development-associated brain protein from rat embryo, causes the dissociation of tropomyosin from actin filaments. J Biol Chem 269: 29928-29933. [PubMed] [Google Scholar]
- Keon BH, Jedrzejewski PT, Paul DL, Goodenough DA ( 2000) Isoform specific expression of the neuronal F-actin binding protein, drebrin, in specialized cells of stomach and kidney epithelia. J Cell Sci 113: 325-336. [DOI] [PubMed] [Google Scholar]
- Luna JE, Pestonjamasp NK, Cheney ER, Stassel PC, Lu HT, Chia PC, Hitt LA, Fechheimer M, Furthmayr H, Mooseker SM ( 1996) Actin-binding membrane proteins identified by F-actin blot overlays. In: Cytoskeletal regulation of membrane function: society of general physiologists series (Froehner SC, Bennett V, eds), Vol 52, pp 3-18. New York: Rockefeller UP. [PubMed] [Google Scholar]
- Maekawa S, Sakai H ( 1988) Isolation of 110K actin binding protein from mammalian brain and its immunocytochemical localization within cultured cells. Exp Cell Res 178: 127-142. [DOI] [PubMed] [Google Scholar]
- Marrs GS, Green SH, Dailey ME ( 2001) Rapid formation and remodeling of postsynaptic densities in developing dendrites. Nat Neurosci 4: 1006-1013. [DOI] [PubMed] [Google Scholar]
- Matsuzaki M, Ellis-Davies GC, Nemoto T, Miyashita Y, Iino M, Kasai H ( 2001) Dendritic spine geometry is critical for AMPA receptor expression in hippocampal CA1 pyramidal neurons. Nat Neurosci 4: 1086-1092. [DOI] [PMC free article] [PubMed] [Google Scholar]
- Matus A ( 2000) Actin-based plasticity in dendritic spines. Science 290: 754-758. [DOI] [PubMed] [Google Scholar]
- Matus A, Ackermann M, Pehling G, Byers HR, Fujiwara K ( 1982) High actin concentrations in brain dendritic spines and postsynaptic densities. Proc Natl Acad Sci USA 79: 7590-7594. [DOI] [PMC free article] [PubMed] [Google Scholar]
- McGee AW, Dakoji SR, Olsen O, Bredt DS, Lim WA, Prehoda KE ( 2001) Structure of the SH3-guanylate kinase module from PSD-95 suggests a mechanism for regulated assembly of MAGUK scaffolding proteins. Mol Cell 8: 1291-1301. [DOI] [PubMed] [Google Scholar]
- Meng Y, Zhang Y, Tregoubov V, Janus C, Cruz L, Jackson M, Lu WY, MacDonald JF, Wang JY, Falls DL, Jia Z ( 2002) Abnormal spine morphology and enhanced LTP in LIMK-1 knockout mice. Neuron 35: 121-133. [DOI] [PubMed] [Google Scholar]
- Migaud M, Charlesworth P, Dempster M, Webster LC, Watabe AM, Makhinson M, He Y, Ramsay MF, Morris RG, Morrison JH, O'Dell TJ, Grant SG ( 1998) Enhanced long-term potentiation and impaired learning in mice with mutant postsynaptic density-95 protein. Nature 396: 433-439. [DOI] [PubMed] [Google Scholar]
- Nakayama AY, Harms MB, Luo L ( 2000) Small GTPases Rac and Rho in the maintenance of dendritic spines and branches in hippocampal pyramidal neurons. J Neurosci 20: 5329-5338. [DOI] [PMC free article] [PubMed] [Google Scholar]
- Okabe S, Miwa A, Okado H ( 2001) Spine formation and correlated assembly of presynaptic and postsynaptic molecules. J Neurosci 21: 6105-6114. [DOI] [PMC free article] [PubMed] [Google Scholar]
- Pak DT, Yang S, Rudolph-Correia S, Kim E, Sheng M ( 2001) Regulation of dendritic spine morphology by SPAR, a PSD-95-associated RapGAP. Neuron 31: 289-303. [DOI] [PubMed] [Google Scholar]
- Papa M, Bundman MC, Greenberger V, Segal M ( 1995) Morphological analysis of dendritic spine development in primary cultures of hippocampal neurons. J Neurosci 15: 1-11. [DOI] [PMC free article] [PubMed] [Google Scholar]
- Peitsch WK, Grund C, Kuhn C, Schnolzer M, Spring H, Schmelz M, Franke WW ( 1999) Drebrin is a widespread actin-associating protein enriched at junctional plaques, defining a specific microfilament anchorage system in polar epithelial cells. Eur J Cell Biol 78: 767-778. [DOI] [PubMed] [Google Scholar]
- Prange O, Murphy TH ( 2001) Modular transport of postsynaptic density-95 clusters and association with stable spine precursors during early development of cortical neurons. J Neurosci 21: 9325-9333. [DOI] [PMC free article] [PubMed] [Google Scholar]
- Rao A, Craig AM ( 2000) Signaling between the actin cytoskeleton and the postsynaptic density of dendritic spines. Hippocampus 10: 527-541. [DOI] [PubMed] [Google Scholar]
- Rao A, Kim E, Sheng M, Craig AM ( 1998) Heterogeneity in the molecular composition of excitatory postsynaptic sites during development of hippocampal neurons in culture. J Neurosci 18: 1217-1229. [DOI] [PMC free article] [PubMed] [Google Scholar]
- Sala C, Piech V, Wilson NR, Passafaro M, Liu G, Sheng M ( 2001) Regulation of dendritic spine morphology and synaptic function by Shank and Homer. Neuron 31: 115-130. [DOI] [PubMed] [Google Scholar]
- Sasaki Y, Hayashi K, Shirao T, Ishikawa R, Kohama K ( 1996) Inhibition by drebrin of the actin-bundling activity of brain fascin, a protein localized in filopodia of growth cones. J Neurochem 66: 980-988. [DOI] [PubMed] [Google Scholar]
- Sheng M, Pak DT ( 1999) Glutamate receptor anchoring proteins and the molecular organization of excitatory synapses. Ann NY Acad Sci 868: 483-493. [DOI] [PubMed] [Google Scholar]
- Shirao T ( 1995) The roles of microfilament-associated proteins, drebrins, in brain morphogenesis: a review. J Biochem (Tokyo) 117: 231-236. [DOI] [PubMed] [Google Scholar]
- Shirao T, Obata K ( 1985) Two acidic proteins associated with brain development in chick embryo. J Neurochem 44: 1210-1216. [DOI] [PubMed] [Google Scholar]
- Shirao T, Obata K ( 1986) Immunochemical homology of 3 developmentally regulated brain proteins and their developmental change in neuronal distribution. Brain Res 394: 233-244. [DOI] [PubMed] [Google Scholar]
- Shirao T, Sekino Y ( 2001) Clustering and anchoring mechanisms of molecular constituents of postsynaptic scaffolds in dendritic spines. Neurosci Res 40: 1-7. [DOI] [PubMed] [Google Scholar]
- Shirao T, Inoue HK, Kano Y, Obata K ( 1987) Localization of a developmentally regulated neuron-specific protein S54 in dendrites as revealed by immunoelectron microscopy. Brain Res 413: 374-378. [DOI] [PubMed] [Google Scholar]
- Shirao T, Kojima N, Kato Y, Obata K ( 1988) Molecular cloning of a cDNA for the developmentally regulated brain protein, drebrin. Brain Res 464: 71-74. [DOI] [PubMed] [Google Scholar]
- Shirao T, Hayashi K, Ishikawa R, Isa K, Asada H, Ikeda K, Uyemura K ( 1994) Formation of thick, curving bundles of actin by drebrin A expressed in fibroblasts. Exp Cell Res 215: 145-153. [DOI] [PubMed] [Google Scholar]
- Togashi H, Abe K, Mizoguchi A, Takaoka K, Chisaka O, Takeichi M ( 2002) Cadherin regulates dendritic spine morphogenesis. Neuron 35: 77-89. [DOI] [PubMed] [Google Scholar]
- Washbourne P, Bennett JE, McAllister AK ( 2002) Rapid recruitment of NMDA receptor transport packets to nascent synapses. Nat Neurosci 5: 751-759. [DOI] [PubMed] [Google Scholar]
- Yuste R, Bonhoeffer T ( 2001) Morphological changes in dendritic spines associated with long-term synaptic plasticity. Annu Rev Neurosci 24: 1071-1089. [DOI] [PubMed] [Google Scholar]
- Zhang W, Benson DL ( 2001) Stages of synapse development defined by dependence on F-actin. J Neurosci 21: 5169-5181. [DOI] [PMC free article] [PubMed] [Google Scholar]
- Ziv NE, Smith SJ ( 1996) Evidence for a role of dendritic filopodia in synaptogenesis and spine formation. Neuron 17: 91-102. [DOI] [PubMed] [Google Scholar]