

Abstract
The superior colliculus (SC) transforms both visual and nonvisual sensory signals into motor commands that control orienting behavior. Although the afferent and efferent connections of this midbrain nucleus have been well characterized, little is know about the intrinsic circuitry involved in sensorimotor integration. Transmission of visual signals from the superficial (sSC) to the deeper layers (dSC) of the SC has been implicated in both the triggering of orienting movements and the activity-dependent processes that align maps of different sensory modalities during development. However, evidence for the synaptic connectivity appropriate for these functions is lacking. In this study, we used a variety of anatomical and physiological methods to examine the functional organization of the sSC-dSC pathway in juvenile and adult ferrets. Axonal tracing in adult ferrets showed that, as in other species, sSC neurons project topographically to the dSC, providing a route for the transmission of visual signals to the multisensory output layers of the SC. We found that sSC axons terminate on dSC neurons that stain prominently for the NR1 subunit of the NMDA receptor, a subpopulation of which were identified as tectoreticulospinal projection neurons. We also show that the sSC-dSC pathway is topographically organized and mediated by monosynaptic excitatory synapses even before eye opening in young ferrets, suggesting that visual signals routed via the sSC may influence the activity of dSC neurons before the emergence of their multisensory response properties. These findings indicate that superficial- to deep-layer projections provide spatially ordered visual signals, both during development and into adulthood, directly to SC neurons that are involved in coordinating sensory inputs with motor outputs.
Keywords: superior colliculus, sensorimotor integration, development, NMDA, predorsal bundle, whole-cell patch-clamp recordings, biotinylated dextran amine, electron microscopy
Introduction
The capacity to use sensory information to control movement represents one of the primary integrative functions of the CNS. Because stimuli are often registered by more than one sensory modality, this process typically involves the coordination and synthesis of different sensory signals arising from a common source and their transformation into appropriate motor commands.
The superior colliculus (SC) is widely used for investigating the principles underlying both multisensory and sensorimotor processing. This midbrain nucleus receives visual, auditory, and tactile inputs, encodes this information in a common coordinate frame, and uses it to initiate and guide orienting movements toward the stimulus source (for review, see Stein et al., 1995; Sparks, 1988, 1999).
The SC comprises a purely sensory region, the superficial layers (sSC), which contain a map of the contralateral visual field, and a deeper region (dSC) in which neurons can exhibit both sensory and motor-related activity. The receptive fields of dSC neurons are arranged to form superimposed maps of visual and auditory space and the body surface, whereas their movement fields constitute a motor map of eye and head movements (Gordon, 1973; Sparks, 1988; Wallace et al., 1996).
Although the connections and physiological properties of neurons in both the sSC and dSC have been studied extensively, we still have a poor understanding of how sensory signals are combined and transformed into motor commands. This primarily reflects the paucity of information about the intrinsic organization of the SC. For instance, anatomical (Grantyn et al., 1984; Moschovakis et al., 1988; Rhoades et al., 1989; Behan and Appell, 1992; Hall and Lee, 1997; Doubell et al., 2000) and electrophysiological (Mooney et al., 1992; Lee et al., 1997; Isa et al., 1998; Özen et al., 2000) studies have provided evidence for interlaminar connections between the sSC and dSC, but their role in SC processing remains unclear.
Early models of sensorimotor integration proposed that visual signals in the sSC are relayed to premotor or movement-related neurons in the dSC (Schiller and Stryker, 1972; Mohler and Wurtz, 1976). However, the contribution of activity in the sSC to the visual guidance of behavior remains controversial (Casagrande and Diamond, 1974; Mays and Sparks, 1980; Chabli et al., 2000; Lomber et al., 2001; Isa, 2002). It has also been suggested that sSC activity is involved in aligning the different sensory maps in the SC during development. Partial aspiration of the sSC in neonatal ferrets disrupts the emergence of topographic order in the auditory map in the underlying dSC (King et al., 1998). Similar experiments in young barn owls further indicate that the developing auditory space map conforms to a visual template arising from the superficial layers of the optic tectum, the avian homolog of the SC (Hyde and Knudsen, 2002).
Additional insights into the role of the interlaminar pathway will require more detailed information about the synaptic connectivity of sSC neurons. In this study, we show that sSC axons make excitatory, topographically organized contacts with dSC neurons, even before the onset of sensory function, and are therefore well placed to coordinate the development of the different sensory maps in the dSC. We also show that these axons terminate on predorsal bundle neurons that project to the brainstem and spinal cord, thus providing a direct route by which visual signals are transformed into motor commands.
Materials and Methods
In total, 29 darkly pigmented infant, juvenile, and adult (>1 yr of age) ferrets (Mustella putorious) were used in this study. All of the procedures involving animals were approved and licensed by the United Kingdom Home Office following local ethical committee review.
Carbocyanine dye tracing in fixed tissue from neonatal ferrets. Ferrets aged between postnatal day 4 (P4) and P30 were perfused with 50 ml of PBS containing heparin (1000 U/l), followed by 250 ml of 4% paraformaldehyde in phosphate buffer. In each case, the brain was dissected out and, after removal of the cortex, left in the same fixative at room temperature. Tiny crystals (∼100 μm diameter) of the carbocyanine dyes 1,1′-dioctadecyl-3,3,3′,3′-tetramethylindocarbocyanine perchlorate (DiI) and 4-[4-(didecylamino)styryl]-N-methylpyridinium iodide (DiAsp) (Molecular Probes, Eugene, OR) were selected under the microscope and inserted into the dorsal surface of the SC (to label the sSC) or into the posterior tegmental commissure at the midline (to label the tectoreticulospinal output cells) with the aid of a syringe needle. Two combinations of dye placements were used: DiAsp in the sSC and DiI in the posterior tegmental commissure; or DiI-DiAsp side by side in either the rostrocaudal or mediolateral plane of the sSC. The brains were left for 1-6 weeks for dye transport before sectioning and mounting in phosphate buffer. Selected sections were photographed under the appropriate rhodamine or fluorescein filter set.
Electrophysiological recording in vitro. Coronal slices of the midbrain (500 μm) were prepared from young ferrets (n = 7) (P25-P30), as described previously (Doubell et al., 2000). Briefly, animals were deeply anesthetized, and the brain was quickly removed and submerged in ice-cold saline containing (in mm): 124 NaCl, 26 NaHCO3, 2.5 CaCl2, 2.3 KCl, 1.26 KHPO4, 1.0 MgSO4, and 10 d-glucose, bubbled with 95% O2 and 5% CO2. Slices were cut with a Vibroslice (Campden Instruments, Sileby, UK) and placed in oxygenated saline at room temperature. After 30-60 min of incubation, the slices were transferred to the stage of an upright microscope (Axioskop FS; Zeiss, Welwyn Garden City, UK) equipped with video-enhanced differential interference contrast optics and continuously superfused with saline. Under a low-power, 4× objective, the slice boundaries and lamination of the SC were identified, and drawn onto acetate sheets using a camera and video monitor. Recording and stimulating electrodes were targeted to the appropriate region of the SC during the experiment, and all of the slices were subsequently processed for light microscopy. Individual cells in the dSC were visualized with Nomarski optics with the use of a 63× water immersion objective. Whole-cell patch-clamp recordings were made under visual control with electrodes containing (in mm): 120 K-gluconate, 10 KCl, 10 EGTA, 10 HEPES, 2 CaCl2, 2 MgCl2, and 2 ATP-Na, and 0.5% biocytin to stain the recorded neurons. The resistance of the electrodes was 8-11 MΩ in the bath solution. All of the recordings were performed at room temperature (23-24°C).
Electrical stimuli (monophasic; 0.02 msec square pulses ranging between 3 and 100 V) were applied with a frequency of 0.6-1.0 Hz through a θ-shaped glass pipette filled with extracellular saline positioned in the sSC. Stimulus strength was increased gradually until an evoked EPSP was visible. Each file included 30-50 repetitions of the stimulus. After conventional amplification (Axoclamp-2B; Axon Instruments, Foster City, CA), the data were digitized at 20 kHz and fed into a computer (Power Mac; Apple Computer, Cupertino, CA) (ITC-16 interface and Axograph software; Axon Instruments). EPSP latencies were measured manually for each of the traces and plotted as a function of time. We used the following measures to indicate the latency variability: (1) the average latency for all of the traces in each file, (2) the latency jitter, defined as the range (in msec) between the shortest and longest latency for a given input onto a given cell, and (3) the SD of the latency values for any given input. We used a combination of all three measures to provide evidence for direct connectivity of both EPSPs and IPSPs, as explained in Results. Patch pipettes were carefully detached from the cells, and the slices were fixed with 4% paraformaldehyde. Slices were resectioned at 50 μm, incubated in the ABC reagent (Vector Laboratories, Peterborough, UK), and processed as described below.
Tracer injections in adult ferrets: axon projections from the sSC to the dSC. Two adult ferrets was anesthetized with alphaxalone-alphadolone acetate (Saffan; Mallinckrodt Veterinary, Uxbridge, UK), induced with 2 ml/kg intramuscular injections and maintained with smaller doses of the same anesthetic. After deflecting the skin and muscle over the skull, a small craniotomy was made, and the overlying cortex was aspirated to reveal the midbrain. Small injections of 4% biocytin (in saline) were made into the sSC by iontophoresis for 10 min at 5 μA on a 50% duty cycle. The aspirated space above the midbrain was filled with gel foam (Sterispon; Allen and Hanbury, London, UK), the cranial bone was replaced, and the skin and muscle were sutured. After a survival period of 20 hr, the animal was terminally anesthetized with sodium pentobarbitone and perfused with PBS, followed by fixative containing 4% paraformaldehyde. Biocytin was visualized as described below for biotinylated dextran amine (BDA) in method 1, except that the midbrain was sectioned into 10 series, of which two were counterstained in cresyl violet. The section outline plus the laminar boundaries, injection sites, axons, and boutons within the SC were plotted for every third section using a computer reconstruction program (Neurolucida; MicroBrightField, Colchester, VT). Plan projection maps of the main foci of terminals in the intermediate layers of the SC were prepared in the following manner. The mediolateral extent of the layer II-III boundary, together with those of the injection site in layer II-III and of the main terminal zone in layer IV were plotted for every section from the rostral to the caudal end of the SC. Plotted points were connected for each pair of adjacent sections to provide a dorsal view of both the injection site and the terminal zone within the SC.
Tracer injections in adult ferrets: colocalization of NR1 immunoreactivity and crossed tectoreticulospinal projection neurons. An additional two adult ferrets were anesthetized with Saffan, and the midbrain was exposed. Glass micropipettes were back-filled with 2 μl of 5% 10 kDa BDA (Molecular Probes), lysine fixable, and 100 mm NMDA (Sigma, St. Louis, MO) in 0.01 m PBS (Veenman et al., 1992; Jiang et al., 1993). The pipette was fitted into a sealed electrode holder connected via a three-way tap to a compressed air source. The pipette was placed over the border of the inferior colliculus and cerebellum and lowered into the reticular formation. A total of ∼500 nl was injected into the left side. The pipette was then left in place for 10 min before being withdrawn. After a survival period of 7 d, the animals were perfused, as described above. The brain was removed, trimmed to expose the midbrain, postfixed overnight, cryoprotected, and cut at 50 μm on a freezing microtome. After three extensive rinses in PBS to remove unbound aldehydes, the tissue sections were stored at 4°C in the same buffer until additional histological processing. Every third section of the rostrocaudal series through the SC was stained with method 1, another third was stained with method 2, and the final third was counterstained with cresyl violet.
Method 1 (nonfluorescent). Sections from the animals that had received BDA injections were sequentially processed for BDA histochemistry and NMDA receptor 1 (NMDAR1) subunit immunocytochemistry, using a two-color diaminobenzidine (DAB) protocol. As a result, nickel-intensified BDA label (blue-black precipitate) could be readily distinguished from the NMDAR1 staining revealed by the DAB reaction product (brown precipitate).
The cellular incorporation of BDA (or biocytin) was revealed using the avidin-biotin peroxidase complex method (Vector Laboratories). The tissue sections were incubated overnight at 4°C in the reagent solution under gentle agitation. The following day, they were rinsed in PBS and in distilled water. The peroxidase was visualized with a nickel-intensified DAB reaction to produce a dark blue-black reaction product. The sections were preincubated for 10 min in a mixture of DAB (0.0125%; Sigma), nickel-ammonium sulfate (0.25%; BDH Chemicals, Poole, UK), and imidazole (0.35%; Sigma) in PBS. Hydrogen peroxidase (Sigma) was then added to the DAB solution at a concentration of 0.02%, and the tissue was incubated for an additional 5-15 min. The reaction was stopped by three rinses in PBS.
For NR1 immunocytochemistry, the sections were preincubated for 1 hr in 5% normal goat serum (NGS) (Vector Laboratories) and then further incubated in a mouse monoclonal primary antibody (1:500 or 1:600 with 1% NGS; clone 54.1; PharMingen, San Diego, CA) for 48 hr at 4°C. The specificity of this primary antibody for brain tissue has been demonstrated in several species, including adult and young ferrets (Catalano et al., 1997). The sections were washed in PBS and processed using horseradish peroxidase-conjugated goat anti-mouse IgG (Jackson ImmunoResearch, West Grove, PA). They were then rinsed, reacted in DAB to produce a brown precipitate, mounted, and cleared.
Method 2 (fluorescent). Retrogradely transported BDA was visualized using indirect tyramide amplification and streptavidincyanine 5 fluorochrome (Cy5) (mouse; Jackson ImmunoResearch). Sections were incubated overnight in streptavidin-conjugated peroxidase (NEN Life Sciences, Boston, MA) diluted 1:500 in PBS, followed by washing in PBS and incubation in tyramide blocking buffer (NEN Life Sciences) for 1 hr. Sections were next placed into biotinylated tyramide (NEN Life Sciences), diluted 1:100, for 10 min and then washed in PBS. Finally, sections were incubated overnight in streptavidin-Cy5 (Jackson ImmunoResearch). After washing, NR1 immunofluorescence was begun by incubating sections for 48 hr in anti-NR1 (PharMingen) (diluted 1:300 in PBS). The sections were then washed in PBS and incubated for 3 hr in goat anti-mouse conjugated cyanine 2 (Cy2) (Jackson ImmunoResearch) diluted 1:300, washed, incubated in sheep anti-goat Cy2 for 3 hr, and finally washed again. Sections were mounted onto gelatin-subbed slides, air-dried, dehydrated, cleared in methylsalicylate, and mounted in DPX resin (BDH, Poole, UK).
Imaging of fluorescent staining was done using a scanning confocal microscope (Leica, Wetzlar, Germany) equipped with an air-cooled krypton-argon laser. Cy2 fluorescence and Cy5 were scanned sequentially using the 488 and 647 nm excitation lines, respectively. Because both excitation and emission spectra were well segregated, no bleed-through between the channels was observed in material stained singly for NR1 using Cy2 or BDA using Cy5. Two control experiments were performed for nonspecific staining: (1) reversal of the staining protocol (i.e., the NR1 immunofluorescence was performed before the BDA visualization) and (2) omission of the primary antiserum and replacement by preimmune serum. In (1), the staining pattern remained identical to that seen before; in (2), all of the Cy2 fluorescence was lost, indicating that no cross-reaction occurred between the BDA and NR1 visualization methods. Sections were kept in their rostrocaudal sequence; one of the first five was chosen as a random starting point, and every sixth section after that was used for counting labeled cells.
Projections from the sSC onto dSC cells immunoreactive for the NR1 subunit. In two adult ferrets, BDA was injected into the sSC and combined with NR1 immunocytochemistry. Injections of BDA were made by iontophoresis, as described by Doubell et al. (2000). The brains were also processed for NR1 immunoreactivity using method 1.
Projections from the sSC onto crossed tectoreticulospinal neurons. Another six adult ferrets were used in experiments in which two tracers were injected into the midbrain. BDA was injected into the left sSC and combined with 10 kDa rhodamine dextran amine (RhDA) (Molecular Probes) injections into the reticular formation. BDA injections were made as before in the sSC, and RhDA (500 nl; 10% in saline) was injected as described above into the right reticular formation.
Four of these animals were processed for light microscopy. Briefly, they were terminally anesthetized and perfused with 4% paraformaldehyde before their brains were removed, blocked, cryoprotected, and sectioned on a freezing microtome. The remaining two animals were used for electron microscopy (EM) and were perfused with PBS, followed by 4% paraformaldehyde plus 0.5% glutaraldehyde. After postfixing overnight at 4°C, the blocked midbrain was embedded in agar (5% in saline) and sectioned on a vibratome (Ted Pella, Redding, CA).
The cellular incorporation of BDA was revealed using the avidin-biotin peroxidase complex method (Vector Laboratories) as described in method 1. These sections were next stained for RhDA immunocytochemistry. After BDA staining, sections were first blocked for 1 hr in 5% NGS (Vector Laboratories) and then incubated in a rabbit polyclonal primary antibody against rhodamine (1:12,000 with 1% NGS; Molecular Probes) for 24 hr at 4°C. Next, the sections were washed in PBS and put into the secondary goat anti-rabbit antibody conjugated to HRP (1:200 in PBS; Vector Laboratories) for 3 hr at room temperature. After washing in PBS, the sections were reacted in diaminobenzidine (0.5 mg/ml; Sigma) and hydrogen peroxide (0.003%; Sigma). Sections for light microscopy were mounted onto gelatin-subbed slides and left to air-dry overnight. Next, sections were dehydrated through graded alcohols, followed by clearing in xylene and coverslipping.
Sections for EM were washed thoroughly and incubated in 1% osmium tetroxide (Agar Scientific, Stansted, Essex, UK) in 0.1 m phosphate buffer for 10 min. After several washes in 0.1 m phosphate buffer, sections were dehydrated through a series of graded alcohols (including 70% alcohol with 1% uranyl acetate) and infiltrated with a 50/50 araldite-propylene oxide overnight and three changes through araldite resin (Agar Scientific). Finally, sections were flat-mounted onto glass slides covered in resin, coverslipped with a small piece of acetate sheet, and polymerized for 48 hr at 60°C in an oven.
Under the light microscope, areas of embedded SC were cut out with a scalpel blade and carefully glued flat onto araldite stubs. Ultrathin sections were cut parallel to the original coronal plane of cutting with a diamond knife (Diatome, Biel, Switzerland) and mounted on formvar (Agar Scientific)-coated slot grids. Sections were analyzed on an electron microscope (JEOL, Welwyn Garden City, UK).
Results
Interlaminar connections of the superior colliculus in neonatal ferrets
The organization of the descending projection from the sSC and the relationship of these axons to neurons that provide the main contralateral efferent pathway from the dSC were examined during the first postnatal month using carbocyanine dye tracing in fixed tissue.
Placement of the DiI on the posterior tegmental commissure of P0 ferrets labeled a large wedge-shaped area of dSC cells, with the majority located in the presumptive layer IV (Fig. 1A,B). Smaller numbers of cells were found scattered in the remaining deeper layers, but no labeling was found in the sSC. Crystals of DiAsp applied to the pial surface of the SC on P0 stained dorsoventrally oriented bands of fibers that extended across the entire thickness of the SC, from the pial to the ventricular surfaces (Fig. 1C,D). These fibers comprised at least two components, one of which consisted of the processes of radial glial cells, which were closely intermeshed with axons descending from the sSC. Individual radial glial fibers, which closely resembled those reported by Voigt (1989), using similar methods in ferret cortex, could sometimes be seen. The labeled axon tract clearly separated from the glial fibers in the intermediate layers of the SC to head laterally, following the same trajectory as the descending ipsilateral pathway from the sSC in adult ferrets (Doubell et al., 2000).
Figure 1.

Superior colliculus connections in infant ferrets. Coronal sections through the SC taken from a P4 ferret in which DiI was placed in the posterior tegmental commissure to label predorsal bundle cells, and DiAsp was placed in the superficial layers of the SC. A, B, Low- and high-power views under the rhodamine filter, respectively, showing retrogradely labeled predorsal bundle axons (arrow) and projection neuron somata (arrowheads) in deep SC. Viewing the same section (C) and an adjacent one (D) with the fluorescein filter, axons can be seen projecting ventrally from the superficial to the deeper layers, with some turning laterally (arrow) to head toward the nucleus of the brachium of the inferior colliculus and the parabigeminal nucleus. Radial glial fibers span the entire width from the pial to ventricular surface (arrowheads). Scale bar: (in C) A, C, D, 100 μm; B, 50 μm. The dashed line in A indicates the borders between the sSC and the dSC.
After P18, the glial bridges began to break up and disappear, leaving only the descending axon pathways. Figure 2 shows that, by P20, axons emerging from dye placed in the sSC are oriented ventrally. When DiI and DiAsp crystals were placed adjacent to each other within the sSC in either the mediolateral or rostrocaudal planes, two separate descending streams of axons that projected into the dSC were labeled. These results indicate that topographic order exists in the superficial- to-deep projection even before the onset of sensory function.
Figure 2.

Superficial- to deep-layer connections in infant ferrets. A, Low-power epifluorescent micrograph of coronal sections of the SC from a P20 ferret. Micrographs taken with the rhodamine filter have been digitally superimposed on images photographed using the fluorescein filter. Crystals of DiI and DiAsp were placed adjacent to each other in the mediolateral plane. Asterisks mark the location of the crystals in the superficial layers of the SC, and the dotted line indicates the midpoint between them. The dashed line indicates the presumptive border between sSC and dSC. B, High-power view of an adjacent section showing bundles of fibers emerging from the dye placement sites in the superficial SC and heading into the deeper layers perpendicular to the pial surface. Red and green fibers appear to descend separately, indicating that some topographic order is already present. Within the superficial layers, some fibers run parallel to the pial surface, appearing yellow in areas of overlap. Scale bars: A, 100 μm; B,50 μm.
EPSPs evoked by sSC stimulation in dSC neurons in juvenile ferrets
The central aim of the in vitro slice recordings was to obtain a more direct estimate of the functional connectivity between the sSC and the dSC in juvenile ferrets at approximately the age at which the first sensory responses can be recorded. More specifically, we wanted to find out the following: (1) the degree to which the two regions are connected directly (i.e., via monosynaptic connections), (2) the spatial extent of these functional connections, indicating the degree of local topography present, and (3) the excitatory and/or inhibitory nature of these inputs.
Whole-cell recordings were made from 25 cells in the dSC of seven young ferrets (P25-P30). The eyelids were still shut in each case. Nearly all of the recorded cells (24 of 25) had tonic, partially adapting firing patterns in response to somatic current injections, whereas the remaining 1 cell exhibited a very prominent bursting pattern. Electrical stimulation was applied through a θ-glass electrode (tip diameter, 50-100 μm) to the sSC dorsal to the recorded cell along an imaginary arc aligned on layer II and/or III (Fig. 3A). If no response was evoked, the stimulating electrode was moved to another position. Often shifts in the position of the stimulating electrode by <100 μm revealed a response where none was present before, indicating that our method and intensity of stimulation were sensitive, and that the stimulating current did not spread more than ∼50 μm around the θ electrode. Similarly, such small shifts in the position of the stimulating electrode resulted in different response patterns (Fig. 3B-F), suggesting that distinct groups of neurons were being activated in each case.
Figure 3.

Stimulation of the superficial layers evokes EPSPs in deep-layer neurons in juvenile ferrets. A, Schematic drawing of a midbrain slice cut in the coronal plane, indicating the positions of the recording electrode in layer IV situated close to the border between sSC and dSC (dashed line) and the stimulating electrode in the superficial layers (sSC). The nucleus of the brachium of the inferior colliculus (nBIC) is indicated by the dashed oval. The stimulating electrode was initially placed at position 1 and subsequently moved to position 2. B, Mean responses recorded from a layer IV cell after stimulation at sites 1 and 2. C, Examples of responses evoked from stimulation site 1. Two groups of traces can be distinguished, one with longer and one with shorter latency. This is better illustrated in D, in which latencies for each evoked response are plotted sequentially. Electrical stimulation at this location appeared to excite two sets of inputs, one with an average latency of 9 msec and a second with an average latency of ∼13 msec. Moving the θ electrode to the nearby stimulation site 2 in the sSC revealed a different set of inputs (E) with an average latency of ∼7 msec (F). Note that the response with the shorter latency (F) has a greater latency variability than the response with the longer latency (faster of the two components in D).
For most of the recorded neurons, subsequent histological reconstruction confirmed the location of the cell body, although not always the detailed morphology of the dendritic arborizations. Figure 4 indicates the laminar location of the cell bodies for the 11 recorded neurons for which we were able to obtain adequate histology. The majority (9 of 11) were located in layer IV, whereas the remaining 2 neurons had cell bodies in the top part of layer VI.
Figure 4.

Laminar location of biocytin-filled dSC neurons from which EPSPs were recorded after stimulation of the superficial layers. A, Camera lucida drawing of a Nissl-stained section, showing the location of 11 recorded neurons whose morphology was subsequently reconstructed and of the SC layers (I&II, III-VII). nBIC, Nucleus of the brachium of the inferior colliculus. B, Example of a biocytin-filled neuron that was located in layer IV. Scale bars: A, 250 μm; B,6 μm.
Of the 25 dSC cells recorded, 20 manifested depolarizing postsynaptic connections in response to electrical stimulation of the superficial layers. We examined the latency values and variability of the responses to determine what proportion of these arose from direct, monosynaptic connections. Estimates of response latency for each stimulation site were based on the average latency of 30-50 EPSPs. In those cases in which responses were recorded from more than one stimulation site, the site with the shortest latency was included in the average population data, because this would be the most likely to represent monosynaptic connections.
Average response latencies ranged from 4.4 to 14.8 msec (mean ± SD, 7.3 ± 2.4), similar to the range reported by Isa et al. (1998) in their studies of rat SC. Several peaks were evident in the distribution of response latency and latency variability, possibly reflecting a combination of monosynaptic and disynaptic or polysynaptic components (Fig. 5A,B). However, we found that the mean latency values did not correlate in any simple way with the latency variability of evoked responses (Fig. 5C). Short latency responses (<6 msec) tended to have low jitter (≤2 msec) and low SD (≤1), but above this range, the correlation was poor, possibly reflecting variability in the degree of myelination of the immature fibers. For this reason, a connection was judged to be monosynaptic if either the average latency of 30-50 evoked EPSPs was ≤6 msec, or, for response latencies of >6 msec, if the jitter and SD of the latency were within 2 and 1 msec, respectively. The cutoff value of 6 msec was chosen for the following two reasons: (1) using both latency variability measures, it represented the limit beyond which the relationship between latency variability and mean latency was no longer linear, and (2) it was consistent with the range for monosynaptic connections reported previously (Isa et al., 1998). We further tested the monosynaptic nature of these inputs by paired-pulse stimulation of the sSC at an interval of 50 msec. The components of the EPSPs that were designated as monosynaptic according to the above criteria typically responded to both stimulation pulses with a stable latency, whereas polysynaptic components gave reduced responses or showed greater latency variability.
Figure 5.
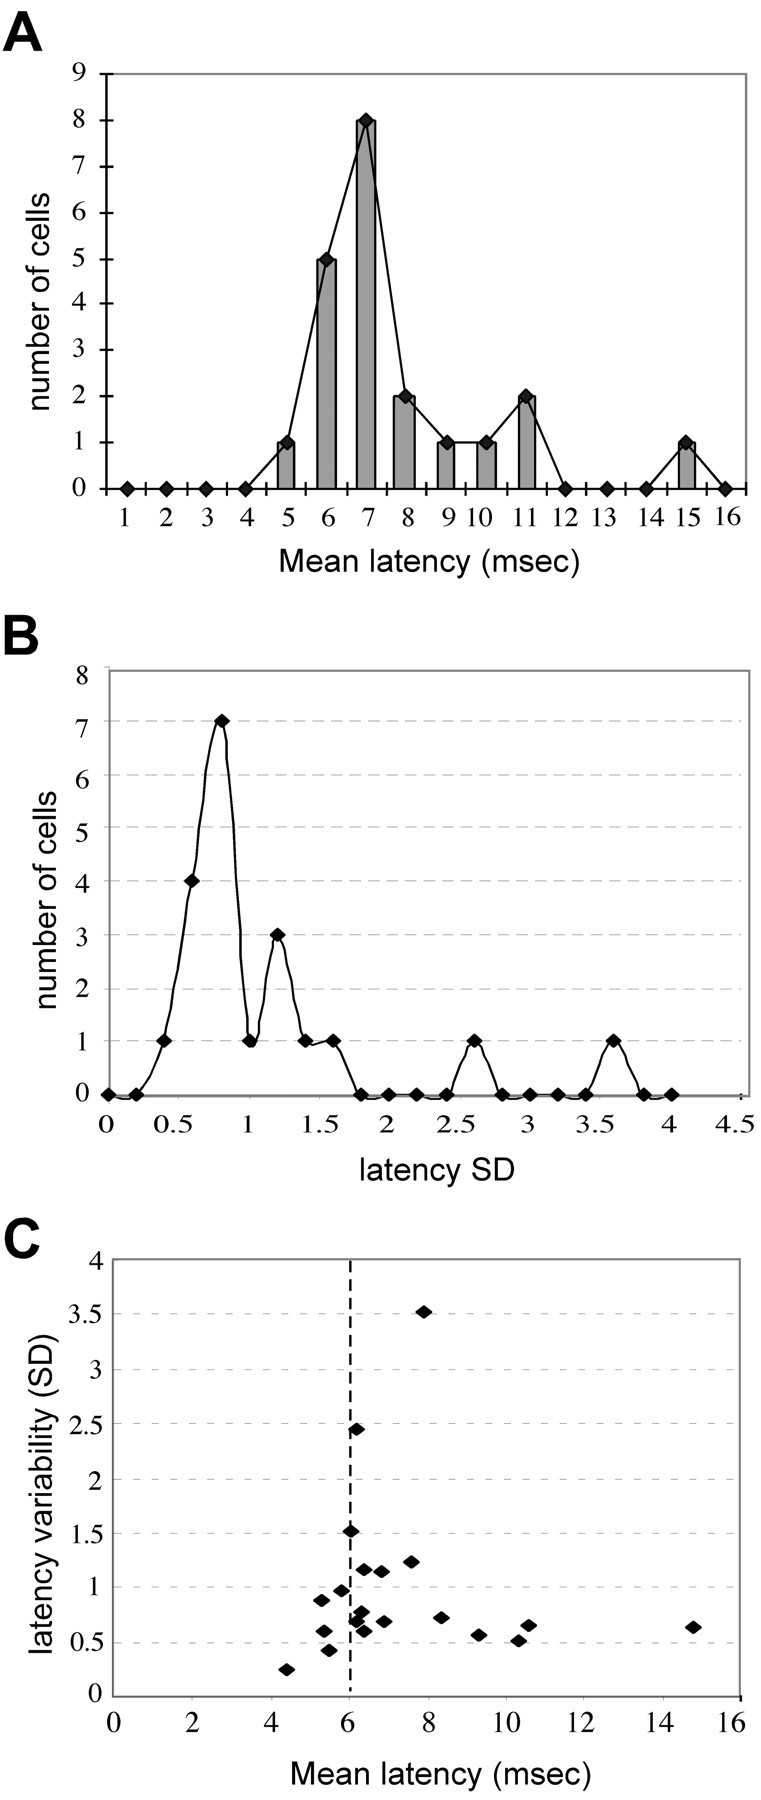
Latency characteristics of EPSPs evoked in deep SC neurons by stimulation of the superficial layers. A, Distribution of response latencies for all of the recorded dSC neurons. Values represent the average latency of 30-50 EPSPs evoked in response to electrical stimulation in the sSC. B, Distribution of the SD of the response latencies of all of the recorded dSC neurons. C, Comparison of mean latency and latency SD of each evoked response. Dashed line denotes 6 msec latency.
On the basis of this analysis, 13 of 20 cells recorded in the dSC were adjudged to receive direct, monosynaptic connections from the sSC. Histological reconstruction was possible for 6 of these 13 neurons, and, in each case, the cell bodies were located in layer IV, in keeping with the electrophysiological data of Lee et al. (1997) and Isa et al. (1998). It should be noted that these values represent a conservative estimate of the incidence of direct connectivity, because the likelihood of detecting monosynaptic inputs increased with the number of stimulation locations tried.
This prompted us to look more carefully at the functional topography of these inputs. For four dSC cells from which whole-cell recordings were made, the θ stimulating electrode was moved systematically within the sSC to determine the area from which responses could be evoked. Figure 6 shows examples of three of the maps obtained, in which open circles indicate sites where stimulation was applied, but no response was evoked, and gray and black-filled circles indicate locations from which identical stimulation conditions elicited polysynaptic and monosynaptic responses, respectively. Such maps reveal that dSC cells receive direct inputs from a fairly restricted area within the superficial layers, ranging from 70 to 490 μm (mean horizontal distance, 225 μm).
Figure 6.
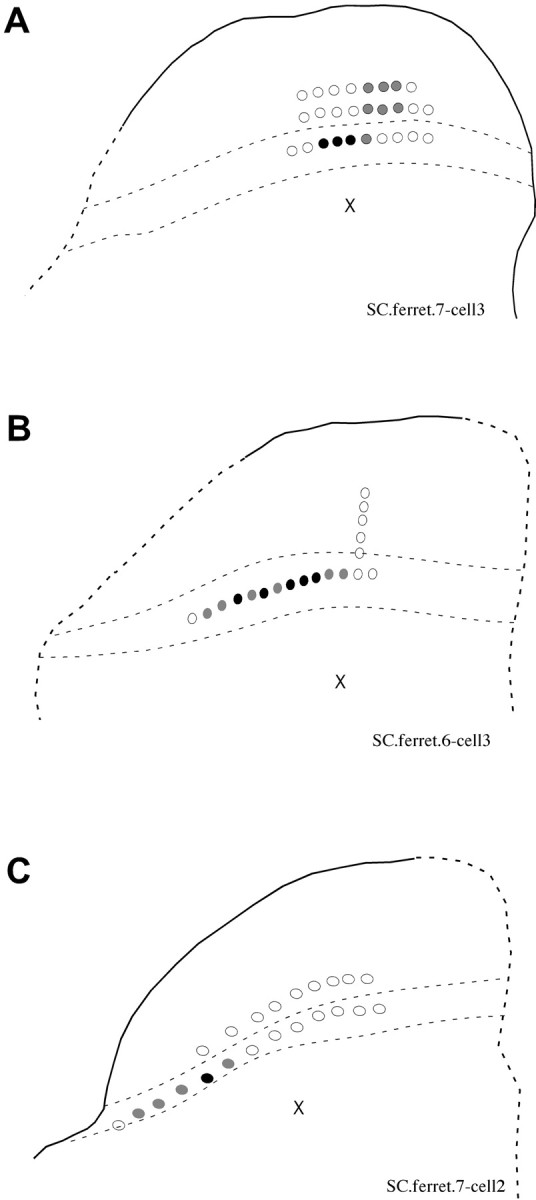
Functional topography of superficial- to deep-layer connections. The θ-stimulating electrode was moved systematically within the sSC to assess the presence of functional connections between the layers. Black crosses indicate the location of the recorded cells. Open circles indicate sites at which stimulation was applied but no response was evoked, and gray- and black-filled circles indicate locations from which polysynaptic and monosynaptic responses were elicited, respectively. The light dashed lines indicate the position of layer III, and the dark dashed lines indicate the borders of the SC. The size of the stimulating electrode and the stimulus intensity were the same for all of the sites. Data from three experiments are shown (A-C).
We also examined the excitatory-inhibitory nature of these inputs. In normal extracellular recording solution, we found that electrical stimulation of the sSC always evoked depolarizing postsynaptic potentials. These were glutamatergic, because they were nearly completely blocked with the non-NMDA antagonist CNQX (data not shown). However, when the postsynaptic cell was depolarized away from the chloride equilibrium potential, hyperpolarizing responses were revealed. In none of these cases were such IPSPs found to be monosynaptic.
Interlaminar connections of the superior colliculus in adult ferrets
We examined whether the superficial- to deep-layer topography observed in the dye labeling and whole-cell recordings in young ferrets was maintained into adulthood, as has been shown in other species. In two adult animals, we analyzed the interlaminar pathway by making single injections of biocytin into the sSC (Fig. 7). In both cases, injection sites were restricted to layers I-III (Fig. 7A,B). Axons and terminal boutons were found in the adjacent regions of the sSC as well as in the intermediate and deep layers of the SC. The highest density of terminal staining was found ventral to the injection site, indicating that, as in young ferrets, this projection continues to be organized topographically in the dorsoventral dimension (Fig. 7C,D). However, terminal labeling did extend to other regions of the sSC, showing that interlaminar SC connections are actually quite widespread. Plan projections maps were constructed of both the injection sites in the sSC and the main terminal zones in layer IV (Fig. 8). These revealed extensive overlap between the injection sites and the zone of terminal labeling in the dorsoventral dimension, confirming that the sSC-dSC projection is topographically organized within the boundaries of the SC.
Figure 7.

Superficial- to deep-layer connections in adult ferrets. Distribution of biocytin-labeled axons and terminals after single injections into the sSC. A, B, Injection sites from two animals. C, Series of sections from one animal (injection site A) in which light gray shading depicts areas containing boutons, and black stippling indicates axons. Three section drawings (asterisks) are shown at higher power in D. The border between sSC and dSC is shown by the dashed lines. Scale bar: (in D) A-C, 200 μm; D, 100 μm.
Figure 8.
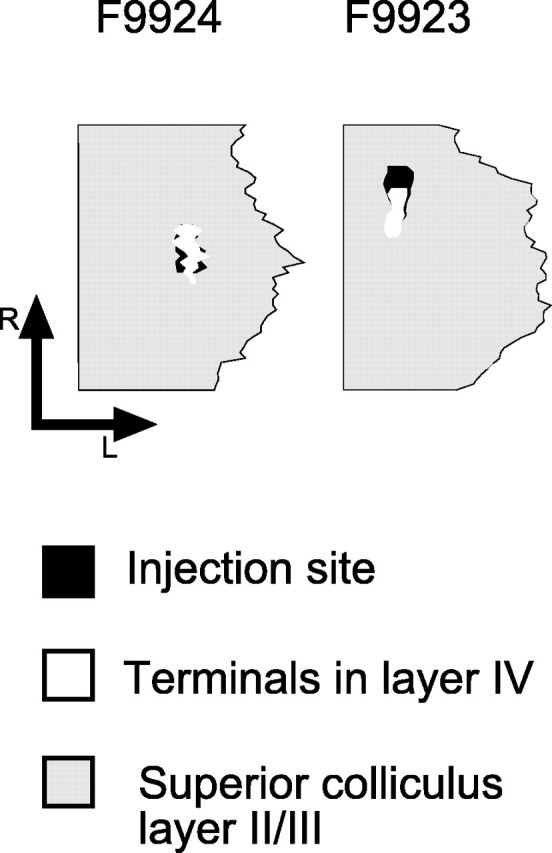
Plan projection of the superior colliculus (shaded gray) in two adult ferrets (numbers F9924 and F9923) in which single biocytin injections were made in the superficial layers. The horizontal extent of the injection site (black regions) and of the main foci of terminal labeling in layer IV (white regions) are shown. R, Rostral; L, lateral.
Retrograde labeling of tectoreticulospinal neurons combined with NR1 immunocytochemistry
To determine whether sSC axons terminate on dSC projection neurons that transmit motor commands for controlling orienting movements, we labeled tectoreticulospinal neurons whose axons form the predorsal bundle. In other species, both contralateral and ipsilateral descending efferent neurons often receive converging multisensory inputs (Meredith et al., 1992; Wallace et al., 1996). Because NMDA receptors have been implicated in both the response enhancement that can be observed when different sensory cues are presented together (Binns and Salt, 1996) and in the activity-dependent processes that align the receptive fields for different sensory modalities during development (Schnupp et al., 1995), we examined whether tectoreticulospinal neurons and NMDA receptors are colocalized in the dSC.
We made unilateral injections of BDA into the predorsal bundle at the level of the pons to retrogradely label projection neurons in the SC (Fig. 9). Most of these back-filled neurons were labeled in a Golgi-like manner and were located in layer IV with some in layer VI (Fig. 9A). Retrogradely labeled axons could be seen crossing the midbrain from the predorsal bundle into the posterior tegmental decussation, in bundles that headed around the periaqueductal gray (PAG) into the deeper layers of the contralateral SC. In layers VI and VII, these axons turned abruptly to head dorsally toward their target cell bodies.
Figure 9.
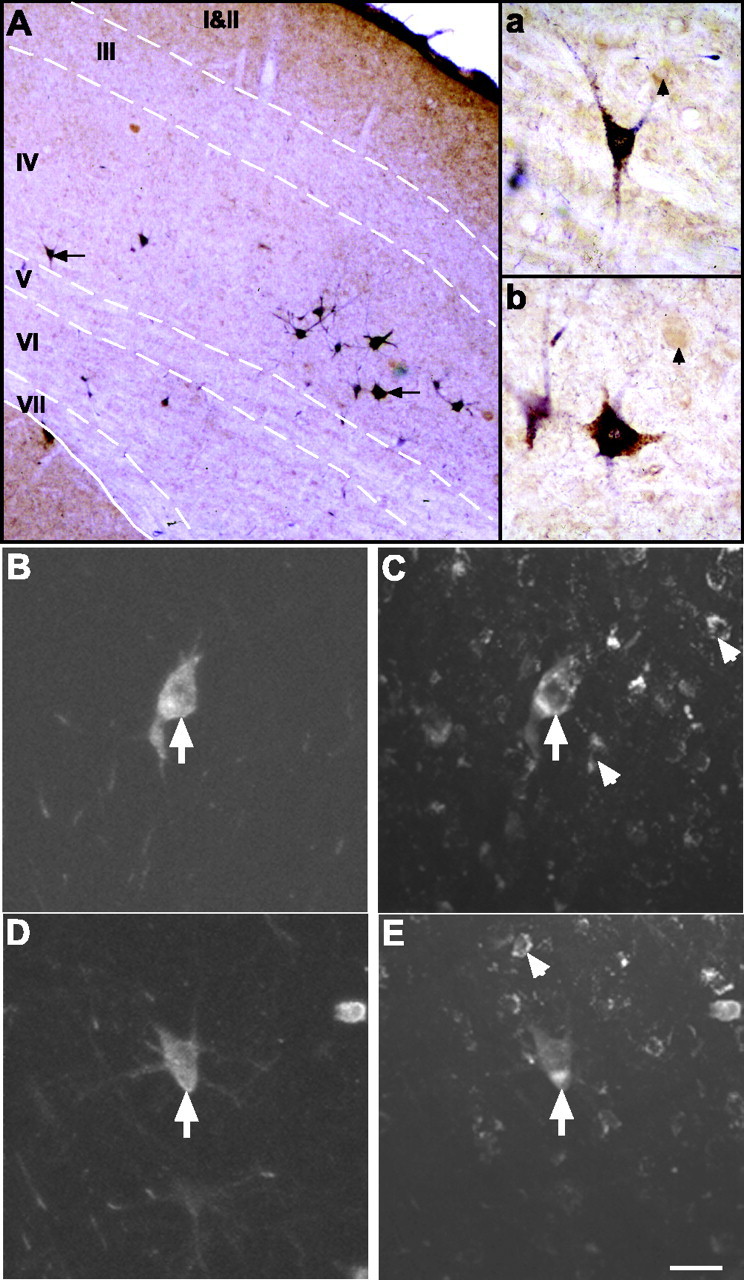
Double labeling of superior colliculus projection neurons. A, Injections of BDA into the tectoreticulospinal tract produced retrograde labeling in many medium and large multipolar neurons (arrows) located predominantly in layers IV and VI of the contralateral SC (dark-blue reaction product). The dashed lines indicate the layer borders. Double labeling with NR1 immunocytochemistry (brown reaction product) revealed that many of these tectoreticulospinal projection neurons expressed the NR1 subunit of the NMDA receptor. The two double-labeled cells indicated by the arrows are shown at higher power in the insets a and b. The arrowheads in a and b depict single-labeled NR1 cells. B-E, Confocal microscope images showing retrogradely labeled tectoreticulospinal neurons visualized with Cy5 (B and D) and, for the same fields of view, NR1 immunofluorescence visualized with Cy2 (E and F). Each image represents a projected maximum series of 16 focal planes spaced at 1 μm intervals. The BDA-labeled SC neurons marked by the arrows in B and D also show punctate, perinuclear NR1 immunofluorescence (arrows in C and E, respectively). The arrowheads in C and E indicate single-labeled NR1 cells. Scale bar: (in E) A, 75 μm; B-E, 20 μm.
Double labeling of tectoreticulospinal neurons revealed that many express NR1 subunit immunoreactivity. However, in some circumstances when the tectoreticulospinal neurons were heavily stained with BDA, it was impossible to tell whether they were also labeled for NR1 immunoreactivity. We therefore adapted a double fluorescence procedure to identify unequivocally single- or double-labeled neurons. In initial experiments, BDA labeled with fluorescent streptavidin-Cy5 conjugate proved undetectable in retrogradely labeled cells. However, using a tyramide amplification technique before the final streptavidin-Cy5 detection, we were able to enhance the signal so that retrogradely labeled neurons could easily be detected with the fluorescence microscope (Fig. 9B-E). By combining fluorescent tyramide detection of BDA with NR1 immunofluorescence, we found that 90% (mean ± SD, 560 ± 293 of a total of 620 ± 327; n = 2 ferrets) of retrogradely labeled tectoreticulospinal neurons were double labeled for the NR1 subunit of the NMDA receptor.
Superficial layer inputs to deep-layer projection neurons
Having shown that most labeled tectoreticulospinal neurons express NMDA receptors, we set out to determine whether they receive synaptic contacts from the sSC. To do this, we used two different double-labeling paradigms in conjunction with light- and electron-microscopic analysis.
After BDA injections into the sSC and subsequent staining to reveal both BDA and NR1 subunit immunoreactivity, we found many NR1-positive cells in the dSC in close apposition with axon terminals (Fig. 10). These mostly comprised medium-large multipolar neurons in layer IV. The pattern of terminal apposition was highly stereotyped, usually being characterized by multiple boutons in contact with the proximal part of the dendrite and sometimes a few boutons on the soma. Axons sometimes formed more complex appositions with either a ribbon of terminals along the dendrite (Fig. 10D) or a basket-like structure enclosing the dendritic shaft (E,F).
Figure 10.
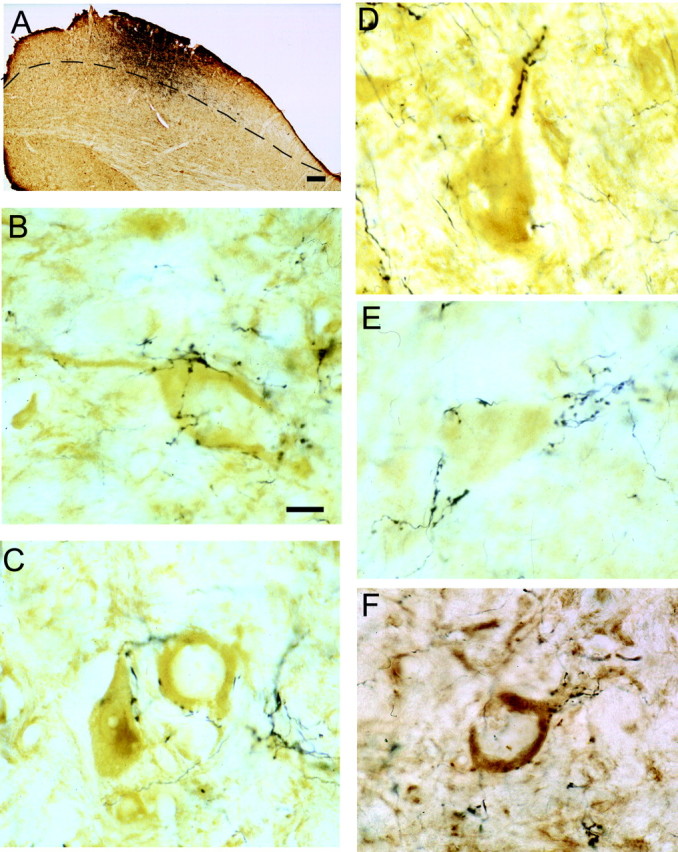
Superficial-layer neurons project onto NR1-immunoreactive neurons in the deeper layers of the superior colliculus. A, BDA injection site in the sSC (the borders between the sSC and dSC are shown by the dashed line). B-F, Layer IV neurons that are strongly immunopositive for the NR1 subunit of the NMDA receptor (brown) are contacted on the soma or proximal dendrite by axons with numerous varicosities (black). Scale bars: A, 50 μm; (in B) B-F,20 μm.
Using a similar approach, we were also able to find RhDA retrogradely labeled tectoreticulospinal neurons in close apposition with BDA-filled axon terminals originating from the sSC (Fig. 11). As before, the labeled tectoreticulospinal cells were primarily layer IV multipolar neurons. These neurons had boutons located on their proximal dendritic shafts and, to a lesser degree, on the soma, which resembled the sSC contacts, described above, onto NR1-positive dSC neurons. We examined a subset of these contacts (five areas containing one or more back-filled tectoreticulospinal cells with labeled boutons on their soma and/or proximal dendrite) at the electron-microscopic level (Fig. 12). The electron-microscopic analysis revealed that all of the boutons sectioned contained mitochondria and predominantly round synaptic vesicles, with most having at least one active zone with asymmetric synaptic thickenings (Fig. 12C-E), indicating the presence of excitatory synapses.
Figure 11.
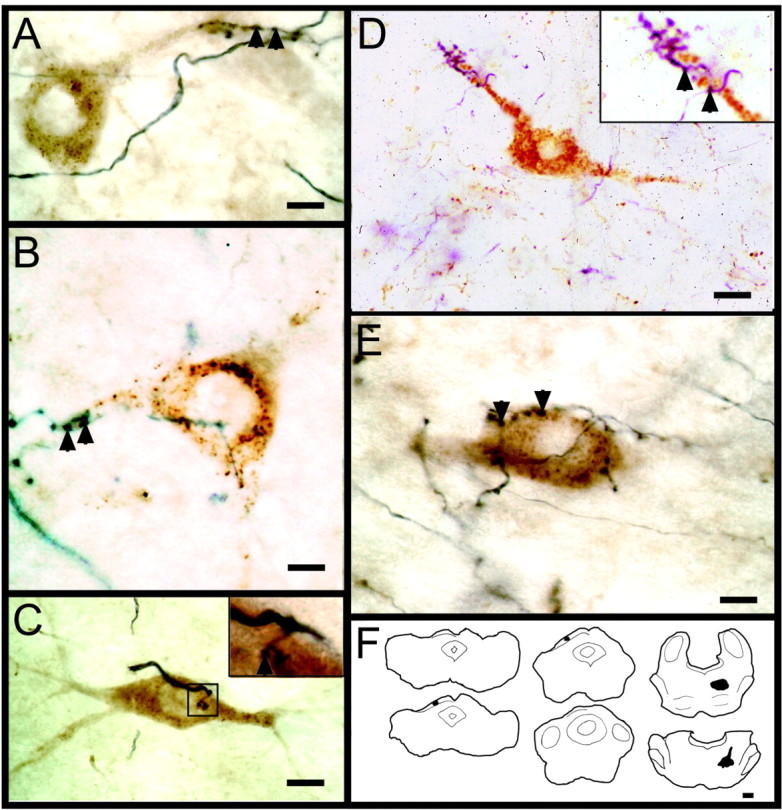
Superficial-layer neurons project onto tectoreticulospinal projection neurons in the deeper layers of the superior colliculus. A-E, Photomicrographs of tectoreticulospinal neurons receiving axonal connections from the sSC; the insets show high-power views of terminal boutons in contact with each cell. Arrowheads indicate terminal boutons. F, The BDA injection site in the sSC and the RhDA injection site in the reticular formation are shown for one animal. Scale bars: A, B, E, 5 μm; C, 10 μm; D, 15 μm; F, 450 μm.
Figure 12.
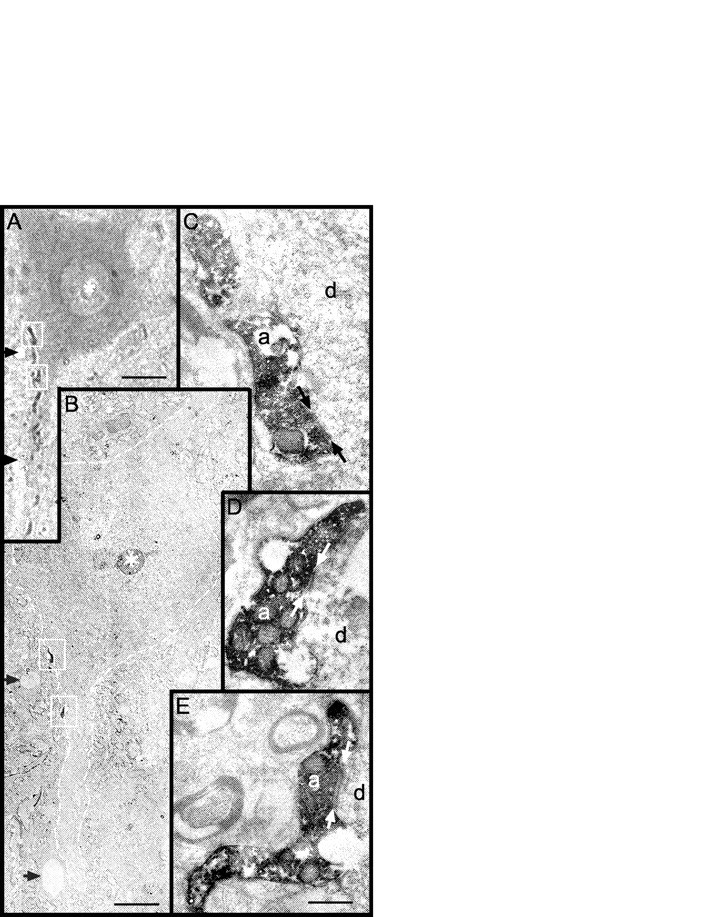
EM of superficial-layer synaptic contacts onto a deep-layer tectoreticulospinal neuron. A, High-power light micrograph of a tectoreticulospinal cell retrogradely labeled with RhDA, also shown in the low-power electron micrograph in B. In B, the outline of the neuron is indicated by the dashed line. The asterisk and arrows indicate the nucleolus and blood vessels present in both A and B, respectively. At the light-microscopic level, BDA-labeled boutons can be seen making multiple contacts on the dendrite of the tectoreticulospinal cell (A); the boxes indicate the same boutons present in thin section at the EM level (B). At the EM level, the boutons contain heavy BDA immunoprecipitate, whereas the tectoreticulospinal cell is only lightly labeled. Higher magnification electron micrographs of the boutons in the top and bottom boxes are shown in C and D-E, respectively. These boutons (a) contain mitochondria and round vesicles and make asymmetric synaptic contacts (arrows) with the dendrite (d) of the tectoreticulospinal cell. Scale bars: A, 15 μm; B, 2 μm; (in E) C-E, 0.3 μm.
Discussion
The existence of intrinsic connections between the superficial and deeper layers of the SC is central to models of how visual signals influence both the alignment of multisensory maps (King et al., 1998; Hyde and Knudsen, 2002) and the motor-related activity of deeper layer neurons (Schiller and Stryker, 1972; Mohler and Wurtz, 1976; Isa, 2002). In this study, we used a combination of anatomical and electrophysiological techniques to show that excitatory projections from the ferret sSC terminate in a columnar manner on, among others, large multipolar neurons that provide one of the major output pathways to the contralateral brainstem. This therefore provides a direct route by which visual signals may contribute to the activity of neurons involved in the control of orienting movements of the eyes and head. We also found that the superficial- to deep-layer projection is topographically organized and capable of evoking excitatory synaptic currents at a developmental stage that precedes the onset of sensory function in the SC, indicating that a neural substrate exists by which topographically organized visual signals could influence the maturation of other sensory inputs to this nucleus.
Inputs to premotor circuitry
Topographically organized projections from the sSC to the dSC have been demonstrated in several other species (Grantyn et al., 1984; Moschovakis et al., 1988; Rhoades et al., 1989; Behan and Appell, 1992; Lee and Hall, 1995; Hall and Lee, 1997). After anterograde tracer injections in the sSC, individual labeled axons that descend ventrally, before turning laterally to course toward the nucleus of the brachium of the inferior colliculus and the parabigeminal nucleus (Moschovakis et al., 1988; Doubell et al., 2000), can be observed. These axons give off terminals within the dSC that, although concentrated in the region ventral to the injection site, are quite widely distributed in the horizontal plane.
Until recently, very little was known about the physiological properties of these interlaminar connections. However, whole-cell patch-clamp recordings have now been made from SC neurons in slice preparations obtained from young mammals. In keeping with our own findings, others (Lee et al., 1997; Isa et al., 1998) have reported that stimulation of the sSC evokes postsynaptic currents in intermediate-layer neurons. These currents are predominantly excitatory and include both monosynaptic and polysynaptic components. By varying the location of the stimulating electrode, we found that the intermediate-layer neurons were activated from a restricted region of the superficial layers. This is in qualitative agreement with data obtained from tree shrew slices (Lee et al., 1997), showing that the functional connections between these layers are arranged in a columnar manner. In fact, our present slice data indicate that the superficial-to-deep topography is approximately threefold finer in ferrets (<1 mm, as opposed to up to 3 mm in tree shrews) and that direct (monosynaptic) inputs rarely exceed 0.5 mm in the mediolateral dimension.
Some authors have interpreted these interlaminar links as a route by which visual activity in the sSC might access the dSC premotor neurons. In support of this, Özen et al. (2000) noted that stimulation of the sSC in tree shrew slices can evoke prolonged bursts of EPSCs that, in turn, result in bursts of action potentials that resemble the premotor discharges evoked by intermediate-layer neurons in vivo. It has not been demonstrated that the recorded neurons are premotor, or that visually evoked activation of the sSC is capable of eliciting synaptic currents in dSC neurons in adult animals. However, simultaneous extracellular recordings between sSC and tectoreticulospinal neurons in adult cats indicate that many of these cells are functionally connected and have overlapping visual receptive fields (Chabli et al., 2000).
Our anatomical data from adult ferrets support and extend these findings by showing that at least part of the topographically organized descending projection from the sSC terminates on tectoreticulospinal neurons, which provide the bulk of the contralateral descending pathway to brainstem areas involved in the control of orienting movements (Huerta and Harting, 1984; Redgrave et al., 1986; Moschovakis et al., 1988; Guitton and Munoz, 1991; Meredith et al., 2001). Isa et al. (1998) demonstrated that the EPSPs generated by intermediate-layer neurons after electrical stimulation of the sSC in infant rat slices are mediated by AMPA and NMDA glutamate receptors. This is consistent with our observation that the majority of the tectoreticulospinal neurons in the intermediate layers express prominent NMDA NR1 immunoreactivity.
The interlaminar circuitry of the SC therefore provides a direct channel by which visual signals could pass from the sSC to the dSC to access projection neurons involved in the control of orienting behaviors. Attempts to demonstrate whether activity in the sSC is required for either the visual responses of dSC neurons (Schiller et al., 1974; Ogasawara et al., 1984; Mooney et al., 1992) or for visually guided behavior (Casagrande and Diamond, 1974; Mays and Sparks, 1980; Lomber et al., 2001) have produced conflicting results. However, recent studies suggest that the sSC-dSC pathway could provide a rapid route for delivering visual signals to premotor neurons during the execution of express saccades (Fischer and Boch, 1983; Edelman and Keller, 1996; Dorris et al., 1997), whereas the triggering of longer-latency, regular saccades may depend more on visual inputs to the dSC from extrastriate areas of the cortex (Isa, 2002). This is supported by the finding that signal transmission via the sSC-dSC pathway (Isa et al., 1998) and the occurrence of express saccades both appear to be gated by GABAergic and other modulatory inputs to the SC (Hikosaka and Wurtz, 1985; Aizawa et al., 1999).
Development of sensory map alignment in the superior colliculus
One of the characteristic features of the SC is that the sensory representations in both the sSC and dSC are topographically aligned (Stein et al., 1995). The registration of these maps enables each of the modality-specific cues associated with a common source to activate the appropriate region of the motor map for encoding orienting movements toward the source of stimulation. It also allows multisensory inputs to be synthesized by neurons in the dSC in a behaviorally useful way. In other words, different modality cues arising from a common source can lead to response enhancements, whereas spatially disparate stimuli tend to result in weaker responses (King and Palmer, 1985; Meredith and Stein, 1996).
In addition to their putative role in triggering orienting behavior, descending inputs from the sSC may contribute to the integrative properties of dSC cells by modulating the synaptic activity that results from converging inputs from multiple sensory modalities. In addition, superficial- to deep-layer connections appear to play a critical role in setting up and maintaining sensory map alignment in the SC. In particular, it is known that considerable plasticity exists in the developing auditory responses, and that the emergence of a map of auditory space is guided by visual cues (King, 1999). This is most clearly shown by experimentally altering the topography of the visual map in young animals, which can result in an adaptive shift in auditory spatial tuning that allows the maps of visual and auditory space to remain in register (King et al., 1988; Knudsen and Brainard, 1991).
Various models have been proposed to explain how instructive visual cues may guide the development of the auditory space map (Knudsen, 1994). Recent experiments suggest that the most likely model is that an early formed map of visual space is connected through an ordered set of connections to a bimodal integrator, where it provides an activity template against which auditory spatial tuning is matched. The source of the visual template appears to be the sSC. Experiments in which these layers were partially aspirated in neonatal ferrets indicate that they are necessary for the normal development of the auditory space map in the underlying dSC (King et al., 1998). Chronic application of NMDA receptor antagonists to the dorsal surface of the SC is also effective in disrupting auditory-map development while retaining a normal visual map in the sSC (Schnupp et al., 1995). These results are consistent with a functional role for the glutamatergic interlaminar pathway in establishing intersensory map alignment. Moreover, visually guided changes in auditory spatial tuning in the midbrain of the barn owl are prevented by lesioning the superficial layers of the optic tectum, which can be explained by a loss of visual feedback from the tectum to the site of plasticity in the external nucleus of the inferior colliculus (Hyde and Knudsen, 2002).
Retinocollicular inputs to the sSC are functionally and anatomically mature by the time of eye opening (Kao et al., 1994; King and Carlile, 1995; Wallace et al., 1997; Chalupa and Snider, 1998; King et al., 1998). The relative maturity of the visual map in these layers makes it well suited to provide accurate spatial information with which to supervise the construction of auditory and possibly other sensory representations in the dSC that develop over a more protracted period of development (Withington-Wray et al., 1990; King and Carlile, 1995; Wallace and Stein, 1997, 2001). We showed that the pathway linking the visual map in the sSC to neurons in the dSC is both functional and topographically restricted even before the onset of hearing and therefore is well placed to influence the development of auditory responses.
Footnotes
This work was supported by the Wellcome Trust. A.J.K. is a Wellcome Senior Research Fellow, and J.B. was a Wellcome Prize Student. We are grateful for help and advice on confocal microscopy from Dr. Richard Adams.
Correspondence should be addressed to Dr. Timothy P. Doubell, University Laboratory of Physiology, Parks Road, Oxford OX1 3PT, UK. E-mail: tim.doubell@physiol.ox.ac.uk.
J. Baron's present address: Max Planck Institute for Brain Research, Deutschordenstrasse 46, D-60528 Frankfurt/Main, Germany.
Copyright © 2003 Society for Neuroscience 0270-6474/03/236596-12$15.00/0
References
- Aizawa H, Kobayashi Y, Yamamoto M, Isa T ( 1999) Injection of nicotine into the superior colliculus facilitates occurrence of express saccades in monkeys. J Neurophysiol 82: 1642-1646. [DOI] [PubMed] [Google Scholar]
- Behan M, Appell PP ( 1992) Intrinsic circuitry in the cat superior colliculus: projections from the superficial layers. J Comp Neurol 315: 230-243. [DOI] [PubMed] [Google Scholar]
- Binns KE, Salt TE ( 1996) Importance of NMDA receptors for multimodal integration in the deep layers of the cat superior colliculus. J Neurophysiol 75: 920-930. [DOI] [PubMed] [Google Scholar]
- Casagrande VA, Diamond IT ( 1974) Ablation study of the superior colliculus in the tree shrew (Tupaia glis). J Comp Neurol 156: 207-238. [DOI] [PubMed] [Google Scholar]
- Catalano SM, Chang CK, Shatz CJ ( 1997) Activity-dependent regulation of NMDAR1 immunoreactivity in the developing visual cortex. J Neurosci 17: 8376-8390. [DOI] [PMC free article] [PubMed] [Google Scholar]
- Chabli A, Guitton D, Fortin S, Molotchnikoff S ( 2000) Cross-correlated and oscillatory visual responses of superficial-layer and tecto-reticular neurones in cat superior colliculus. Exp Brain Res 131: 44-56. [DOI] [PubMed] [Google Scholar]
- Chalupa LM, Snider CJ ( 1998) Topographic specificity in the retinocollicular projection of the developing ferret: an anterograde tracing study. J Comp Neurol 392: 35-47. [DOI] [PubMed] [Google Scholar]
- Dorris MC, Pare M, Munoz DP ( 1997) Neuronal activity in monkey superior colliculus related to the initiation of saccadic eye movements. J Neurosci 17: 8566-8579. [DOI] [PMC free article] [PubMed] [Google Scholar]
- Doubell TP, Baron J, Skaliora I, King AJ ( 2000) Topographical projection from the superior colliculus to the nucleus of the brachium of the inferior colliculus in the ferret: convergence of visual and auditory information. Eur J Neurosci 12: 4290-4308. [PubMed] [Google Scholar]
- Edelman JA, Keller EL ( 1996) Activity of visuomotor burst neurons in the superior colliculus accompanying express saccades. J Neurophysiol 76: 908-926. [DOI] [PubMed] [Google Scholar]
- Fischer B, Boch R ( 1983) Saccadic eye movements after extremely short reaction times in the monkey. Brain Res 260: 21-26. [DOI] [PubMed] [Google Scholar]
- Gordon B ( 1973) Receptive fields in deep layers of cat superior colliculus. J Neurophysiol 36: 157-178. [DOI] [PubMed] [Google Scholar]
- Grantyn R, Ludwig R, Eberhardt W ( 1984) Neurons of the superficial tectal gray. An intracellular HRP-study on the kitten superior colliculus in vitro. Exp Brain Res 55: 172-176. [DOI] [PubMed] [Google Scholar]
- Guitton D, Munoz DP ( 1991) Control of orienting gaze shifts by the tectoreticulospinal system in the head-free cat. I. Identification, localization, and effects of behavior on sensory responses. J Neurophysiol 66: 1605-1623. [DOI] [PubMed] [Google Scholar]
- Hall WC, Lee P ( 1997) Interlaminar connections of the superior colliculus in the tree shrew. III: The optic layer. Vis Neurosci 14: 647-661. [DOI] [PubMed] [Google Scholar]
- Hikosaka O, Wurtz RH ( 1985) Modification of saccadic eye movements by GABA-related substances. I. Effect of muscimol and bicuculline in monkey superior colliculus. J Neurophysiol 53: 266-291. [DOI] [PubMed] [Google Scholar]
- Huerta MF, Harting JK ( 1984) The mammalian superior colliculus: studies of its morphology and connections. In: Comparative neurology of the optic tectum (Venegas H, ed), pp 687-773. New York: Plenum.
- Hyde PS, Knudsen EI ( 2002) The optic tectum controls visually guided adaptive plasticity in the owl's auditory space map. Nature 415: 73-76. [DOI] [PubMed] [Google Scholar]
- Isa T ( 2002) Intrinsic processing in the mammalian superior colliculus. Curr Opin Neurobiol 12: 668-677. [DOI] [PubMed] [Google Scholar]
- Isa T, Endo T, Saito Y ( 1998) The visuo-motor pathway in the local circuit of the rat superior colliculus. J Neurosci 18: 8496-8504. [DOI] [PMC free article] [PubMed] [Google Scholar]
- Jiang X, Johnson RR, Burkhalter A ( 1993) Visualization of dendritic morphology of cortical projection neurons by retrograde axonal tracing. J Neurosci Methods 50: 45-60. [DOI] [PubMed] [Google Scholar]
- Kao C-Q, McHaffie JG, Meredith MA, Stein BE ( 1994) Functional development of a central visual map in cat. J Neurophysiol 72: 266-272. [DOI] [PubMed] [Google Scholar]
- King AJ ( 1999) Sensory experience and the formation of a computational map of auditory space. BioEssays 21: 900-911. [DOI] [PubMed] [Google Scholar]
- King AJ, Carlile S ( 1995) Neural coding for auditory space. In: The cognitive neurosciences (Gazzaniga MS, ed), pp 279-293. Cambridge, MA: MIT.
- King AJ, Palmer AR ( 1985) Integration of visual and auditory information in bimodal neurones in the guinea-pig superior colliculus. Exp Brain Res 60: 492-500. [DOI] [PubMed] [Google Scholar]
- King AJ, Hutchings ME, Moore DR, Blakemore C ( 1988) Developmental plasticity in the visual and auditory representations in the mammalian superior colliculus. Nature 332: 73-76. [DOI] [PubMed] [Google Scholar]
- King AJ, Schnupp JW, Thompson ID ( 1998) Signals from the superficial layers of the superior colliculus enable the development of the auditory space map in the deeper layers. J Neurosci 18: 9394-9408. [DOI] [PMC free article] [PubMed] [Google Scholar]
- Knudsen EI ( 1994) Supervised learning in the brain. J Neurosci 14: 3985-3997. [DOI] [PMC free article] [PubMed] [Google Scholar]
- Knudsen EI, Brainard MS ( 1991) Visual instruction of the neural map of auditory space in the developing optic tectum. Science 253: 85-87. [DOI] [PubMed] [Google Scholar]
- Lee P, Hall WC ( 1995) Interlaminar connections of the superior colliculus in the tree shrew. II: Projections from the superficial gray to the optic layer. Vis Neurosci 12: 573-588. [DOI] [PubMed] [Google Scholar]
- Lee PH, Helms MC, Augustine GJ, Hall WC ( 1997) Role of intrinsic circuitry in collicular sensorimotor integration. Proc Natl Acad Sci USA 94: 13299-13304. [DOI] [PMC free article] [PubMed] [Google Scholar]
- Lomber SG, Payne BR, Cornwell P ( 2001) Role of the superior colliculus in analyses of space: superficial and intermediate layer contributions to visual orienting, auditory orienting, and visuospatial discriminations during unilateral and bilateral deactivations. J Comp Neurol 441: 44-57. [DOI] [PubMed] [Google Scholar]
- Mays LE, Sparks DL ( 1980) Dissociation of visual and saccade-related responses in superior colliculus neurons. J Neurophysiol 43: 207-232. [DOI] [PubMed] [Google Scholar]
- Meredith MA, Stein BE ( 1996) Spatial determinants of multisensory integration in cat superior colliculus neurons. J Neurophysiol 75: 1843-1857. [DOI] [PubMed] [Google Scholar]
- Meredith MA, Wallace MT, Stein BE ( 1992) Visual, auditory and somato-sensory convergence in output neurons of the cat superior colliculus: multisensory properties of the tecto-reticulo-spinal projection. Exp Brain Res 88: 181-186. [DOI] [PubMed] [Google Scholar]
- Meredith MA, Miller LK, Ramoa AS, Clemo HR, Behan M ( 2001) Organization of the neurons of origin of the descending pathways from the ferret superior colliculus. Neurosci Res 40: 301-313. [DOI] [PubMed] [Google Scholar]
- Mohler CW, Wurtz RH ( 1976) Organization of monkey superior colliculus: intermediate layer cells discharging before eye movements. J Neurophysiol 39: 722-744. [DOI] [PubMed] [Google Scholar]
- Mooney RD, Huang X, Rhoades RW ( 1992) Functional influence of interlaminar connections in the hamster's superior colliculus. J Neurosci 12: 2417-2432. [DOI] [PMC free article] [PubMed] [Google Scholar]
- Moschovakis AK, Karabelas AB, Highstein SM ( 1988) Structure-function relationships in the primate superior colliculus. I. Morphological classification of efferent neurons. J Neurophysiol 60: 232-262. [DOI] [PubMed] [Google Scholar]
- Ogasawara K, McHaffie JG, Stein BE ( 1984) Two visual corticotectal systems in cat. J Neurophysiol 52: 1226-1245. [DOI] [PubMed] [Google Scholar]
- Özen G, Augustine GJ, Hall WC ( 2000) Contribution of superficial layer neurons to premotor bursts in the superior colliculus. J Neurophysiol 84: 460-471. [DOI] [PubMed] [Google Scholar]
- Redgrave P, Odekunle A, Dean P ( 1986) Tectal cells of origin of tectoreticular in rat: location and segregation from ipsilateral descending pathway. Exp Brain Res 63: 279-293. [DOI] [PubMed] [Google Scholar]
- Rhoades RW, Mooney RD, Rohrer WH, Nikoletseas MM, Fish SE ( 1989) Organization of the projection from the superficial to the deep layers of the hamster's superior colliculus as demonstrated by the anterograde transport of Phaseolus vulgaris leucoagglutinin. J Comp Neurol 283: 54-70. [DOI] [PubMed] [Google Scholar]
- Schiller PH, Stryker M ( 1972) Single-unit recording and stimulation in superior colliculus of the alert rhesus monkey. J Neurophysiol 35: 915-924. [DOI] [PubMed] [Google Scholar]
- Schiller PH, Stryker M, Cynader M, Berman N ( 1974) Response characteristics of single cells in the monkey superior colliculus following ablation or cooling of visual cortex. J Neurophysiol 37: 181-194. [DOI] [PubMed] [Google Scholar]
- Schnupp JWH, King AJ, Smith AL, Thompson ID ( 1995) NMDA-receptor antagonists disrupt the formation of the auditory space map in the mammalian superior colliculus. J Neurosci 15: 1516-1531. [DOI] [PMC free article] [PubMed] [Google Scholar]
- Sparks DL ( 1988) Neural cartography: sensory and motor maps in the superior colliculus. Brain Behav Evol 31: 49-56. [DOI] [PubMed] [Google Scholar]
- Sparks DL ( 1999) Conceptual issues related to the role of the superior colliculus in the control of gaze. Curr Opin Neurobiol 9: 698-707. [DOI] [PubMed] [Google Scholar]
- Stein BE, Wallace MT, Meredith MA ( 1995) Neural mechanisms mediating attention and orientation to multisensory cues. In: The cognitive neurosciences (Gazzaniga MA, ed), pp 683-702. Cambridge, MA: MIT.
- Veenman CL, Reiner A, Honig MG ( 1992) Biotinylated dextran amine as an anterograde tracer for single- and double-labeling studies. J Neurosci Methods 41: 239-254. [DOI] [PubMed] [Google Scholar]
- Voigt T ( 1989) Development of glial cells in the cerebral wall of ferrets: direct tracing of their transformation from radial glia into astrocytes. J Comp Neurol 289: 74-88. [DOI] [PubMed] [Google Scholar]
- Wallace MT, Stein BE ( 1997) Development of multisensory neurons and multisensory integration in cat superior colliculus. J Neurosci 17: 2429-2444. [DOI] [PMC free article] [PubMed] [Google Scholar]
- Wallace MT, Stein BE ( 2001) Sensory and multisensory responses in the newborn monkey superior colliculus. J Neurosci 21: 8886-8894. [DOI] [PMC free article] [PubMed] [Google Scholar]
- Wallace MT, Wilkinson LK, Stein BE ( 1996) Representation and integration of multiple sensory inputs in primate superior colliculus. J Neurophysiol 76: 1246-1266. [DOI] [PubMed] [Google Scholar]
- Wallace MT, McHaffie JG, Stein BE ( 1997) Visual response properties and visuotopic representation in the newborn monkey superior colliculus. J Neurophysiol 78: 2732-2741. [DOI] [PubMed] [Google Scholar]
- Withington-Wray DJ, Binns KE, Keating MJ ( 1990) The developmental emergence of a map of auditory space in the superior colliculus of the guinea pig. Brain Res Dev Brain Res 51: 225-236. [DOI] [PubMed] [Google Scholar]