

Abstract
Human performance on diverse tests of intellect are impacted by a “general” regulatory factor that accounts for up to 50% of the variance between individuals on intelligence tests. Neurobiological determinants of general cognitive abilities are essentially unknown, owing in part to the paucity of animal research wherein neurobiological analyses are possible. We report a methodology with which we have assessed individual differences in the general learning abilities of laboratory mice. Abilities of mice on tests of associative fear conditioning, operant avoidance, path integration, discrimination, and spatial navigation were assessed. Tasks were designed so that each made unique sensory, motor, motivational, and information processing demands on the animals. A sample of 56 genetically diverse outbred mice (CD-1) was used to assess individuals' acquisition on each task. Indicative of a common source of variance, positive correlations were found between individuals' performance on all tasks. When tested on multiple test batteries, the overall performance ranks of individuals were found to be highly reliable and were “normally” distributed. Factor analysis of learning performance variables determined that a single factor accounted for 38% of the total variance across animals. Animals' levels of native activity and body weights accounted for little of the variability in learning, although animals' propensity for exploration loaded strongly (and was positively correlated) with learning abilities. These results indicate that diverse learning abilities of laboratory mice are influenced by a common source of variance and, moreover, that the general learning abilities of individual mice can be specified relative to a sample of peers.
Keywords: intelligence, general intelligence, fluid intelligence, associative learning, memory, spatial learning, emotional learning, learning systems, genetic variation, behavioral phenotypes
Introduction
A “general” influence on humans' performance across diverse tests of cognitive abilities has been described as the most dominant and one of the most heritable cognitive traits ever identified (Plomin, 1999; Plomin and Spinath, 2002). Although general cognitive abilities are vigorously studied in human populations (for review, see Jensen, 1998; Mackintosh, 1998), comparable studies of nonhuman animals have been infrequent. Nevertheless, the topic has generated attention within the broader neuroscience community (Plomin, 1999, 2001; Matzel and Gandhi, 2000; Gray et al., 2003). Given this emerging interest, the underrepresentation of this work in studies of laboratory animals is unfortunate, given the utility of such subjects for the elucidation of the brain substrates for individual differences in learning and intellect.
An individual's proficiency on any test of mental ability reflects domain-specific attributes as well as a domain-independent general influence on cognitive function (Sternberg and Kaufman, 1998). Although this conclusion has been based primarily on studies of “intelligence,” subjects' performance on intelligence tests typically covary with performance on explicit tests of learning (Kolligian and Sternberg, 1987; Carroll, 1993). Although it is thus likely that a general factor influences animals' performance on tests of learning, tasks presumed to impinge on specific domains (e.g., “spatial” memory, “emotional” memory, “reflex” memory) are typically the focus of investigators interested in underlying brain mechanisms (Squire and Zola-Morgan, 1991; Lavond et al., 1993; LeDoux, 2000; Gilbert et al., 2001). Despite their utility for this purpose, these disparate tasks are not directly useful for the estimation of animals' general learning abilities, because an unspecified proportion of the behavioral variance on a particular task is attributable to such a factor. Thus a need exists for practical and conceptually valid methods to quantify the general learning abilities of animals. Such methods are imperative to evaluations of individual differences in learning but are also necessary to assess the effects on learning of manipulations (e.g., pharmacological or transgenic) presumed to impinge on cognitive abilities. In the absence of a more systematic approach, such efforts have relied on behavioral results obtained in different laboratories, each using unique learning tasks with no deliberate consideration of their unique or common properties (Staubli et al., 1994; Shors et al., 1995; Hampson et al., 1998; Tang et al., 1999).
Attempts to isolate general learning abilities in individual laboratory animals have been rare (cf. Galsworthy et al., 2002) and results have been inconsistent (Locurto and Scanlon, 1998). Here we report a methodology with which to characterize the general learning abilities of individual mice on the basis of their performance on a battery of learning assays. Tasks in this test battery isolate basic learning skills that are presumed to underlie a broad range of more complex forms of learning. Given their rudimentary nature, learning on these tasks can be precisely quantified, and the idiosyncratic properties of the tasks can be specified. Tasks were designed on the basis of four considerations. (1) Task diversity: tasks make different sensory, motor, motivational, and information processing demands on the animal. (2) (Non)-transfer of learning: tasks were designed such that an animal's experience with one task would not obviously impinge on its performance on other tasks in the battery. (3) Time constraints: to reduce any differential (between-animal) impact of the passage of time (e.g., aging, cycles), tasks were designed so that the entire battery could be administered in 16 d. (4) Sensitivity to variability between animals: critically, we intended to assess learning during acquisition, mitigating any differential influence of animals' capacity for long-term retention and ensuring sensitivity to real differences between animals that might otherwise be obscured in measures of asymptotic performance.
Here we report results obtained from a sample of 56 outbred CD-1 adult male mice (and a matched sample of 8 animals that contributed to relevant control procedures). Additionally, rudimentary measures of exploration, activity, motor performance, emotionality, and body weight were obtained. In combination with the analysis regimen that we describe, we were able to estimate that proportion of the variance between animals that is uniquely attributable to a general influence on learning/cognitive abilities.
Materials and Methods
Subjects
A sample of 64 male CD-1 mice (Harlan Sprague Dawley) were 80-86 d old at the start of experimentation. Fifty-six animals contributed to our analysis of general learning abilities, and eight animals served in control procedures. CD-1 animals exhibit considerably more between-animal behavioral variability than several inbred strains that we have tested with similar procedures. Animals were trained and tested in five independent replications (n = 8, 8, 8, 12, and 20). Two of the replications (n = 8) were composed of animals obtained from a single shipment, whereas the remaining replications were composed of animals drawn from separate shipments. In the descriptions of individual tasks, the performance of subjects 9-16 is described, and these animals were trained and tested concurrently with the eight subjects that served in various control procedures.
Animals were acclimated to our laboratory for 20-26 d before testing and were handled for 90 sec/d, 5 d/week during this period. This handling ensured that differential stress responses to the experimenters and any associated effects on learning were minimized. Animals were individually housed in clear boxes with floors lined with wood shavings in a humidity- and temperature-controlled vivarium adjacent to testing rooms. A 12 hr light/dark cycle was maintained.
Behavioral training and testing
A total of 56 animals were tested on five learning tasks and in an open field. The processes that are commonly asserted to underlie each task, relevant stimuli, deprivation state, and relevant motor requirements are summarized in Table 1. After the completion of each task, animals received 1 d of rest. With 1-3 d required for each task, the entire test regimen was completed (for each replication) in 16 d. With the exception of fear conditioning and passive avoidance, the performance of all animals was stored on video tape and behavior was scored off-line. Different experimenters were responsible for training and testing animals in each of the five learning tasks, and no experimenter was aware of animals' performance on other tasks until after the completion of the entire battery of tests.
Table 1.
Summary of task variables
|
|
Process |
Test stimulus |
Motor requirement |
Organic deprivation |
Reinforcer |
|---|---|---|---|---|---|
| Lashley maze | Operant approach/egocentric navigation | Egocentric/visual | Ambulation | Food | BioServ Pellet (+) |
| Passive avoidance | Operant avoidance | Place | Passivity | None | Noise/light (−) |
| Spatial water maze | Operant escape/allocentric navigation | Extramaze/visual | Swimming | None | Water immersion (−) |
| Odor discrimination | Discrimination | Olfactory | Cue-directed ambulation | Food | Rice (+) |
| Fear conditioning
|
Association formation
|
Auditory
|
Suppression
|
Water
|
Foot shock (−)
|
Before testing on any task, the test chambers were “primed” by exposing two nonexperimental animals to the apparatus and procedures. This was intended to standardize the apparatus such that the first animals in a test cycle encountered a chamber that was nominally identical (e.g., in odor) to that experienced by subsequently tested animals. The surfaces of every piece of apparatus were cleaned with a mild alcohol solution after removal of every subject from the apparatus.
For the two tests requiring food deprivation, ad libitum food was removed from the animals' home cages at the end of the light cycle on the day before the rest day that preceded the start of training. During the deprivation period, animals were provided with food in their home cages for 90 min/d during the last 2 hr of the light cycle, and thus they were food deprived for ∼16 hr at the time of training or testing. Although mild, this level of deprivation was sufficient to maintain stable performance on these tasks. In the one task that required water deprivation, the same schedule was followed except that ad libitum access to water was limited to 60 min per day.
So that the time of day did not differentially impact animals' performance, all animals were trained and tested during the middle 7 hr of the light cycle, and procedures were administered to animals with as little temporal dispersion as possible. All animals were trained and tested under conditions that were as similar as possible.
Open-field exploration. A square field (46 × 46 cm) with 13-cm-high walls was constructed of white Plexiglas and located in a brightly lit room (400 Lux) with a background noise of 65 dBc. The field was conceptually divided into a grid composed of 6 × 6 7.65 cm quadrants in which 20 of the quadrants abutted the outer walls of the field (i.e., “wall” quadrants) and 16 quadrants were displaced from the walls and composed the interior (i.e., “open” quadrants) of the field.
Animals were placed in the center of the field. After 20 sec had elapsed (during which the animals self-selected a starting location), the animals' behavior was monitored for 4 min. Throughout this time the animal's entries into wall and open quadrants were recorded. An entry was recorded whenever both front paws crossed the border of a quadrant. Additionally, animals' running speed was estimated. In the open field, rodents often exhibit “bursts” of uninterrupted running, typically along the walls of the field. Here, running speed was calculated as those instances in which an animal ran continuously (i.e., without stopping, rearing, or overt head turning) along an outer wall (from corner to corner) of the field, but only on those instances in which the animal began from a stationary start in one corner. Four such episodes were recorded for each animal during the last 3 min of the test interval (such bursts are infrequent during the first minute of exposure), and the average of these four instances served as the index of each animal's running speed (centimeters per second). (Because rates varied between bursts of running, multiple instances were averaged to provide a more accurate estimate of each animal's “typical” rate. Four such instances were averaged because it was determined that no animal in our sample made fewer than four bursts of running that satisfied our criterion for inclusion.)
We have analyzed animals' open-field behavior in 1 min blocks but have observed no systematic pattern of change across the 4 min of testing, so here data are reported as the sum of the 4 min test. It should be noted that a 4 min test was explicitly chosen (on the basis of pilot work) so that appreciable changes in behavior (e.g., that which accompanies habituation) were not observed over time (as may occur during longer periods of exposure to the field). This was intended to ensure that open-field performance was most sensitive to unlearned behavioral tendencies.
Lashley III maze. The Lashley III maze consists of a start box, four interconnected alleys, and a goal box containing a food reward. Over trials, the latency of rats to locate the goal box decreases, as do their errors (i.e., wrong turns or retracing). Lashley asserted that rats' performance in this maze reflected a sequence of learned motor responses that were dependent on egocentric navigation. Although there was much debate associated with Lashley's interpretation of rats' performance, it is conceded that under certain conditions, animal's rely heavily on fixed motor patterns to navigate such a maze, a strategy that differentiates this performance from that in the spatial water maze (task 4 below).
Here, the Lashley III maze was scaled for mice (as illustrated in Fig. 1), and parameters were developed that supported rapid acquisition. The maze was constructed of black Plexiglas. A 2 cm wide × 0.1 cm deep white cup was located in the rear portion of the goal box, and 45 mg of BioServe (rodent grain) pellets served as reinforcers. Illumination was 80 Lux at the floor of the maze. The maze was isolated behind a shield of white Plexiglas to mitigate against extra-maze landmark cues.
Figure 1.

A Lashley III maze was constructed of black Plexiglas. The alleys were 58 × 6 cm, and the walls were 16 cm high. The animal was placed in the start compartment and allowed to traverse the maze to obtain a food pellet located in the goal box.
Food-deprived animals were acclimated and trained on 2 successive days. On the day before acclimation, all animals were provided with three food pellets in their home cages to familiarize them with the novel reinforcer. On the acclimation day, each mouse was placed in the four alleys of the maze, but the openings between the alleys were blocked so that the animals could not navigate the maze. Each animal was confined to the start and subsequent two alleys for 4 min and for 6 min in the last (goal) alley, where three food pellets were present in the food cup. This acclimation period promotes stable and high levels of activity on the subsequent training day. On the training day, each animal was placed in the start box and allowed to traverse the maze until it reached the goal box and consumed the single food pellet present in the cup. After it consumed the food, the animal was returned to its home cage for a 20 min interval (ITI), after which it was returned to the start box to begin the next trial. The apparatus was cleaned during each ITI, and the sequence was repeated for five trials. Both the latency and errors (i.e., a turn in an incorrect direction, including those that result in path retracing) to enter the goal box were recorded on each trial.
Typically, on the first trial animals enter the goal box within 100-300 sec and make 15-25 “errors” before retrieving the food. On subsequent trials, performance improves markedly. For purposes of ranking animals, the average of performance on trials 3 and 4 served as the index of learning for each animal. We have adopted the practice of averaging behavior over two trials to better represent animals' performance.
One-trial passive avoidance. Animals learn to suppress movement to avoid contact with aversive stimuli. This “passive avoidance” response is exemplified in step-down avoidance procedures, during which, commonly, an animal is placed on a platform whereupon it encounters a foot shock when it steps off the platform. After just a single encounter with shock, animals are subsequently reluctant to step off the safe platform. The animals' reluctance to leave the platform is believed to not reflect fear, because typical fear responses are not expressed in animals engaged in the avoidance response (Bolles, 1969; Morris, 1974). We intended that the tasks that comprise our test battery each use unique stimuli to motivate responding. To not duplicate stimuli (i.e., shock) used to support associative learning in task 6, here we use a variant of the step-down avoidance task that does not rely on shock to motivate behavior. After they step off the platform, animals are exposed to a compound of bright light, noise, and vibration. Like more common procedures, our variant of this task supports learning after only a single trial (i.e., subsequent step-down latencies are markedly increased).
A chamber illuminated by dim (< 5 fc) red light was used for training and testing. At the rear of a 16 × 12 cm (length × width) white grid floor was an enclosed platform (70 × 45 × 45 cm; length × width × height) constructed of black Plexiglas and closed on all sides except the side facing the grid floor. The platform floor was 5 cm above the grid floor, and a black Plexiglas sloping ramp extended 5 cm from the floor of the platform to the grid floor. The exit from the platform could be blocked by a remotely operated, clear Plexiglas sliding door. When an animal stepped from the platform and contacted the grid floor, the compound aversive stimulus composed of a bright (550 Lux) white light, noise, and vibration was initiated. Noise and vibration were produced by a flexible nylon rod attached to a motor outside of an exterior wall of the chamber such that the rod struck the wall of the chamber twice during each revolution (1400 rpm) of the motor, producing a noise 65 dBa above a 45 dBa background and a 46 Hz vibration of the chamber surfaces.
Animals were placed on the platform behind the exit blocked by the Plexiglas door. After 5 min of confinement, the door was retracted and the latency of the animal to leave the platform and make contact with the grid floor was recorded. Before training, step-down latencies typically range from 8 to 20 sec. (This narrow range of baseline latencies reflects the 5 min of confinement of the animal on the platform, as determined by preliminary studies.) After contact with the floor, the door to the platform was lowered, and the aversive stimulus (light, noise, and vibration) was presented for 4 sec, at which time the platform door was opened to allow animals to return to the platform, where they were again confined for 5 min. At the end of this interval, the door was opened, and the latency of the animal to exit the platform and step onto the grid floor (with no aversive stimulation) was recorded, completing training and testing.
The ratios of post-training to pretraining step-down latencies were calculated for each animal and served to index learning. In pilot experiments, we determined that asymptotic performance was apparent in group averages after two to three training trials; thus performance after a single trial reflects (in most instances) subasymptotic learning.
Spatial water maze. For this task, animals are immersed in a round pool of opaque water from which they can escape onto a hidden (i.e., submerged) platform. The latency for animals to find the platform decreases across successive trials. In this task, performance of animals can improve across trials despite the animals beginning each trial from a new start location. Such a procedure mitigates against egocentric navigation and promotes the animals' dependence on extra-maze spatial landmarks. As demonstrated by Morris (Morris, 1981), rats' performance in the water maze does not rely on fixed motor patterns (i.e., performance improves despite the animals irregular starting location) or the presence of discernable cues within the maze (e.g., visual, tactile, or olfactory signals). Instead, performance is dependent on the stability of extra-maze cues, or “landmarks,” and is said to reflect the animals' representation of its environment as a “cognitive map.”
We have developed a protocol in which mice exhibit significant reductions in their latency to locate the escape platform within six training trials. Because this is unusually rapid learning in this task, several relevant modifications of the task should be emphasized. First, animals were confined in a clear Plexiglas cylinder on the safe platform for 5 min on the day before training. Second, a considerably longer ITI (10 min) was used than is typical (90 sec). Last, the water in the maze was cooled (with submerged tubes of circulating refrigerant) to 15°C (in a 22°C room). This latter modification motivates the mice to remain on the escape platform after locating it, whereas in room temperature water (22°C), mice often reenter the water and continue swimming immediately after locating the platform, complicating the interpretation of the animals' behavior.
A round white pool (140 cm diameter, 56 cm deep) was filled to within 20 cm of the top with water made opaque by the addition of a nontoxic, water soluble, white paint. A hidden 12-cm-diameter perforated white platform was in a fixed location 1.5 cm below the surface of the water midway between the center and perimeter of the pool. The pool was enclosed within a ceiling-high white curtain on which six different 45- to 65-cm-high black geometric shapes (landmarks) were variously positioned at heights (relative to water surface) ranging from 90 to 150 cm. A video camera lens extended through a 30-cm-diameter black circle 180 cm above the center of the water surface.
On the day before training, each animal was confined to the escape platform for 300 sec. On the subsequent training day, animals were started from a unique location on each of six trials. (The pool was conceptually divided into four quadrants, and two starting points were located in each of the three quadrants that did not contain the escape platform. The starting point on each trial alternated between the three available quadrants.) An animal was judged to have escaped from the water (i.e., located the platform) at the moment at which four paws were situated on the platform, provided that the animal remained on the platform for at least 5 sec. Each animal was left on the platform for a total of 20 sec, after which the trial was terminated. Trials were spaced at 10 min intervals, during which time the animals were held in a warmed (26.5°C), opaque (5 Lux) box lined with cage paper. On each trial, a 90 sec limit on swimming was imposed, at which time any animal that had not located the escape platform was placed by the experimenter onto the platform, where it remained for 20 sec. Animals were observed from a remote (outside of the pool's enclosure) video monitor, and animals' performance was recorded on video tape for subsequent analysis.
Odor discrimination and choice. Rodents learn rapidly to use odors to guide appetitively reinforced behaviors. In a procedure based on one designed by Sara (Sara et al., 2001) for rats, mice learn to navigate a square field in which unique odor-marked (e.g., almond, lemon, mint) food cups are located in three corners. Although food is present in each cup, it is accessible to the animals in only one cup (e.g., that marked by mint odor). An animal is placed in the empty corner of the field, after which it will explore the field and eventually retrieve the single piece of available food. On subsequent trials, the location of the food cups are changed, but the accessible food is consistently marked by the same odor (i.e., mint). On successive trials, animals require less time to retrieve the food and make fewer approaches (i.e., “errors”) to those food cups in which food is not available. We have adapted this procedure for use with mice, and typically observe errorless performance within three to four training trials. Control procedures (in which the target odor is not consistent) indicate that odor is the principal determinant of animals' discrimination (i.e., performance does not improve under conditions for which the target odor is changed across trials).
A black Plexiglas 60-cm-square field with 30-cm-high walls was located in a dimly lit (10 fc) testing room with a high ventilation rate (3 min volume exchange). Three 4 × 4 × 2.0 cm (length, width, height) aluminum food cups were placed in three corners of the field. A food reinforcer (30 mg portions of chocolate-flavored puffed rice) was placed in a 1.6-cm-deep, 1-cm-diameter depression in the center of each cup. The food in two of the cups was covered (1.0 cm below the surface of the cup) with a wire mesh so that it was not accessible to the animal, whereas in the third cup (the “target” cup), the food could be retrieved and consumed.
A cotton-tipped laboratory swab, located between the center and rear corner of each cup, extended vertically 3 cm from the surface of the cups. Immediately before each trial, fresh swabs were loaded with 25 μl of either lemon, almond, or mint odorants (McCormick flavor extracts). The mint odor was always associated with the target food cup. (It should be noted that in pilot studies, the odor associated with food was counter-balanced across animals, and no discernible differences in performance could be detected in response to the different odors.)
On the acclimation day, each food-deprived animal was placed in the field for 20 min with no food cups present. At the end of that day's light cycle, three pieces of chocolate-flavored puffed rice that would subsequently serve as the reinforcer were placed in the animals' home cages to acquaint them with the reinforcer. On the subsequent test day, animals received four training trials in the field with three food cups present. On each trial, an animal was placed in the empty corner of the field. On trial 1, the reinforcing food (rice) was available to the animal in the cup marked by mint odor. On only this trial, an additional portion of food was placed on the top surface of the same cup. The trial continued until the animal retrieved and consumed the food from the target cup, after which the animal was left in the chamber for an additional 20 sec and then returned to its home cage to begin a 6 min ITI. On trials 2-4, the location of the food cups was rearranged, but the baited cup remained consistently marked by the mint odor. Both the corner location of the mint odor and its position relative to the remaining odors were changed on each trial.
On each trial, the latency to retrieve the food and errors were recorded. An error was recorded any time that an animal made contact with an incorrect cup or its nose crossed a plane parallel to the perimeter of a incorrect cup. Similarly, an error was recorded when an animal sampled (as above) the target cup but did not retrieve the available food. In this task, latency to retrieve food and errors have yielded closely comparable patterns of results, as indicated both in group means and in the performance of individual animals. For the purpose of ranking animals for analysis, errors served as the dependent measure to avoid the complication of differences between animals' speed of locomotion.
Associative fear conditioning. In such a procedure, animals are exposed to a stimulus [i.e., a conditioned stimulus (CS); a tone] that terminates in the onset of a mild foot shock [i.e., an unconditioned stimulus (US)]. These tone-shock (CS-US) pairings come to elicit conditioned fear responses when animals are subsequently presented with the tone. This learned fear can be assessed in various ways. In the present studies, fear was indexed by CS-elicited suppression of ongoing drinking, because this measure is quantified easily and precisely. “Lick suppression” is conceptually analogous to the more commonly used measure of CS-elicited generalized “freezing” (i.e., during that time in which an animal freezes it necessarily is not capable of drinking from a lick tube). In our laboratory, lick suppression has proven to be of greater utility, given that the generalized freezing exhibited by mice is far less regular (and thus more ambiguous) than that which we have typically observed in rats. To avoid any interaction of the training context (which itself acquires an association with shock) with the CS at the time of testing, training and testing were conducted in separate distinct contexts.
Two distinct experimental chambers (i.e., contexts; 32 × 28 × 28 cm, length× width × height) were used, each of which was contained in a sound- and light-attenuating enclosure. These boxes were designated as “training” and “testing” contexts and differ as follows. The training context was brightly illuminated (100 Lux), had clear Plexiglas walls, no lick tube, and parallel stainless steel rods (5 mm, 10 mm spacing) forming the floor. The test context was dimly illuminated (6 Lux), the walls were covered with an opaque pattern of alternating black and white vertical stripes (3 cm wide), and the floor was formed from stainless 1.5 mm rods arranged at right angles to form a grid of 8 mm squares. A water-filled lick tube protruded through a small hole in one wall of the test chamber, such that the tip of the tube was flush with the interior surface of the wall at a point 3 cm above the floor. After contacting the tube, the animal completed a circuit such that the number of licks per second could be recorded. This circuit was designed so that if an animal made continuous contact with the tube (i.e., “mouthed” the tip), the circuit recorded eight licks per second, a rate that approximates continuous licking.
In the training chamber, a 0.6 mA constant-current scrambled foot shock (US) could be delivered through the grid floor. In both the training and test chambers, a 40 dB above background tone could be generated by the operation of Sonalert oscillators mounted on the top center of an end wall of each chamber.
Water-deprived animals were acclimated to the training and test chambers by placing them each in both contexts for 30 min on the day before training. Within several minutes of their first placement in the test context, water-deprived mice exhibited stable licking (for water). When subsequently placed in the chamber, these animals typically initiated licking within 5-10 sec and licked at relatively stable rates for the subsequent 4-6 min. Training occurred in the training context in a single 40 min session during which each animal was administered a tone-shock pairing 15 and 30 min after entering the chamber. Each 10 sec tone terminated with the onset of a 500 msec foot shock. With our present parameters, we have observed that asymptotic performance (as evident in group means) is reached with four to six such pairings. Thus two pairings (in most instances) support subasymptotic conditioned responding. At the end of the training session, animals were returned to their home cages for 60 min, after which they were reacclimated to the test context for 20 min, where they were allowed ad libitum access to the lick tubes. On the subsequent day (23-25 hr after training), animals were tested. Each animal was placed in the test context, whereupon after they made 50 licks the tone CS was presented continuously until the animal completed an additional 25 licks. The latency to complete the last 25 licks during the pre-tone interval and in the presence of the tone was recorded, with a 600 sec limit imposed on the second 25 licks (a limit not reached by any animal described here). With these measures, the latency to complete 25 licks in the presence of the tone CS serves as our index of learned fear, and the latency to complete 25 licks before CS onset served as an index of basal lick rates.
Results
Performance data from five independent replications (three composed of 8 subjects, one of 12 subjects, and one of 20 subjects; total sample = 56) contributed to the ultimate factor analysis. First, results from each of the behavioral tasks that comprise the test battery will be described. Summary data are presented from a single replication of eight animals (subjects 9-16), as are summary data obtained from an additional group of eight animals that were trained and tested concurrently (with subject 9-16) on certain control procedures. In addition to summary data for these eight subjects, the performance data of two individual animals from this sample are also provided that illustrate the relative consistency of these two animals across each task. These two animals were chosen for illustration because they were ultimately determined to be the most (subject 16) and least (subject 13) efficient learners in this particular replication.
Subsequent to the descriptions and summaries of each of the five learning tasks is the presentation and factor analysis of the data obtained from a larger sample of 56 subjects. Inferences of general learning abilities are derived from these later analyses. Similarly, results of an experiment are described from which it is possible to estimate the reliability of our estimates of animals' general learning abilities. Finally, data relevant to the relationship of native behavioral tendencies to general learning abilities are presented.
Individual learning tasks
Lashley maze (Fig. 1)
The mean performance of animals 9-16 are illustrated in Figure 2, as are the responses of animals 13 and 16, which ranked last and first (respectively) on general learning abilities in this replication. Both latency and error measures are similarly representative of animals' performance. For purposes of analysis, however, errors serve as our index of learning because this measure is devoid of any differences between animals in running speed.
Figure 2.

Top, Latency across trials to find food in the Lashley maze. Bottom, Errors (turns in wrong direction, retracing) across trials.
One-trial passive avoidance
Group data as well as the performance of animals 13 (worst aggregate learner) and 16 (best aggregate learner) are illustrated in Figure 3. Also illustrated are data from a group of eight control animals that received the same training except that the aversive stimulation was delivered to the animals 5 min after leaving the platform. In contrast to paired training, this unpaired training supported no change in step latencies.
Figure 3.

Latency to step from platform after training relative to pretraining in the passive avoidance task.
Spatial water maze
Summary data for animals 9-16 and data for animals 13 and 16 (“worst” and “best” aggregate learners, respectively) are provided in Figure 4. The latency of animals to locate the platform decreased systematically across trials, as indicated by the group's mean performance. However, the performance of animal 13 was unstable even on the latter trials.
Figure 4.

Latency to find a hidden platform in the water maze across six training trials.
Odor discrimination and choice
Figure 5 (top) illustrates the group performance of subjects 9-16, as well as the individual performance of subjects 13 and 16. Because many animals exhibit errorless performance by the fourth training trial (and thus cannot be discriminated), the average performance of individual animals on trials 2-3 was used for the assignment of ranks for the purpose of analysis. Figure 5 (bottom) illustrates the performance of a separate group of eight animals trained concurrently with a variant of the procedure followed in training subjects 9-16. In this alternate procedure, the location of food was switched from the cup marked by mint odor to the cup marked by almond odor after the completion of trial 3. These animals' subsequent performance on trial 4 was significantly impaired, indicating that the target odor (i.e., odor discrimination) was a critical determinant of the animals' improved performance across training trials.
Figure 5.

Top, Errors to retrieve food across four trials during odor discrimination. Bottom, Control subjects for whom the target odor was switched from mint to almond before the fourth training trial.
Associative fear conditioning
Little variability was observed in the animals' latency to complete the 25 licks that preceded the onset of the tone CS (with latencies ranging from 4 to 7 sec). However, considerable variability between animals was observed in their completion of 25 licks in the presence of the tone, and it is this latency that serves as our index of learned fear. The mean latency of animals 9-16 to complete 25 licks in the presence of the tone is illustrated in Figure 6, as are the latencies of subjects 13 (which exhibited the worst aggregate learning performance) and 16 (the best aggregate learning performance). A group of eight additional animals were similarly trained, except that the tone and shock were explicitly unpaired (6 min ISI), and these animals (also illustrated in Fig. 6) exhibited appreciably faster lick rates during the tone CS during testing. Thus the suppression exhibited by animals trained with paired presentations of the tone and shock can be surmised to reflect the formation of a learned association that was dependent on the contiguous occurrence of the tone and shock.
Figure 6.

Latency (seconds) to complete 50 licks in the presence of a tone after paired or unpaired presentations of the tone with shock.
Individual differences and the expression of general learning abilities
Above were summarized data obtained from subjects 9-16 (illustrated in Figs. 2, 3, 4, 5, 6) tested in the five tasks that comprise our learning battery. Here, summary analyses of behavioral data from 56 animals (including subjects 9-16) are described. For qualitative purposes, the rank of each animal relative to its peers can illuminate individual differences in learning on each task, as well as differences between animals in their abilities across tasks. For ranking, the performance of animals on each task was assessed at a point in training that did not typically support asymptotic learning, i.e., each animal's rate of acquisition served to determine its rank (as described previously). Animals 9-16 (described in Figs. 2, 3, 4, 5, 6) will be used to illustrate the utility of such rankings. Table 2A provides the individual performance scores used to calculate ranks, and Table 2B provides the rank of these animals on each of the five learning tasks. These ranks were then averaged to provide an index of each animal's overall performance. When two or more animals performed similarly on a task (i.e., committed the same number of errors on the relevant test trials), those animals were assigned the mean rank based on the ranks spanned by those animals. Individuals' rank by task and average ranks across tasks are illustrated in Figure 7.
Table 2.
Performance of individuals on each of five learning tasks
|
A. Individuals' performance scores |
B. Individuals' relative ranks |
||||||||||||||||||||||
|---|---|---|---|---|---|---|---|---|---|---|---|---|---|---|---|---|---|---|---|---|---|---|---|
|
Ss
|
LM
|
PA
|
WM
|
OD
|
FC
|
Ss
|
LM
|
PA
|
WM
|
OD
|
FC
|
Mean rank
|
|||||||||||
| 9 | 6.0 | .77 | 4.3 | 2.5 | 28 | 9 | 4.5 | 6 | 1 | 6 | 4 | 4.9 | |||||||||||
| 10 | 14.0 | .60 | 12.6 | 1.5 | 109 | 10 | 8 | 8 | 2 | 3.5 | 2 | 4.7 | |||||||||||
| 11 | 6.0 | 1.82 | 37.7 | 1.0 | 15 | 11 | 4.5 | 4 | 6 | 1.5 | 6.5 | 4.5 | |||||||||||
| 12 | 4.0 | 3.72 | 17.5 | 2.0 | 4 | 12 | 3 | 2 | 3 | 5 | 8 | 4.2 | |||||||||||
| 13a | 12.5 | .76 | 46.6 | 6.0 | 15 | 13a | 7 | 7 | 8 | 7.5 | 6.5 | 7.2 | |||||||||||
| 14 | 3.0 | 7.70 | 18.0 | 1.5 | 89 | 14 | 2 | 1 | 4 | 3.5 | 3 | 2.7 | |||||||||||
| 15 | 8.5 | 1.36 | 44.0 | 6.0 | 25 | 15 | 6 | 5 | 7 | 7.5 | 5 | 6.1 | |||||||||||
| 16a
|
2.5
|
2.38
|
30.8
|
1.0
|
268
|
16a
|
1
|
3
|
5
|
1.5
|
1
|
2.3
|
|||||||||||
Figure 7.
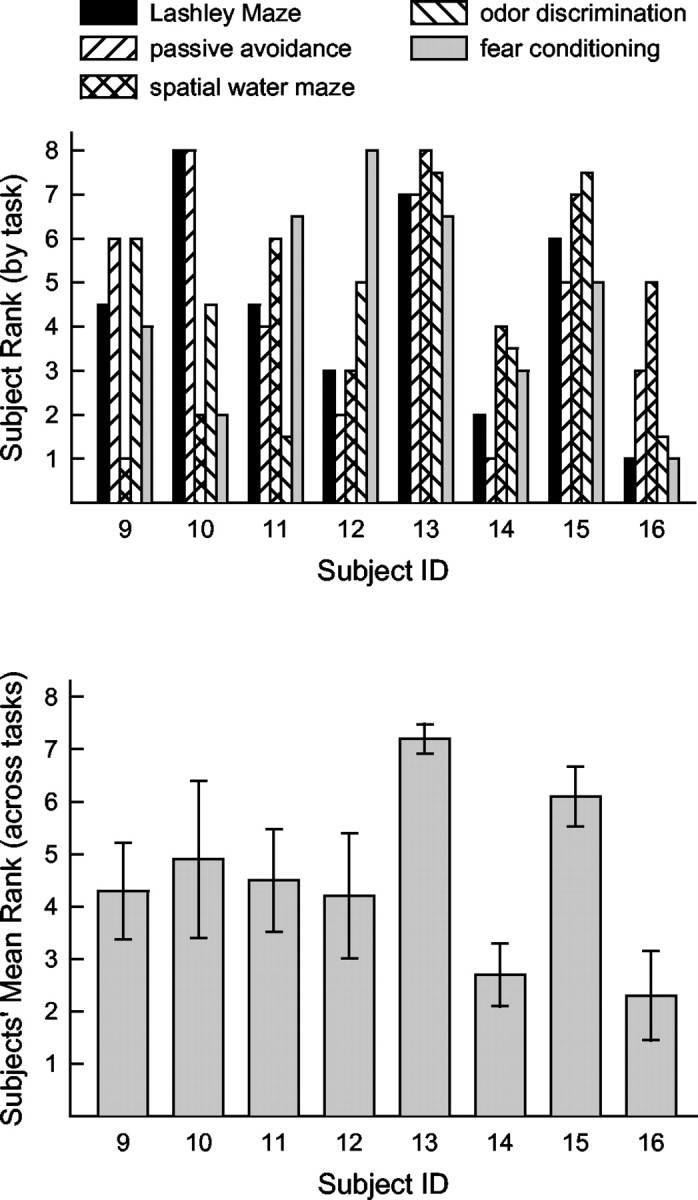
Top, Each bar represents an individual's relative rank (1 = best performer) on each learning task in this sample (n = 8). Bottom, The average of each individual's ranks on the five learning tasks (±SEM).
As can be discerned from Table 2 and Figure 7, individual animals express distinct general learning abilities. The shaded rows in Table 2 highlight those animals with the highest and lowest average ranks in this sample. The aggregate performance of each animal relative to its peers is best discerned from the animals' mean rank across tasks. If animals' performance on each task was independent (i.e., subject to no general influence), then performance on each task would reflect only the influence of task-specific abilities, and average ranks would be expected (probabilistically) to accumulate around the unbiased median (i.e., at a value of 4.5). In contrast, average performances were widely distributed. The distribution of average ranks for the entire sample of 56 subjects is illustrated in Figure 8.
Figure 8.

A total of 56 animals were tested in five replications, and animals' average ranks across learning task were computed relative to the other animals in its replication. Plotted is the distribution of average ranks (indicative of general learning ability) of all 56 animals.
Quantitative analyses of the raw performance scores obtained from the sample of 56 animals will now be described. A matrix of correlations between individuals' performance on every combination of learning tasks is presented in the top left portion of Table 3. From this matrix it is possible to estimate the degree to which animals' performance on any given task is indicative of their performance on other tasks. [For this matrix and subsequent factor analysis, all performance measures are entered such that lower values indicate better learning. Thus fewer errors in the Lashley maze, fewer errors in odor discrimination, and shorter latencies to locate the hidden platform in the water maze are indicative of better learning (and are entered in their nominal form). In the fear conditioning and passive avoidance tasks, higher nominal performance scores are indicative of better learning. In these two instances, performance scores are converted to negative numbers so that lower values represent better learning on all tasks. This has no statistical impact on the analyses (i.e., the magnitude of correlations or factor loadings), but the consistent directionality of the performance measures simplifies the description and illustration of the correlations and subsequent factor analyses.] In the top left portion of Table 3, it can be seen that all of the possible pair-wise correlations between learning performance variables are positive, i.e., reflect some common source of variance. Such observations in the human test literature are taken as evidence for a conserved influence on general cognitive abilities (for review, see Plomin, 1999; Sternberg, 1997).
Table 3.
Correlations (r values) of individuals' (n=56) performance across tasks
|
|
PA |
LM |
OD |
FC |
WM |
OF % open |
OF activity |
OF speed |
OF bolli |
Body weight |
|---|---|---|---|---|---|---|---|---|---|---|
| PA | 0.47*** | 0.24 | 0.23 | 0.21 | −0.37** | −0.13 | −0.03 | 0.14 | −0.26 | |
| LM | 0.47*** | 0.29* | 0.14 | 0.10 | −0.35** | −0.30* | −0.15 | 0.08 | −0.17 | |
| OD | 0.24 | 0.29* | 0.21 | 0.22 | −0.30* | −0.15 | 0.09 | −0.03 | 0.04 | |
| FC | 0.23 | 0.14 | 0.21 | 0.09 | −0.03 | −0.28* | −0.21 | 0.01 | −0.22 | |
| WM | 0.21
|
0.10
|
0.22
|
0.09
|
|
−0.28* | 0.06 | −0.09 | 0.07 | 0.12 |
| OF % open | −0.37** | −0.35** | −0.30* | −0.03 | −0.28* | 0.07 | 0.03 | −0.08 | −0.07 | |
| OF activity | −0.13 | −0.30* | −0.15 | −0.28* | 0.06 | 0.07 | 0.55*** | −0.02 | −0.08 | |
| OF speed | −0.03 | −0.15 | 0.09 | −0.21 | −0.09 | 0.03 | 0.55*** | −0.01 | −0.11 | |
| OF bolli | 0.14 | 0.08 | −0.03 | 0.01 | 0.07 | −0.08 | −0.02 | −0.01 | 0.05 | |
| Body weight
|
−0.26
|
−0.17
|
0.04
|
−0.22
|
0.12
|
−0.07
|
−0.08
|
−0.11
|
0.05
|
|
n = 56; *p < 0.05; **p < 0.01; ***p < 0.001.OF, Open field; LM, Lashley maze; PA, passive avoidance; OD, odor discrimination; WM, water maze; FC, fear conditioning.
Performance in both the Lashley maze and the passive avoidance task were similarly and most highly predictive of performance in other tasks in the battery. These latter correlations are quite illuminating, given the diametric demands of these two tasks (i.e., activity vs passivity, appetitive vs aversive control, path integration vs egocentric localization). These observations mitigate against an explanation of an animal's aggregate performance that supposes some inherent commonality in the performance demands of the tasks that comprise this battery.
A principal component method of factor analysis was conducted on the performance scores of the 56 animals in the test sample. To maximize sensitivity to any general factors, no factor rotation was performed. Only a single factor (eigen value = 1.92) was extracted from this data set, and that factor accounted for 38% of the total variance in performance across all tests. The loadings of each learning task on this factor are provided in Table 4. Loadings of the individual learning tasks in this factor confirm the above interpretation of the correlation matrix (Table 3), i.e., performance on the Lashley maze and passive avoidance tasks load strongly, whereas the loading of fear conditioning and the water maze are relatively weaker. It is impossible to discern from such an analysis what properties of a task account for its loading weight. Nevertheless, the consistency and weight of the individual task loadings strongly suggest that this factor is indicative of a general influence on learning that transcends idiosyncratic task demands. In this regard, it is of interest that the “g factor” that is proposed to influence diverse tests of human intelligence accounts for (by various estimates) 25-50% of the variability in performance across individuals (Sternberg, 1997; Plomin, 1999).
Table 4.
Unrotated factor loadings; principal component extraction
| Variable
|
Factor 1
|
|---|---|
| Passive avoidance | .76 |
| Lashley maze | .71 |
| Odor discrimination | .64 |
| Fear conditioning | .48 |
| Water maze | .45 |
|
|
|
| Eigen value | 1.92 |
| Proportion of total variance
|
.38
|
Reliability of ranks as an index of animals' learning abilities
We next determined the degree to which animals' ranks were a reliable index of relative learning abilities. To address this concern, a group of eight animals were trained and tested on the learning battery described above and subsequently on a second series of learning tasks. Each of the tasks in the second battery required new learning, although the nature of the tasks and the underlying processes were nominally identical to those that comprised the first series of tests. With data obtained from animals tested in each of the two batteries it was possible to assess the degree of consistency of individual animals' ranks on each of two analogous tasks, as well as the degree to which individuals' aggregate performances (i.e., average ranks) were correlated across the two series of tests.
After completion of the initial battery, animals began a second series of tests. Modifications of the tasks were as follows. (1) The black Lashley III maze was replaced with a white maze that required a different route to efficiently retrieve the food reinforcer. (2) For passive avoidance, animals were trained in a distinct context and the safe platform was white (cf. black). Furthermore, an odor (28 gm Vick's VapoRub) was added to the chamber to distinguish it from the chamber that had been used previously. (3) In the water maze, the spatial cues were replaced by a new set of geometric shapes located at different coordinates, the escape platform was moved to a different quadrant of the maze, and start locations were changed. (4) For odor discrimination, three new odors [i.e., rum, anise, coconut (target)] were used as discriminative cues, and the pattern of start locations were changed. (5) New training and test contexts were used for fear conditioning, and a flashing light (250 msec on/250 msec off) located in the top center of each box served as the CS.
The results of testing on the initial battery of tasks were similar in nature to those described previously for subjects 9-16 (Table 2, Fig. 7). As summarized in Table 5, the average rank (aggregate performance) of individual animals varied widely on the initial test battery, with average ranks ranging from 2.3 to 6.0. The ranks of these animals on the two sets of individual learning tasks are also provided in Table 5. Comparing the performance of animals on individual tasks, the correlations between their ranks ranged from r = 0.2 (water maze) to r = 0.75 (Lashley maze), suggesting that the tasks were variously reliable in their depiction of the “true” performance/ability of any individual animal. Even so, the correlation of the average ranks of individual animals, i.e., the estimate of general learning ability, was significant. Thus although the performance of each animal varied (to different degrees) across the successive batteries of tests on any single task, the overall estimation of an animal's performance relative to its peers was a reliable estimation of individuals' general learning ability.
Table 5.
Reliability of ranks
| Ss
|
LM1
|
LM2
|
PA1
|
PA2
|
WM1
|
WM2
|
OD1
|
OD2
|
FC1
|
FC2
|
Mean rank1
|
Mean rank2
|
||||||
|---|---|---|---|---|---|---|---|---|---|---|---|---|---|---|---|---|---|---|
| 1 | 5 | 7 | 3 | 5 | 7 | 2 | 7 | 8 | 7.5 | 7 | 5.9 | 5.8 | ||||||
| 2 | 4 | 2 | 6 | 8 | 8 | 7 | 1.5 | 4 | 4 | 8 | 4.7 | 5.8 | ||||||
| 3 | 3 | 4 | 4 | 1 | 1 | 3 | 3.5 | 6 | 5 | 1 | 3.3 | 3 | ||||||
| 4 | 8 | 5.5 | 8 | 6 | 6 | 5 | 5 | 6 | 3 | 4.5 | 6 | 5.4 | ||||||
| 5 | 6 | 5.5 | 5 | 4 | 5 | 4 | 8 | 6 | 6 | 6 | 6 | 5.1 | ||||||
| 6 | 1 | 1 | 2 | 2 | 2 | 1 | 1.5 | 2 | 7.5 | 2 | 2.8 | 1.6 | ||||||
| 7 | 7 | 8 | 7 | 7 | 3 | 8 | 6 | 2 | 2 | 4.5 | 5 | 5.9 | ||||||
| 8 | 2 | 3 | 1 | 3 | 4 | 6 | 3.5 | 2 | 1 | 3 | 2.3 | 3.4 | ||||||
|
|
r = 0.79*
|
r = 0.68
|
r = 0.24
|
r = 0.52
|
r = 0.09
|
r = 0.82**
|
||||||||||||
*p < 0.05; **p < 0.02. LM, Lashley maze; PA, passive avoidance; FC, fear conditioning; WM, water maze; OD, odor discrimination; 1, Standard tasks; 2, task variants.
Relationship of native behaviors and characteristics to general learning abilities
In addition to being tested on five learning tasks, these 56 animals were monitored in a walled open field (segmented into a grid of 6 × 6 square quadrants). Four performance measures were obtained in the field, including running speed (during bursts of straight running), overall activity (total quadrant entries), entries into open relative to closed quadrants of the field (a behavior often equated with novelty seeking) (Kabbaj et al., 2000), and the number of excreted bolli (a putative measure of “emotionality”). In addition, animals' body weights at the onset of testing were recorded. All of these measures, in combination with performance on learning tasks, were subjected to separate analyses. Pair-wise correlations between each of these five variables as well as between these variables and animals' performance on the five learning tasks are provided in Table 3.
It can be seen in Table 3 that animals' body weights were unsystematically and nonsignificantly related to other performance indices, including those obtained in the five learning tasks. Likewise, running speed in the open field was not correlated with performance on any of the five learning tasks. Total quadrant entries (an index of overall activity) in the open field were unsystematically related to performance on learning tasks, although more activity was positively correlated with better performance in the Lashley maze and fear conditioning tasks. Not surprisingly, running speed and overall activity in the open field were strongly related. Most interestingly, the propensity of animals to explore the open quadrants of the field (i.e., the ratio of entries into open relative to closed quadrants) was directly related to performance on all learning tasks except fear conditioning, i.e., an increase in the proportion of time spent in open areas was associated with more efficient learning (i.e., lower performance scores are indicative of better learning) on four of five tasks. Importantly, the propensity of animals to enter the open areas of the field was unrelated to both overall activity or running speed in the field (r = 0.07, 0.03, respectively). This latter result differentiates the impact of movement from influences more obviously related to exploratory/motivational tendencies. Defecation (number of bolli) in the open field was not significantly correlated either with measure of exploration (overall activity or entries into open quadrants) or with any of the learning measures. Because defecation is often interpreted to reflect emotionality (e.g., fear), this result suggests that variations in emotionality do not influence animals' exploratory behaviors and cannot account for differences between animals in their overall learning performance.
A principal component method of factor analysis extracted three factors to account for these nine variables. Variable loadings on these factors are provided in Table 6. Here we will interpret only the primary factor. Factor 1 accounted for 25% of the total variance, and each of the five learning tasks loads consistently on this factor, suggesting its homology to that factor extracted from performance only on learning tasks (Table 4). Again, running speed, defecation, and body weights loaded weakly on this factor. However, animals' propensity to explore the open areas of the open field also loaded heavily, suggesting that this exploratory tendency is co-regulated with general learning ability, is influenced by general learning ability, or is a determinant of general learning ability.
Table 6.
Unrotated factor loadings; principal component extraction
|
Variable |
Factor 1 |
Factor 2 |
Factor 3 |
|---|---|---|---|
| Lashley maze | 0.72 | 0.07 | −0.13 |
| Passive avoidance | 0.71 | 0.28 | −0.24 |
| Water maze | 0.38 | 0.29 | 0.45 |
| Odor discrimination | 0.54 | 0.27 | 0.14 |
| Fear conditioning | 0.47 | −0.27 | −0.36 |
| Open field (% in open) | −0.59 | −0.36 | −0.32 |
| Open field (total activity) | −0.50 | 0.71 | −0.07 |
| Open field (running speed) | −0.35 | 0.76 | −0.19 |
| Open field (# bolli) | 0.15 | 0.10 | 0.17 |
| Body weight | 0.15 | −0.17 | 0.85 |
| Eigen value | 2.43 | 1.57 | 1.33 |
| Proportion of variance
|
.25
|
.16
|
.13
|
Discussion
In a sample of 56 outbred CD-1 mice, we observed a pattern of results that indicate that individual mice express varying degrees of general learning ability. These results address questions that are at the forefront of research on human cognitive abilities but have been mostly ignored in research efforts with animal subjects.
Analysis of animals' performance on five distinct learning tasks extracted a single factor that accounted for 38% of the variance between individuals across all tasks. It is interesting to note that a general influence on human intelligence test performance (i.e., the g factor) has been variously estimated to account for between 25 and 50% of the variance between individuals (Jensen, 1998; Plomin, 1999; Sternberg, 2000). It is well established that general intelligence abilities (i.e., like those characterized in a standardized IQ test) are co-regulated with or directly impinge on learning, such that indices of learning and intelligence are highly correlated (Kolligian and Sternberg, 1987; Carroll, 1993; for review, see Jensen, 1998). The psychometric and conceptual analogy between intelligence and learning, as well as the degree of explanatory value of the general influence on learning that we find, suggests that the battery of tests described here may be sensitive to a factor analogous to human g. This conclusion must be considered with great caution, however, particularly given the relatively limited number of tests that comprise the present battery and the unlikelihood that they adequately represent all learning abilities. Although the present data indicate the existence of a general learning factor in mice, the proportion of variance in learning accounted for by this factor may not accurately represent its true impact on learning abilities (Jensen and Weng, 1994).
We observed that individuals' entries into the open areas of the open field (relative to entries in areas adjacent to the field's walls) was significantly correlated with performance on four of five learning tasks and loaded heavily in that factor, which accounted for general learning abilities. The propensity to explore the open quadrants of a field is often interpreted as an index of an animal's proclivity for novelty seeking and may reflect the degree to which an animal experiences stress in the unfamiliar open environment (Anderson, 1993; Kabbaj et al., 2000). The relationship of novelty seeking and indices of maze reasoning has been observed previously in laboratory rats (Anderson, 1993). It is notable that among human infants, the degree of preference for novelty is positively correlated with later performance on standardized IQ test batteries (Bornstein and Sigman, 1986; Vietze and Coates, 1986), an observation which further suggests that the general learning factor that we observe in this population of mice might be analogous to the g factor described in humans. Although the nature of this relationship between novelty seeking and learning/intelligence is unknown, it is possible that animals more engaged by novelty are more likely to recognize (or attend to) those environmental relationships on which learning depends. Related to this, animals that are prone to novelty seeking may be less susceptible to the experience or physiological consequences of stress, which in many instances can impede learning (for review, see Shors, 1998). The data reported here do not allow us to distinguish between these (or other) possibilities.
A general influence on cognitive abilities has been described as one of the most stable human quantitative traits (Plomin, 1999), and the elucidation of its brain substrates could have tremendous functional significance. It is thus surprising that so little work has been done to establish the existence of this trait in laboratory animals. An exception is a battery of mixed complex and simple tasks (ranging from complex mazes to avoidance learning) constructed by Thorndike (1935) and assessed with laboratory rats. In this study, positive pair-wise correlations were observed in the performance of animals across all tasks, a pattern of results reported more recently by Anderson (1993). Similarly, Locurto and Scanton (1998) have reported that the performances of individual mice across six distinct spatial navigation tasks were strongly correlated, although the processing requirements of the six tasks may not be sufficiently distinct to conclude that performance was influenced by a general (as opposed to domain-specific) factor. Only one relevant analysis has been attempted with laboratory mice, in which Galsworthy et al. (2002) subjected heterogeneous stock mice to a battery of tests that assessed learning (including in the spatial water maze), memory, and native exploratory behaviors. Galsworthy et al. (2002) reported that ∼30% of the variance between tasks was accounted for by a single factor. Although comparable in magnitude to the general factor found to influence performance in our battery of tests (in which 38% of the variance was accounted for by a single factor), the relatively weaker factor strength reported by Galsworthy et al. (2002) might reflect their explicit intent to include a strong memory component (and other presumed cognitive influences) in their battery of tests. Nonetheless, across species and test batteries, converging evidence is emerging from which to infer the existence in laboratory animals of a general influence on cognitive abilities that transcends sensory, motor, and motivational demands, as well as neuroanatomical learning systems and “domains” of abilities. With an approach like that reported here it will be possible to separate the impact of a manipulation (e.g., a transgene or pharmacological intervention) on specific learning systems from its impact on general learning abilities, a prerequisite for delineating the underlying basis for individual differences in learning and intelligence.
Footnotes
This work was supported by a Busch Foundation Award to L.D.M. Thanks are extended to Drs. Tracey Shors, Ralph Miller, and Mike Galsworthy for discussions relevant to the development of these experiments, and to Randy Gallistel, Ronald Gandelman, and Alex Kusnecov for their comments on an earlier version of this manuscript.
Correspondence should be addressed to Louis D. Matzel, Department of Psychology, Program in Biopsychology and Behavioral Neuroscience, Rutgers University, Busch Campus, Piscataway, NJ 08854. E-mail: matzel@rci.rutgers.edu.
Copyright © 2003 Society for Neuroscience 0270-6474/03/236423-11$15.00/0
References
- Anderson B ( 1993) Evidence in the rat for a general factor that underlies cognitive performance and that relates to brain size: intelligence? Neurosci Lett 153: 98-102. [DOI] [PubMed] [Google Scholar]
- Bolles RC ( 1969) Avoidance and escape learning: simultaneous acquisition of different responses. J Comp Physiol Psychol 68: 355-358. [DOI] [PubMed] [Google Scholar]
- Bornstein M, Sigman M ( 1986) Continuity in mental development from infancy. Child Dev 57: 251-274. [DOI] [PubMed] [Google Scholar]
- Carroll JB ( 1993) Human cognitive abilities. New York: Cambridge UP.
- Galsworthy MJ, Paya-Cano JL, Monleón S, Plomin R ( 2002) Evidence for general cognitive ability (g) in heterogeneous stock mice and an analysis of potential confounds. Genes Brain Behav 1: 88-95. [DOI] [PubMed] [Google Scholar]
- Gilbert PE, Kesner RP, Lee I ( 2001) Dissociating hippocampal subregions: double dissociation between dentate gyrus and CA1. Hippocampus 11: 626-636. [DOI] [PubMed] [Google Scholar]
- Gray JR, Chabris CF, Braver TS ( 2003) Neural mechanisms of general fluid intelligence. Nat Neurosci 6: 316-322. [DOI] [PubMed] [Google Scholar]
- Hampson RE, Rogers G, Lynch G, Deadwyler SA ( 1998) Facilitative effects of the ampakine CX516 on short-term memory in rats: enhancement of delayed-nonmatch-to-sample performance. J Neurosci 18: 2740-2747. [DOI] [PMC free article] [PubMed] [Google Scholar]
- Jensen AR ( 1998) The g factor: the science of mental ability (human evolution, behavior, and intelligence). New York: Praeger.
- Jensen AR, Weng L-J ( 1994) What is a good g? Intelligence 18: 231-258. [Google Scholar]
- Kabbaj M, Devine DP, Savage VR, Akil H ( 2000) Neurobiological correlates of individual differences in novelty-seeking behavior in the rat: differential expression of stress-related molecules. J Neurosci 20: 6983-6988. [DOI] [PMC free article] [PubMed] [Google Scholar]
- Kolligian Jr J, Sternberg RJ ( 1987) Intelligence, information processing, and specific learning disabilities: a triarchic synthesis. J Learn Dis 20: 8-17. [DOI] [PubMed] [Google Scholar]
- Lavond DG, Kim JJ, Thompson RF ( 1993) Mammalian brain substrates of aversive classical conditioning. Annu Rev Psychol 44: 317-342. [DOI] [PubMed] [Google Scholar]
- LeDoux JE ( 2000) Emotion circuits in the brain. Annu Rev Neurosci 23: 155-184. [DOI] [PubMed] [Google Scholar]
- Locurto C, Scanlon C ( 1998) Individual differences and a spatial learning factor in two strains of mice. J Comp Psychol 112: 344-352. [Google Scholar]
- Mackintosh NJ ( 1998) IQ and human intelligence. Oxford: Oxford UP.
- Matzel LD, Gandhi CC ( 2000) The tractable contribution of synapses and their component molecules to individual differences in learning. Behav Brain Res 18: 200-214. [DOI] [PubMed] [Google Scholar]
- Morris RGM ( 1974) Pavlovian conditioned inhibition of fear during shuttlebox avoidance behavior. Learn Motiv 5: 424-447. [Google Scholar]
- Morris RGM ( 1981) Spatial localization does not require the presence of local cues. Learn Motiv 12: 239-260. [Google Scholar]
- Plomin R ( 1999) Genetics and general cognitive ability. Nature [Suppl] 402: C25-C29. [DOI] [PubMed] [Google Scholar]
- Plomin R ( 2001) The genetics of g in human and mouse. Nat Rev Neurosci 2: 136-141. [DOI] [PubMed] [Google Scholar]
- Plomin R, Spinath FM ( 2002) Genetics and general cognitive ability (g). Trends Cogn Sci 6: 169-176. [DOI] [PubMed] [Google Scholar]
- Sara SJ, Roullet P, Przybyslawski J ( 2001) Consolidation of memory for odor-reward association: B-adrenergic receptor involvement in the late phase. Learn Memory 6: 88-96. [PMC free article] [PubMed] [Google Scholar]
- Shors TJ ( 1998) Stress and sex effects on associative learning: for better or for worse. Neuroscientist 4: 353-364. [Google Scholar]
- Shors TJ, Servatius RJ, Thompson RF, Rogers G, Lynch G ( 1995) Enhanced glutamatergic neurotransmission facilitates classical conditioning in the freely moving rat. Neurosci Lett 186: 153-156. [DOI] [PubMed] [Google Scholar]
- Squire LR, Zola-Morgan S ( 1991) The medial temporal lobe memory system. Science 253: 1380-1386. [DOI] [PubMed] [Google Scholar]
- Staubli U, Rogers G, Lynch G ( 1994) Facilitation of glutamate receptors enhances memory. Proc Natl Acad Sci USA 91: 777-781. [DOI] [PMC free article] [PubMed] [Google Scholar]
- Sternberg RJ ( 1997) Intelligence and life-long learning. Am Psychol 52: 1134-1139. [DOI] [PubMed] [Google Scholar]
- Sternberg RJ ( 2000) Cognition. The holy grail of general intelligence. Science 289: 399-401. [DOI] [PubMed] [Google Scholar]
- Sternberg RJ, Kaufman JC ( 1998) Human abilities. Annu Rev Psychol 49: 479-502. [DOI] [PubMed] [Google Scholar]
- Tang YP, Shimizu E, Dube GR, Rampon C, Kerchner GA, Zhuo M, Liu G, Tsien JZ ( 1999) Genetic enhancement of learning and memory in mice. Nature 401: 63-69. [DOI] [PubMed] [Google Scholar]
- Thorndike RL ( 1935) Organization of behavior in the albino rat. Psychol Monographs 17: 1-70. [Google Scholar]
- Vietze P, Coates D ( 1986) Information-processing approaches to early identification of mental retardation. In: Mental retardation: research, education, and technology transfer (Wisniewski H, Snyder D, eds), pp 266-276. New York: New York Academy of Sciences. [DOI] [PubMed]