

Abstract
The intracellular Ca2+ sensitivity of synaptic vesicle fusion is an important determinant of transmitter release probability, but it is unknown for most CNS synapses. We combined whole-cell membrane capacitance measurements and Ca2+ uncaging at the large calyx of Held nerve terminals to determine the Ca2+ sensitivity of synaptic vesicle fusion at a glutamatergic CNS synapse, independent of recording EPSCs. Capacitance increases measured 30-50 msec after elevating the intracellular Ca2+ concentration ([Ca2+]i) by Ca2+ uncaging were half-maximal at ∼5 μm [Ca2+]i. At 10 μm [Ca2+]i, capacitance increases reached maximal values (256 ± 125 fF; mean ± SD), indicating the depletion of an average pool of ∼4000 readily releasable vesicles. Vesicle pool depletion was confirmed in cross-depletion experiments, in which capacitance responses were measured after Ca2+ uncaging, or after combined stimuli of prolonged presynaptic depolarizations and Ca2+ uncaging. To analyze the Ca2+-dependent rates of vesicle pool depletion, the capacitance rise after Ca2+ uncaging was fitted with single- or double-exponential functions. The fast time constants of double-exponential fits, and the time constants of single-exponential fits were 2-3 msec at 10-15 μm [Ca2+]i and reached submillisecond values at 30 μm [Ca2+]i. These results suggest that three to five readily releasable vesicles can fuse within <1 msec at each active zone of a calyx of Held, given that [Ca2+]i rises sufficiently high. Submillisecond kinetics of exocytosis are reached at significantly lower [Ca2+]i than at ribbon-type sensory synapses previously investigated by capacitance measurements.
Keywords: synaptic transmission, vesicle fusion, readily releasable pool, release probability, calcium sensitivity, Synaptotagmin
Introduction
At most CNS synapses, as well as at neuromuscular junctions, transmitter release is triggered by brief presynaptic action potentials that admit Ca2+ influx into the nerve terminal (Katz, 1969). The intracellular Ca2+ concentration, [Ca2+]i, relevant for vesicle fusion builds up in local microdomains near the open Ca2+ channels (Simon and Llinás, 1985; Yamada and Zucker, 1992; Roberts, 1994), and binding of several Ca2+ ions to a Ca2+ sensor, probably represented by the vesicle protein Synaptotagmin (Brose et al., 1992; Geppert et al., 1994; Fernández-Chacón et al., 2001), initiates vesicle fusion. In this process, the Ca2+ sensitivity of vesicle fusion is a major determinant for the transmitter release probability at synapses, besides the exact distance and geometrical arrangement between vesicles and Ca2+ channels (Neher, 1998; Meinrenken et al., 2002). The intracellular Ca2+ sensitivity of vesicle fusion is, however, not known for most CNS synapses, because the microdomain Ca2+ signal relevant for vesicle fusion cannot be quantified directly with current imaging techniques.
By using Ca2+ uncaging to produce a spatially homogenous cytosolic [Ca2+]i signal, the Ca2+ sensitivity of transmitter release has recently been estimated at the large calyx of Held nerve terminals (Forsythe, 1994; Borst et al., 1995), which form excitatory, glutamatergic synaptic connections in the auditory brainstem circuitry. By combining presynaptic Ca2+ uncaging with measurements of EPSCs, it was found that notable transmitter release was triggered by Ca2+ elevations to ∼1 μm, and large and rapidly rising EPSCs were observed at 10-20 μm [Ca2+]i (Bollmann et al., 2000; Schneggenburger and Neher, 2000; Felmy et al., 2003). These estimates of the intracellular Ca2+ requirement for rapid transmitter release are significantly lower than the previous ones of ∼100 μm [Ca2+]i, which were inferred from theoretical analyses of the microdomain [Ca2+]i signal (Simon and Llinás, 1985; Yamada and Zucker, 1992) and from experiments at the squid giant synapse (Adler et al., 1991; Llinás et al., 1992; Hsu et al., 1996). Also, membrane capacitance measurements combined with Ca2+ uncaging at the ribbon-type synapses of retinal bipolar cells (Heidelberger et al., 1994) and inner hair cells of the cochlea (Beutner et al., 2001) have indicated higher Ca2+ requirements for rapid vesicle fusion than the ones estimated at the calyx of Held.
With capacitance measurements, the Ca2+-dependent rate of vesicle fusion can be analyzed from the kinetics of the depletion of a limited pool of readily releasable vesicles (Thomas et al., 1993; Heinemann et al., 1994). This analysis relates to the question of how fast a pool, or subpool, of readily releasable vesicles can be released at saturating Ca2+ concentration (Almers, 1994). This exocytotic time is probably well below 1 msec for rapidly releasing synapses; it is, however, not known which fraction of the readily releasable pool of vesicles can, in principle, be released at such high rates. At active zones of CNS synapses, the readily releasable pool consists of ∼3-10 docked vesicles (Schikorski and Stevens, 2001; Xu-Friedman et al., 2001; Sätzler et al., 2002; Taschenberger et al., 2002). With very strong Ca2+ stimuli, the resulting multivesicular release at individual active zones will lead to saturation of postsynaptic AMPA receptors (Meyer et al., 2001; Sun and Wu, 2001; Wadiche and Jahr, 2001). If AMPA receptors saturate, or desensitize before a sizeable fraction of the readily releasable pool has been released, then the time course of vesicle pool depletion would be underestimated. We were therefore interested to measure the kinetics of vesicle pool depletion with a method that does not depend on measurements of EPSCs. Here, we apply presynaptic membrane capacitance measurements (Sun and Wu, 2001) combined with Ca2+ uncaging to quantify the Ca2+ sensitivity of synaptic vesicle pool depletion at the calyx of Held.
Materials and Methods
Slice preparation and solutions. Slices containing the medial nucleus of the trapezoid body were prepared from 8- to 10-d-old Wistar rats. In an attempt to cut the axon close to the calyx of Held nerve terminals (Borst and Sakmann, 1998; Sun and Wu, 2001), we prepared transverse slices at an angle of 30-40° with respect to the sagittal plane. The extracellular solution contained (in mm): 125 NaCl, 25 NaHCO3, 2.5 KCl, 1.25 NaH2PO4, 1 MgCl2, 2 CaCl2, 25 glucose, 0.4 ascorbic acid, 3 myoinositol, and 2 Na-pyruvate, pH 7.4 when bubbled with 95% O2-5% CO2. During recording under standard conditions, the extracellular solution also contained 50 μm d-(-)-2-amino-5-phosphonopentanoic acid, 10 μm 2,3-dioxo-6-nitro-1,2,3,4-tetrahydrobenzo[f]quinoxaline-7-sulfonamide (NBQX), 1 μm TTX, and 10 mm TEA+, to block the generation of EPSPs in the postsynaptic cell, as well as to block presynaptic K+ and Na+ conductances. The standard intracellular solution contained (in mm): 130 Cs-gluconate, 20 TEA-Cl, 20 HEPES, 5 Na2ATP, 0.3 Na2GTP, 0.1 fura-2FF, 1.5 (3) DM-nitrophen, 1.3 (2.4) CaCl2, and 0.5 (1.0) MgCl2. In this solution, most of the Mg2+ will be bound to ATP. In some experiments, CsCl was used instead of Cs-gluconate (see Fig. 2C, filled circles). In yet another set of experiments, 140 mm KCl was used instead of Cs-gluconate and TEA-Cl in the intracellular solution, and TEA+ was omitted from the extracellular solution (see Fig. 2 B). Experiments were done at room temperature (21-24°C).
Figure 2.

Changes in membrane capacitance and membrane conductance induced by Ca2+ uncaging at the calyx of Held. A, Example of a typical flash-photolysis experiment made with the Cs-gluconate intracellular solution. The traces, from top to bottom, represent presynaptic [Ca2+]i (measured by ratiometric imaging of the Ca2+ indicator fura-2FF), membrane capacitance (Cm), membrane current (I), membrane conductance (Gm), and access conductance (Ga). The amplitude of the Cm increase was analyzed as the difference between the basal Cm and the temporal average of Cm in a window of 30-50 msec after the flash (see white bars in Cm trace). The amplitudes of the Ca2+-induced changes in Cm and Gm were also compared for times early and late after flashes (see brackets near Gm trace). B, Ca2+-activated currents (ΔI) were measured at varying holding potentials (Vm), with a KCl intracellular solution, and without TEA+ in the extracellular solution (n = 4 cells). Each data point represents the average of two to six independent measurements. The linear fit in a range of -70 to -90 mV indicates a slope conductance of 1.4 nS. C, Current-voltage relationship with Cs+-containing intracellular solutions and with 10 mm TEA+ present in the extracellular solution. Closed circles represent the averages of two to six independent measurements with intracellular CsCl solution (n = 12 cells). In this and all subsequent Figures, average data points with error bars represent mean ± SD values. The linear fit to these average data points indicated a slope conductance of 0.42 nS and an extrapolated reversal potential of -10 mV. The average Ca2+-activated current measured with the standard Cs-gluconate intracellular solution at -80 mV is also shown (open triangle; n = 20 cells). This symbol is slightly left-shifted on the x-axis for clarity. Vm, XXX.
Data analysis. For fitting the time course of current relaxations after hyperpolarizing steps (Fig. 1 A), as well as for fitting the time course of capacitance changes after Ca2+ uncaging (see Fig. 5), single- and double-exponential fits were made in IgorPro (WaveMetrics, Lake Oswego, OR). Double-exponential fits were accepted if the time constants for the fast and the slow component differed by more than threefold and if the amplitude of each component contributed at least 10%. If one of the two criteria was not met, a single-exponential function was regarded as the better fit. Results are expressed as mean ± SD values.
Figure 1.
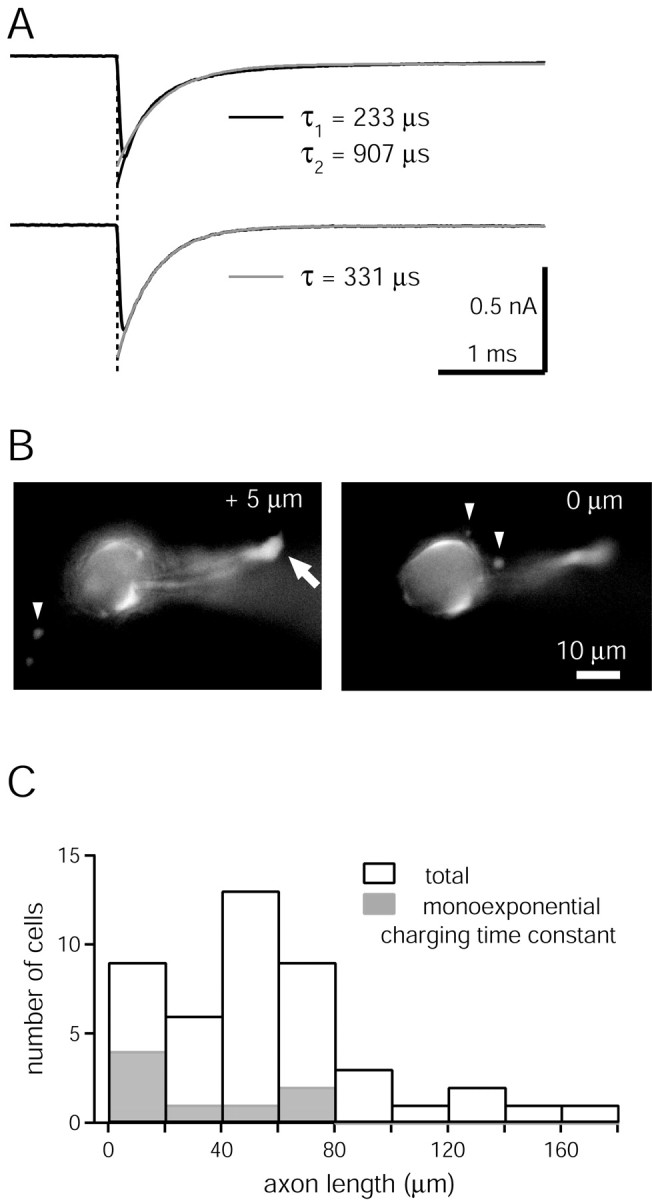
Electrotonic properties of calyx of Held nerve terminals. A, The charging currents in response to 10 mV hyperpolarizing voltage steps were fitted with exponential functions. For the cell shown at the top, a double-exponential fit (black trace) was found necessary, whereas the charging currents of the cell shown at the bottom could be fitted by a single exponential (gray trace). The acceptance criteria for single- and double-exponential fits are given in Materials and Methods. B, Fluorescence images of a calyx of Held filled with 100 μm fura-2FF, taken at two focal depths. In the left image, the cut axon close to the slice surface can be identified (arrow). Filopodial extensions are also visible (arrowheads). This cell had an axon length of 48 μm and a monoexponential membrane charging time constant. C, Histogram of the axon lengths for the calyces used in this study (n = 45; open bars). A histogram for the calyces with monoexponential charging time constant is superimposed (n = 8; gray bars). Note that the cut axon at the slice surface could be identified only in 9 of 45 calyces (see B for an example); in all of the other calyces, the axon length must be regarded as a minimal estimate. In the group of calyces with axon lengths <20 μm, a cut axon was identified in seven of nine calyces.
Figure 5.
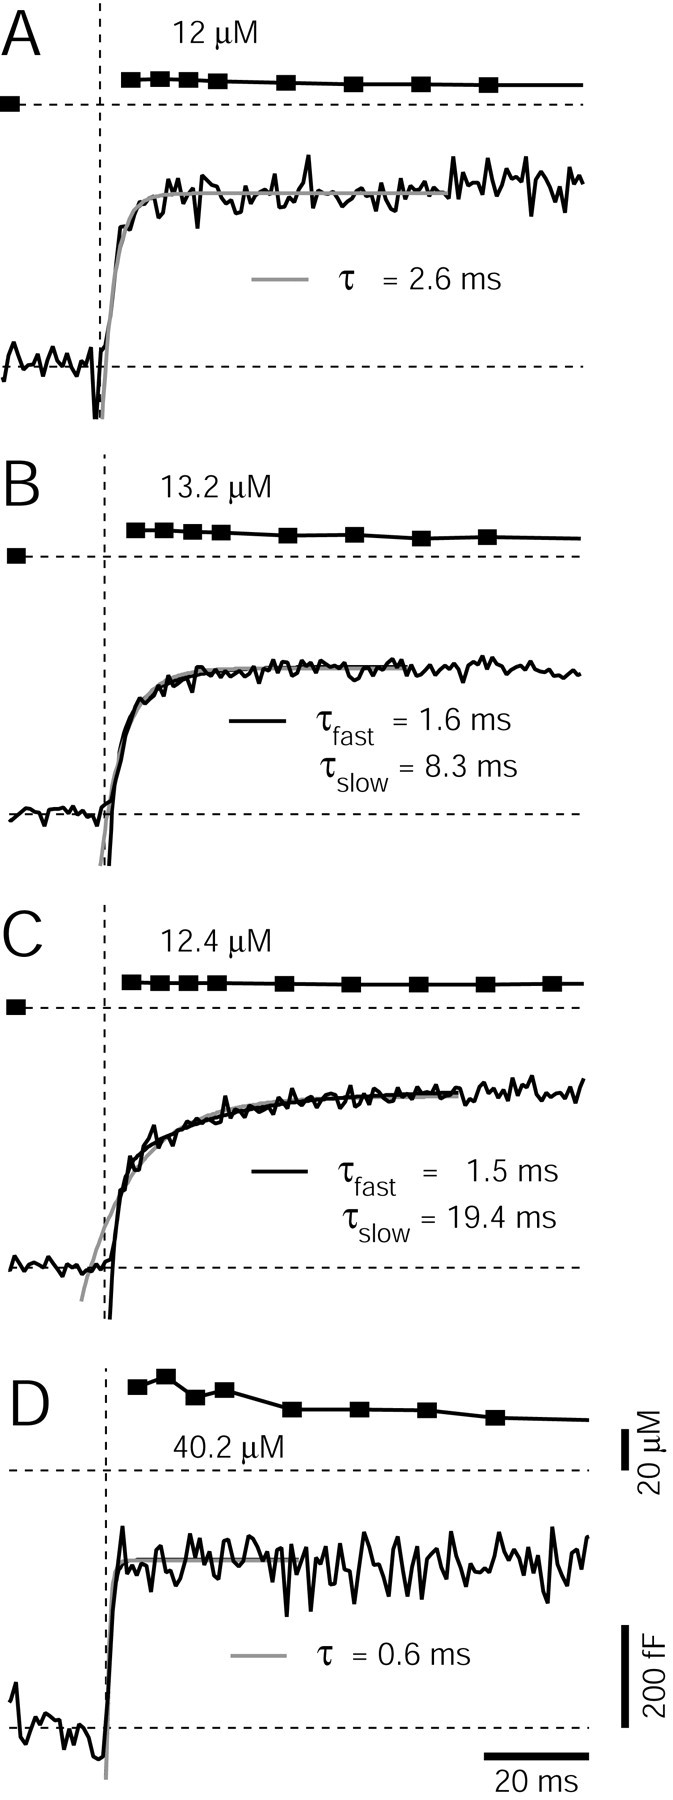
Analyzing the time course of Cm increase as an indicator of the rate of vesicle pool depletion. A-C, Cm increases in response to flashes that elevated [Ca2+]i in a range of 10-15 μm are shown for three different calyces. Each Cm trace was fitted by single- and double-exponential functions (gray and black lines, respectively). In A, a single-exponential fit was found sufficient, whereas in B and C, double exponentials were necessary to fit the rise in Cm, according to the criteria outlined in Materials and Methods. D, The Cm increase in response to a flash that elevated [Ca2+]i to 40 μm. A single exponential with time constant of 0.6 msec fitted the Cm increase. The scale bars also apply to the traces shown in A-C.
Membrane capacitance measurements. Whole-cell recordings of calyx of Held nerve terminals were made with an EPC-9/2 patch-clamp amplifier (HEKA Elektronik, Lambrecht, Germany). Membrane capacitance (Cm) was measured with the software lock-in extension of the Pulse software (HEKA Elektronik), using the sine plus DC technique (Gillis, 2000) with a 70 mV peak-to-peak sine wave at 2 kHz, or 1 kHz in some experiments. The holding potential was -80 mV. Basal Cm and the series resistance at the time of the first flash were 22.4 ± 7.0 pF and 13.5 ± 3.9 MΩ, respectively (n = 45 cells). During recordings, the capacitance cancellation circuit of the EPC9/2 was active, but the series resistance compensation was off. The reversal potential in the lock-in software was set to 0 mV, close to the estimated reversal potential of a Ca2+-activated conductance measured with the standard Cs+- and TEA+-containing solutions (see Fig. 2C). However, the Cm changes calculated by the lock-in software did not change significantly (<1% change of ΔCm) when the reversal potential was arbitrarily set to values in the range of -40 to +40 mV.
Electrotonic properties of calyx of Held nerve terminals. Most available methods for rapid lock-in measurements of Cm, such as the sine plus DC technique used here, assume that the cell under study can be described by a single-compartment resistance-capacitance network (Gillis, 2000). We therefore assessed the electrotonic parameters of each calyx, by recording the voltage-clamp charging currents in response to 10 mV hyperpolarizing steps at the beginning of each recording (Fig. 1). In each case, charging transients were fitted with a single- and a double-exponential function (Fig. 1 A). In most cells (37 of 45), double exponentials were necessary to accurately describe the relaxation of the charging currents, with average fast and slow decay time constants of 153 ± 91 and 731 ± 337 μsec, respectively (n = 37 cells) (Fig. 1 A, top panel). In 8 of 45 cells, single exponentials were sufficient (Fig. 1 A, bottom panel).
To correlate the electrotonic properties of calyces with their morphology, we measured the axon length from fluorescence images taken at the end of each experiment, by exciting fura-2FF at 380 nm wavelength (Fig. 1 B). We found that the chance of observing a monoexponential charging time constant was higher in calyces with short axons (Fig. 1C) (Borst and Sakmann, 1998; Sun and Wu, 2001). Nevertheless, we also found calyces with double-exponential charging time-constants for axon lengths <20 μm (n = 5 of 9 calyces) (Fig. 1C).
These findings indicate that most calyces studied here could not be approximated with a single-compartment electrotonic model, maybe because of the filopodial extensions close to the calyx (Fig. 1 B, arrowheads) and/or because of the presence of an axon of >20 μm length. We therefore asked how a second, slowly charging membrane compartment, in combination with a Ca2+-activated conductance increase (see Results and Fig. 2) would influence Cm changes obtained from lock-in measurements. Model calculations for an electrotonic two-compartment model (not shown), with realistic values of Cm and membrane conductance (Gm) for both compartments, showed that a conductance increase localized in the second (slowly charging) electrotonic compartment can lead to an apparent reduction of Cm from lock-in measurements at the first compartment. The effect was moderate, however: Assuming that a Ca2+-activated conductance of 0.5 nS (see Fig. 2C) was localized exclusively in the second (axonal) compartment, a reduction in Cm of 23 fF was calculated for a sine-wave frequency of 2 kHz. This error is small, but not negligible, when compared with the Cm increases typically observed (∼100-600 fF) (see Figs. 2, 3, 4, 5). To further verify the validity of our Cm measurements, we grouped the data according to cells with single- or double-exponential decays in their charging transients. Both groups of cells had Cm changes with similar amplitudes and time courses after Ca2+ uncaging (see Figs. 3D and 6 A; gray symbols are data obtained from cells with single-exponential charging currents).
Figure 3.

The amplitudes of Cm increases are maximal for [Ca2+]i steps higher than 10 μm. A-C, [Ca2+]i traces (top panels), Cm traces (middle panels), and Gm traces (bottom panels) are shown for a calyx in which flashes with increasing intensity were given. White bars superimposed onto Cm traces indicate 20 msec time intervals used for the analysis of Cm amplitudes. D, Amplitude of Cm increase as a function of [Ca2+]i for n = 77 flash responses (open squares) obtained in 45 calyces. The amplitudes were analyzed in a time window of 30-50 msec after the flash, as shown in A-C. The data points marked by additional gray squares were obtained from n = 8 calyces with single-exponential charging currents (Fig. 1). The average Cm increase for [Ca2+]i steps to >10 μm was similar for cells with single- and double-exponential charging currents (gray average square and open average square, respectively). The horizontal dotted line is a linear regression analysis for [Ca2+]i of >10 μm. Filled black squares represent binned and averaged data points. A prediction of the model of cooperative Ca2+ binding and vesicle fusion (Fig. 7E) is shown by the gray line plotted on the right axis. For the model calculations, the cumulative amount of vesicle fusion in a time interval of 30-50 msec was calculated from simulations like the ones shown in Figure 7B, with the parameters of the model set to the values reported in Schneggenburger and Neher (2000). Cum., Cumulative.
Figure 4.

Cross-depletion experiments indicate that a pool of readily releasable vesicles is depleted by [Ca2+]i steps >10 μm. A, [Ca2+]i, Cm, and current trace for a control flash. In this and all subsequent panels, white bars superimposed onto Cm traces indicate the time intervals used for the analysis of Cm amplitudes. B, A 32 msec depolarization to 0 mV, preceded by a 4 msec interval at +80 mV to open Ca2+ channels more quickly, was followed by a flash with the same intensity as in A. The Ca2+ current caused a Cm jump of 248 fF as analyzed in a 15 msec interval preceding the flash. Note the rapid, partial decay of the Cm trace at times shortly after repolarization (<5 msec; see arrows in B and E), which we attribute to the relaxation of voltage-gated conductances. The flash-evoked Ca2+ increase did not induce any additional rise in Cm. C, Amplitudes of Cm increases attained after control flashes (left bar), after depolarizations to 0 mV for 32 msec (middle bar), and in a 30-50 msec analysis window after the depolarization and the flash (B). Data points for the individual calyces (n = 3) are also shown. D-F, Similar experiment as in A-C, but using shorter depolarizations of 8 msec. The depolarization-induced Cm increase was approximately one-half of the one induced by control flashes. Note that the Cm response to control flashes agreed well with the Cm response to combined stimuli across individual calyces (compare left and right bar in F).dep., Depolarization.
Figure 6.
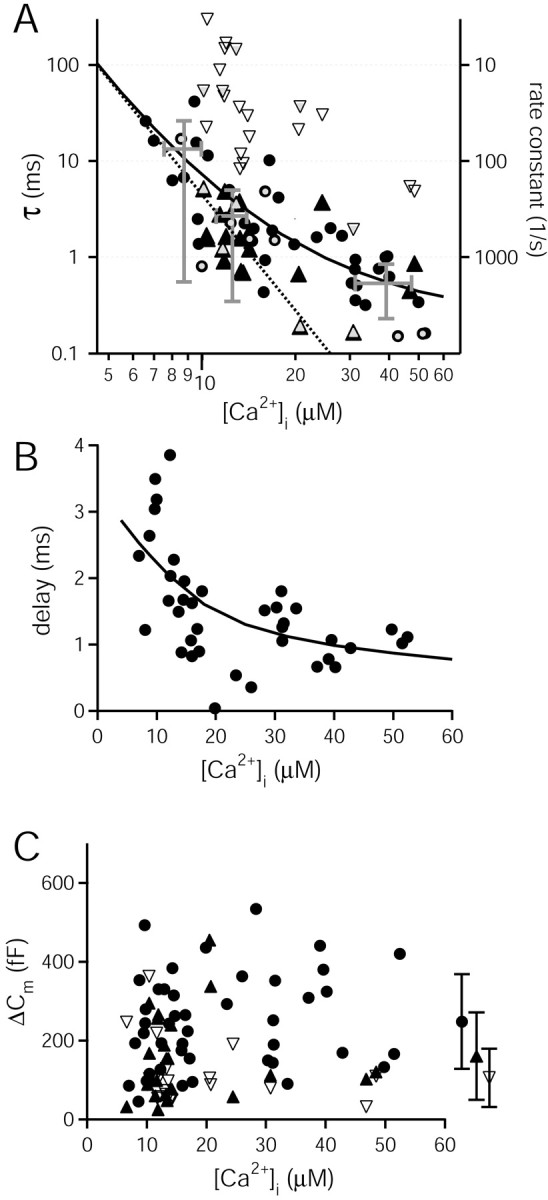
Ca2+ dependence of the rate of vesicle pool depletion at the calyx of Held. A, Plot of the time constants of vesicle pool depletion as a function of [Ca2+]i attained after flashes. Cm responses that were fitted by single exponentials are shown by filled black circles (n = 44 responses). The fast and the slow components of Cm responses with double-exponential rise (n = 21) are represented by filled and open triangles, respectively. The solid line is the prediction of the kinetic scheme shown in Figure 7E, with the following parameters: kon, 9 × 10⁷m-1 · sec-1; koff, 9500 sec-1, γ, 6000 sec-1, and b, 0.25, as in Schneggenburger and Neher (2000). Data points marked by additional gray symbols were obtained from calyces with single-exponential voltage-clamp charging currents (Fig. 1). The dotted line indicates a slope of 4 in the double-logarithmic plot. B, Delay of the Cm response as a function of [Ca2+]i. Delays were taken as the x-axis intercept of the extrapolated single-exponential fits to Cm increases. The line is the prediction of the model shown in Figure 7E, with the same parameter set as in A. C, Plot of the amplitude of Cm increases as estimated from single-exponential fits (circles), or from the fast and the slow component of double-exponential fits (filled and open triangles, respectively). Average symbols represent the corresponding mean ± SD values averaged over all of the [Ca2+]i values.
Calculations for a model of cooperative Ca2+ binding and vesicle fusion. The kinetic scheme of Figure 7E was solved by numerical integration with the Euler method. For the model predictions of Figures 3D and 6, the kinetic scheme was driven by the [Ca2+]i waveform shown in Figure 7A (continuous line), calculated from the measured time course of the flash lamp as described previously (Felmy et al., 2003). For the predictions in Figure 7, the kinetic scheme was driven by a simple step-like increase of [Ca2+] (A, dotted line). In both cases, the simulations for each final [Ca2+] yielded the accumulation of vesicles in the fused state, like those shown in Figure 7B. These traces were fitted by single-exponential functions (see Fig. 7B, dotted lines), starting at the point of the steepest rise, to predict the time course of vesicle pool depletion. The x-axis intercept of the exponentials were taken as the delay of the Cm response. The occupancy of the Ca2+ sensor (see Fig. 7C) was simulated after omitting the final, irreversible fusion step from the kinetic scheme in E. Steady-state Ca2+ binding (see Fig. 7D, open circles) was taken from the occupancy reached at the end of 400 msec simulation traces. For the prediction in Figure 3D, the cumulative vesicle fusion normalized to the pool size was calculated for a time window of 30-50 msec after the flash.
Figure 7.
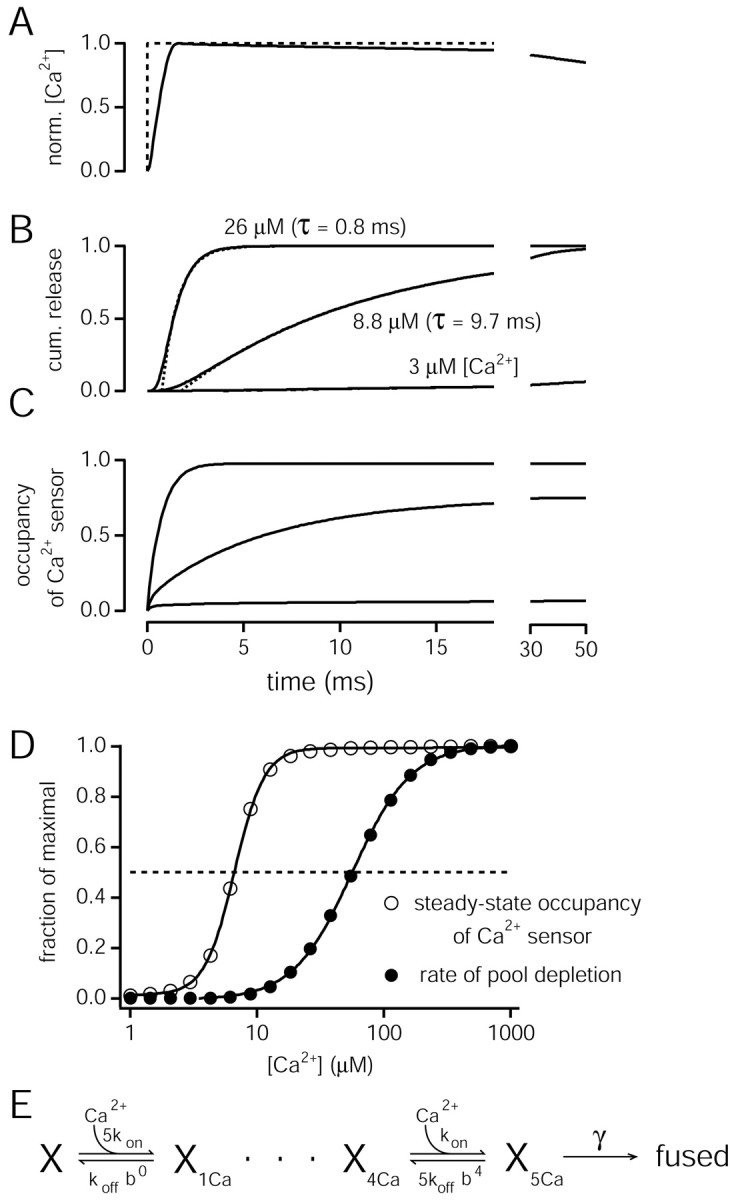
Simulations of the kinetic and equilibrium properties of Ca2+ binding and vesicle fusion. A, An ideal [Ca2+]i step (dashed line) and the calculated time course of the rise in [Ca2+]i produced by Ca2+ uncaging (solid line) (see Material and Methods). norm., Normalized. B, Simulated accumulation of vesicles in the fused state for three [Ca2+]i steps to the indicated amplitude. cum., Cumulative. C, Occupancy of the Ca2+ sensor for vesicle fusion for the same [Ca2+]i steps as in B. The occupancy was calculated after omitting the irreversible fusion step from the scheme in E. Note that a [Ca2+]i step to 8.8 μm leads to a steady-state occupancy of >50%. In contrast, the kinetics of vesicle fusion for the same [Ca2+]i step has a time constant of pool depletion of 9.7 msec (B, middle trace), much slower than the expected half-maximal value of (1/γ) × 2, which corresponds to ∼350 μsec. D, Ca2+ dependence of the steady-state occupancy of the Ca2+ sensor (open circles) and of the rate of vesicle pool depletion (closed circles), both normalized to maximal values. Note the leftward shift of the steady-state Ca2+ occupancy with respect to the Ca2+ dependence of the rates of vesicle pool depletion. The simulation results were obtained with the model parameters given in Figure 6 and were fitted by Hill equations (lines). E, Kinetic scheme of cooperative Ca2+ binding and vesicle fusion used for the model predictions. Note that, with b < 1, the off-rates of higher bound states will be increasingly reduced, thus introducing positive cooperativity of Ca2+ binding (Heidelberger et al., 1994).
The simple model of Figure 7E with the parameters used here applies to a fast component of vesicle fusion (see Fig. 6 A, filled symbols). If a slow release component at the calyx of Held (Sakaba and Neher, 2001) is caused by vesicles with intrinsically lower Ca2+ sensitivity or lower final fusion rate, then a more complex model with at least two sets of parameters would be necessary.
Ca2+ uncaging and Ca2+ imaging. Ca2+-loaded DM-nitrophen was photolyzed by a light pulse from a flash lamp (1.1 msec half-width; Rapp Optoelektronik, Hamburg, Germany), limited to a wavelength of <390 nm by a Schott UG 1 filter (Itos, Mainz, Germany). The fluorescence of the Ca2+ indicator, fura-2FF, was excited by light of 350 and 380 nm wavelengths, produced by a monochromator (T.I.L.L. Photonics, Gräfelfing, Germany). The excitation light from the flash lamp and the monochromator were fed via quartz lightguides into the upright microscope (Axioskop; Zeiss, Oberkochen, Germany) and were combined by a sapphire window (Linos Photonics, Göttingen, Germany) in the two-port epifluorescence condenser (T.I.L.L. Photonics) of the microscope. An area of 50 × 50 μm in the image plane was illuminated by the flash lamp, set by a field stop in the flash-light illumination pathway. In some experiments, the intensity of the flash light was attenuated by neutral density filters (transmittance of 10, 32, or 50%).
For Ca2+ imaging, an interline-transfer CCD chip (480 × 640 pixel; T.I.L.L. Photonics) was used with pixel binning of 8 × 15, allowing for short exposure times of 5 msec. Fura-2FF images were taken at alternating excitation wavelengths of 380 and 350 nm, except for a period immediately after the flash, during which four consecutive images at 380 nm were taken. Off-line analysis of [Ca2+]i was done by extracting fluorescence values from single superpixels or from small regions of interest, corresponding to calyx regions or to a background region in the slice devoid of calyceal processes. The fluorescence values were transferred to a data analysis program (IgorPro), and the fluorescence ratio R was calculated as F350/F380 after background subtraction. [Ca2+]i was calculated from the fluorescence ratio R according to the equation derived by Grynkiewicz et al. (1985). The calibration was a modified three-point calibration (Felmy et al., 2003). In brief, the fluorescence of fura-2FF was measured in buffered Ca2+ solutions with defined Ca2+ concentrations, in the presence of 1.5 mm DM-nitrophen. The limiting ratios at low Ca2+ (Rmin; 10 mm EGTA) and at an intermediate Ca2+ concentration (Rint; 10 μm) were confirmed by in vivo calibration measurements, during which strongly buffered Ca2+ calibration solutions were loaded via a patch pipette into a calyx of Held. The calibration constants were corrected for the effects of photolysis of DM-nitrophen (Zucker, 1992), as described by Heinemann et al. (1994). This gave a slightly decreased Rmax, a slightly increased Keff, and an unchanged value for Rmin [for the meaning of these calibration parameters, see Felmy et al. (2003), their Eq. 1].
Results
Capacitance increases and Ca2+-activated conductances after Ca2+ uncaging
We made whole-cell patch-clamp recordings from calyx of Held nerve terminals in slices from 8- to 10-d-old rats, and recorded membrane capacitance (Cm) after step-like elevations of [Ca2+]i, produced by flash-photolysis of the Ca2+-loaded photolyzable chelator, DM-nitrophen. Figure 2 shows a typical Cm change triggered by Ca2+ uncaging in a calyx of Held nerve terminal, using the standard Cs-gluconate intracellular solution. The flash elevated [Ca2+]i to 22.9 μm, as measured by the ratiometric fluorescent Ca2+ indicator fura-2FF (Fig. 2A, top panel). Membrane capacitance increased by 276 fF in a time window of 30-50 msec after the flash, and showed a slow, sustained increase up to the end of the observation interval of 300 msec (Fig. 2A). On average, at 250 msec after the flash, the increase in Cm was 111 ± 17.2% (n = 17) of the value measured at 50 msec. In parallel to the increase in Cm, there was an inward current with a peak amplitude of -55 pA at 14 msec after the flash, corresponding to a membrane conductance increase of 0.7 nS (Fig. 2A). The amplitude of these conductance changes depended on the level of [Ca2+]i attained after the flash (Fig. 3A-C). The conductance decreased to 79.6 ± 11.3% of its peak value at 250 msec after the flash. Thus, the time course of the conductance change was not strictly correlated with the time course of Cm.
We attempted to suppress the Ca2+-activated conductance, to minimize the possible influence of a conductance change on the quantification of membrane capacitance from lock-in measurements (see Materials and Methods). For this purpose, we first investigated the ionic mechanism(s) of the Ca2+-activated conductance. We repeated measurements similar to the ones shown in Figure 2A, now using a K+-based intracellular solution, in the absence of extracellular TEA+ (see Materials and Methods). Under these ionic conditions, the Ca2+-activated currents reversed close to -80 mV, with an average slope conductance of 1.4 nS in a range of -70 to -90 mV (Fig. 2B). With a CsCl-based intracellular solution and 10 mm TEA+ in the extracellular solution, the Ca2+-activated currents were inward up to a membrane potential of -40 mV, with a reduced average conductance of 0.42 nS, and a reversal potential of -10 mV as estimated by linear extrapolation (Fig. 2C, filled circles). Replacing Cl- with gluconate in the intracellular solution did not lead to a reduction of the Ca2+-activated current at -80 mV (Fig. 2C, average triangle), indicating that the current was not carried by Cl-. It is possible that the inward current was mediated by small conductance (sK-type) Ca2+-activated K+ channels (Tucker and Fettiplace, 1996). However, addition of apamine (0.2 μm) and bicuculline (10 μm), which block sK-type Ca2+-activated K+ channels (Hugues et al., 1982; Johnson and Seutin, 1997), did not reduce the residual Ca2+-activated conductance. Specifically, with the Cs-gluconate containing intracellular solution at -80 mV, the Ca2+-activated inward currents were -45.3 ± 18 pA (n = 10 cells) with 0.2 μm apamine, -39.2 ± 12.8 pA (n = 6 cells) with 0.2 μm apamine and 10 μm bicuculline, and -47 ± 29 pA under control conditions (n = 20 cells) (Fig. 2C, triangle).
These experiments indicate that a Ca2+-activated K+ current is present in calyx of Held nerve terminals (Fig. 2B), and this current can be blocked by Cs+ and TEA+ (Fig. 2C). The residual current in the presence of Cs+ and TEA+ is not carried by Cl- (Fig. 2C), and it is not mediated by apamine-sensitive sK channels. Its estimated reversal potential of -10 mV or higher is compatible with a contribution by Ca2+-activated, nonselective cation channels, and/or by an electrogenic exchanger such as the Na+-Ca2+ exchanger. Indeed, when we replaced the standard extracellular solution with a Na+-free solution containing 150 mmN-methyl-d-glucamine, the Ca2+-activated currents were reduced from the control value of -37 ± 18 pA (n = 12 cells with CsCl) to -4.2 ± 5.5 pA (n = 5 cells). However, under these conditions, the basal [Ca2+]i values were strongly increased, a condition that was not suitable for making Cm measurements. In all of the experiments shown subsequently, we used the Cs-gluconate internal solution with the standard, Na+-containing extracellular solution supplemented with 10 mm TEA+ (see Materials and Methods).
Vesicle pool depletion occurs with [Ca2+]i steps >10 μm
We next studied the amplitude of Cm changes as a function of step-like increases in [Ca2+]i produced by Ca2+ uncaging (Fig. 3). In the example of Figure 3A, a flash with attenuated intensity elevated [Ca2+]i to 3.1 μm, but no significant change in Cm was observed up to 100 msec after the flash. There was, however, a Ca2+-activated inward current (not shown), which, in this example, corresponded to a peak increase in Gm of 0.26 nS (Fig. 3A, bottom panel). Subsequent flashes in the same calyx elevated [Ca2+]i to 6.3 and 19.2 μm, and induced increases in Cm of 262 and 632 fF, as analyzed in a time window of 30-50 msec after the flash (Fig. 3B,C). The membrane conductance also increased with flashes to higher [Ca2+]i (Fig. 3B,C; bottom panels). Note, however, that in Figure 3A, a significant increase in Gm was not accompanied by a change in Cm, indicating that the occurrence of changes in Gm and Cm were not strictly correlated.
Figure 3D shows the Cm increases as a function of postflash [Ca2+]i for n = 45 calyces. Below 5 μm [Ca2+]i, the rises in Cm were small or, in some cases, absent. However, a line fit to the data points >10 μm gave a slope close to 0 (0.04 fF/μm) (Fig. 3D, dotted line), indicating that the amplitude of the Cm increases reached maximal values at a [Ca2+]i of >10 μm. This is expected for models that assume a series of Ca2+ binding steps, followed by an irreversible fusion reaction (Thomas et al., 1993; Heinemann et al., 1994; Voets, 2000). Below a critical [Ca2+]i, the rate of vesicle fusion is slow, and thus depletion of the entire pool of readily releasable vesicles is not expected within the time of analysis, giving rise to submaximal Cm responses. Indeed, the model of cooperative Ca2+ binding and vesicle fusion (see Fig. 7E) predicts a saturating behavior of the cumulative amount of vesicle fusion (Fig. 3D, gray line), with submaximal responses <10 μm. The model parameters for this prediction were as described by Schneggenburger and Neher (2000).
The Ca2+ dependence of the Cm changes shown in Figure 3D suggest that these capacitance signals resulted from vesicle fusion in the nerve terminal, and furthermore, that step-like elevations of [Ca2+]i >10 μm exhausted a pool of readily releasable vesicles. The average value of Cm increases for [Ca2+]i steps in the range of 10-55 μm was 256 ± 125 fF (n = 55 flash responses). When only flashes from cells with monoexponential charging transients were averaged (Fig. 3D, gray data points), the Cm increase for [Ca2+]i of >10 μm was virtually identical (258 ± 110 fF; n = 12 flash responses). Considering the estimated Cm change for a single small synaptic vesicle (65 aF) (Sun et al., 2002), the average Cm increase between cells corresponds to the fusion of ∼4000 vesicles.
Cross-depletion between Ca2+ uncaging and presynaptic depolarization
We sought to confirm in independent experiments that [Ca2+]i steps >10 μm depleted the pool of readily releasable vesicles. We therefore made cross-depletion experiments, in which the response to control flashes that elevated [Ca2+]i to 10-15 μm were compared with combined stimuli consisting of strong, pool-depleting presynaptic depolarizations and flashes (Fig. 4A-C). In Figure 4A, a control flash elevated [Ca2+]i to 13.7 μm, and induced an increase in Cm of 239 fF. After a waiting time of 120 sec, a combined stimulus, consisting of a depolarization to 0 mV for 32 msec, followed by a flash, was applied. The depolarization activated a Ca2+ current of 2.3 nA, which elevated Cm by 248 fF, as measured in a short time window (15 msec) between the end of the depolarization, and the flash (Fig. 4B). A flash with the same intensity as the control flash, given 28 msec after the depolarization, did not further increase Cm. On the contrary, the Cm trace decayed slightly during the first tens of milliseconds after the flash (Fig. 4B), an effect that might be caused by the relaxation of conductances after the prolonged (32 msec) presynaptic depolarization to 0 mV. In general, the Cm increases measured in a time window of 30-50 msec after the combined stimuli of a depolarization and a flash agreed well with the responses to the control flashes (Fig. 4C, compare left and right bars and data points for individual cells). This indicates that a pool of readily releasable vesicles was exhausted by flashes that elevated [Ca2+]i to 10-15 μm.
To further confirm this conclusion, we performed experiments with shorter depolarizations, which are expected to release a smaller fraction of the pool of readily releasable vesicles (Sakaba and Neher, 2001; Sun and Wu, 2001). We used 8 msec depolarizations to 0 mV, preceded by a short (4 msec) period at +80 mV (Fig. 4E). These depolarizations increased Cm to an average percentage of 50 ± 32% of the corresponding control response (Fig. 4D-F). The responses to the combined stimuli were again similar to the ones of the corresponding control flashes (Fig. 4D-F). This was observed in all of the cells in which partial pool depletion was investigated (Fig. 4F, individual data points). Note, however, that the absolute values of Cm changes showed a considerable scatter between cells (Fig. 4F, left bar) (range, 167-630 fF; 338 ± 136 fF; mean ± SD). This suggests that the size of the readily releasable vesicle pool is variable between nerve terminals (see Discussion).
Ca2+ dependence of the rate of vesicle pool depletion
Having established that step-like [Ca2+]i elevations to 10-15 μm depleted a pool of readily releasable vesicles, we next analyzed the time course of cumulative vesicle fusion and its Ca2+ dependence, by fitting the rise of Cm changes after Ca2+ uncaging with exponential functions (Fig. 5). In 44 of 65 flash responses, the rise of Cm was well fitted by single-exponential functions. An example trace is shown in Figure 5A, with the superimposed single-exponential fit (gray line) with time constant of 2.6 msec. In other flash responses (21 of 65), double-exponential fits better described the rise of Cm after Ca2+ uncaging. In the example of Figure 5B, the difference between single- and double-exponential fits was not large, however. The example shown in Figure 5C shows a better separation between a putative fast and slow component of vesicle fusion. In this case, the back-extrapolated monoexponential fit gave an x-axis intercept at a time before the flash was given (Fig. 5C, gray line), clear evidence that the rise in Cm was not adequately described by a single exponential. In this example, a double-exponential function with fast and slow time constants of 1.5 and 19.4 msec fitted the rise in Cm well (Fig. 5C, black line). However, such a clear indication of a fast and a slow component of vesicle fusion was observed in only 7 of 65 flash responses.
Figure 5D shows a Cm response to a flash that elevated [Ca2+]i to 40 μm. At these higher [Ca2+]i, the time course of Cm changes were faster than the ones observed at 10-15 μm [Ca2+]i. In the example of Figure 5D, a single-exponential fit indicated a time constant of 0.6 msec; note, however, that this time constant is at the limit of the resolution of Cm measurements, which used a 2 kHz sine wave.
We plotted the time constants of cumulative vesicle fusion, derived from exponential fits to the rise in Cm (Fig. 5) as a function of the measured [Ca2+]i after flashes (Fig. 6A). This was done separately for responses with single-exponential rise (Fig. 6A, circles) and for responses in which double-exponential fits were found adequate (triangles). In this plot, the time constants for the single-exponential fits and for the fast component of the double-exponential fits overlapped (Fig. 6A, circles and filled triangles), suggesting that they represent the kinetics of the same pool of readily releasable vesicles. These time constants showed a steep Ca2+ dependence: in a range of 6-10 μm [Ca2+]i, the average value was 13.4 ± 12.8 msec; at 10-15 μm [Ca2+]i, the time constant was 2.7 ± 2.3 msec. Finally, in a range of 30-55 μm [Ca2+]i, the pool was depleted with a time constant of 0.5 ± 0.3 msec (Fig. 6A, average symbols). The dotted line in the double-logarithmic plot of Figure 6A indicates a slope of 4.
The delays of the Cm responses as a function of [Ca2+]i are shown in Figure 6B. Delays were analyzed as the difference between the time at which the flash was triggered and the x-axis intercept of monoexponential fits to the Cm increase. Ca2+-dependent delays in the range of 0.5-4 msec were found. The delays and the time constants shown in Figure 6, A and B, were analyzed with a model that assumed the cooperative binding of five Ca2+ ions, followed by an irreversible fusion step (Fig. 7E) (Schneggenburger and Neher, 2000). Note that this model, which was previously derived to describe the relationship between transmitter release rates estimated by EPSC deconvolution and [Ca2+]i, gave a good prediction for the time course of vesicle pool depletion as measured by membrane capacitance (Fig. 6A, solid line). Also, the Ca2+ dependence of delays was compatible with the predictions of the five-site Ca2+ binding model (Fig. 6B), using the same parameter set as estimated previously (Schneggenburger and Neher, 2000).
Figure 6C plots the amplitude of the Cm changes, analyzed from the amplitude values obtained from exponential fits (Fig. 5). For 44 of 65 Cm responses that were adequately described by a single-exponential function, an amplitude of 248 ± 120 fF was found (Fig. 6C, average symbol with circle), in good agreement with the analysis of Cm increases in a time window of 30-50 msec after the flash (Fig. 3). The amplitude of the fast component in responses with a double-exponential rise (21 of 65 flashes) was 160 ± 111 fF (Fig. 6C, filled triangles and average data point with filled triangle). It is possible that many of the single-exponential fits had resulted from an insufficient separation between a fast and a slow component of vesicle fusion (see Discussion). In that case, a genuine fast component of transmitter release might have an average pool size of <200 fF, or <3000 vesicles.
Discussion
We used whole-cell capacitance measurements at the calyx of Held nerve terminals, combined with Ca2+ uncaging and Ca2+ imaging, to estimate the Ca2+-dependent kinetics of synaptic vesicle fusion. We find half-maximal Cm increases for step-like elevations of [Ca2+]i to 5 μm, and the Ca2+ dependence of the amplitude of Cm increases followed the prediction of a model of cooperative Ca2+ binding and vesicle fusion (Fig. 3D). The time course of cumulative vesicle fusion, analyzed by fitting exponential functions to the rise in Cm, showed a steep dependence on [Ca2+]i, with an average time constant of 2-3 msec in a range of 10-15 μm [Ca2+]i (Fig. 6A). Our estimate of the Ca2+ sensitivity of vesicle fusion on the basis of capacitance measurements agrees well with previous studies in which transmitter release was estimated from measurements of EPSCs (Bollmann et al., 2000; Schneggenburger and Neher, 2000). Together, these findings allow us to make inferences on the Ca2+-dependent kinetics of vesicle fusion at a CNS nerve terminal, as well as on the kinetic and equilibrium properties of Ca2+ binding to the Ca2+ sensor for vesicle fusion.
Comparison with previous estimates of release kinetics at the calyx of Held
At the calyx of Held, pool-depleting Ca2+ stimuli have previously been applied by prolonged presynaptic voltage-clamp depolarization (Sakaba and Neher, 2001; Sun and Wu, 2001; Taschenberger et al., 2002) or by Ca2+ uncaging (Bollmann et al., 2000; Schneggenburger and Neher, 2000; Felmy et al., 2003). Sun and Wu (2001) have measured Cm steps after presynaptic depolarizations of varying duration. They found maximal Cm increases of ∼400 fF, and an exponential function with time constant of 3 msec fitted the relationship between Cm amplitude and step length well. We observed somewhat smaller maximal Cm increases after Ca2+ steps >10 μm (256 ± 125 fF, mean ± SD) (Fig. 3D). With a conversion factor of 65 aF/vesicle (Sun et al., 2002), and assuming that the Cm signals resulted exclusively from the fusion of small synaptic vesicles, a Cm increase of 256 fF corresponds to ∼4000 vesicles, in good agreement with the average pool size from EPSC deconvolution analysis [3500 ± 1131 quanta; mean ± SD value from Sakaba and Neher (2001)]. We found, however, that the cell-to-cell variability of the maximal Cm increase was large, with a range of 100-600 fF between cells (Fig. 4F). This suggests that the readily releasable pool size is variable among calyces, with a coefficient of variation of ∼0.4-0.5. A similarly large variability of pool sizes was found by EPSC deconvolution analysis, with a range of 2040 to 5800 quanta (Sakaba and Neher, 2001).
Sakaba and Neher (2001) have used EPSC deconvolution analysis to measure transmitter release rates after prolonged presynaptic depolarization. They found a clearly biphasic release, with time constants of 2-3 msec and 10-30 msec estimated from biexponential fits to cumulative release rates. By fitting the rise of Cm increases after Ca2+ uncaging, we observed a time constant of 2-3 msec at 10-15 μm [Ca2+]i (Fig. 6A), indicating that the [Ca2+]i at the release sites must be in the range of 10-15 μm during voltage-clamp steps close to 0 mV (Sakaba and Neher, 2001; Sun and Wu, 2001). We also found evidence, in 21 of 65 responses, for a second component of vesicle fusion with a slower time constant (Figs. 5B,C, and 6A, open symbols). Thus, it is possible that a rapidly and a slowly releasable subpool of vesicles (Sakaba and Neher, 2001) are caused by different Ca2+ sensitivities and fusion rates between vesicles, as in chromaffin cells (Voets, 2000). However, the low rate of occurrence of Cm responses with a clearly biphasic rise precluded a more detailed analysis of the slow component. At present, we cannot entirely rule out that the Ca2+-activated conductance after Ca2+ uncaging (Fig. 2) affected the detection of a slow component of vesicle fusion in Cm measurements. Also, rapid endocytosis might partially mask a slow exocytotic component, although rapid endocytosis more likely takes place under conditions of weak stimulation (Sun et al., 2002).
Schneggenburger and Neher (2000) measured rates of transmitter release by EPSC deconvolution after presynaptic Ca2+ uncaging. They analyzed peak transmitter release rates, but restricted their analysis to the first 10 msec after a flash. They described the intracellular Ca2+ dependence of peak transmitter release rates by a model of cooperative Ca2+ binding, using their pool size estimate of 1800 ± 870 quanta. In the present approach, we measured the time course of vesicle pool depletion (Fig. 5). The Ca2+ dependence of the single-exponential time constants, and the one of the fast time constants in case of double-exponential fits agreed well with the prediction of the previous model (Fig. 6A, filled black data points and solid line). How many vesicles can be released rapidly after Ca2+ uncaging? If we assume that release after Ca2+ uncaging normally occurs in two kinetically distinct phases, but that the separation between a fast and a slow component was often hampered by the relatively poor resolution of Cm measurements (see above), then it would be appropriate to use the amplitude of the fast component of Cm increases (160 ± 111 fF; n = 21) (Fig. 6C, average data point with filled triangle). This indicates that a mean number of ∼2500 vesicles can fuse with submillisecond kinetics, in reasonable agreement with the previous estimate from EPSC deconvolution (1800 ± 700) (Schneggenburger and Neher, 2000). Considering the mean number of ∼600 active zones for rat calyces of Held at this developmental stage (Meyer et al., 2001; Sätzler et al., 2002; Taschenberger et al., 2002), it is seen that approximately three to five vesicles can fuse within <1 msec at a given active zone, provided that [Ca2+]i is sufficiently high.
Comparison with ribbon-type synapses
The rate of vesicle pool depletion at the calyx of Held has a higher Ca2+ sensitivity than the one measured previously at ribbon-type synapses. Rates of pool depletion >1000 sec-1 were observed in retinal bipolar cells and in cochlear inner hair cells at [Ca2+]i of ∼150 and 100 μm, respectively (Heidelberger et al., 1994; Beutner et al., 2001), whereas at the calyx of Held, this rate is reached at 30 μm (Fig. 6A). The functional consequences of this differential Ca2+ sensitivity of vesicle fusion between synapses are not fully understood at present. It is possible that CNS synapses with conventional active zones generally have a higher Ca2+ sensitivity than cochlear and retinal sensory synapses with ribbon-like ultrastructure. To test this hypothesis, the Ca2+ sensitivity of vesicle fusion at other CNS synapses needs to be evaluated. Another possibility is that the Ca2+ sensitivity of vesicle fusion is higher in synapses with high release probability (p) than in low p synapses. However, other factors, like the exact colocalization of vesicles and Ca2+ channels also have a large influence on p (Neher, 1998; Rozov et al., 2001; Meinrenken et al., 2002).
Inferences on the equilibrium properties of the Ca2+ sensor for vesicle fusion
Because Synaptotagmin-1 or related isoforms are likely candidates for the Ca2+ sensor for phasic transmitter release (Geppert et al., 1994; Fernández-Chacón et al., 2001), it is desirable to correlate the intracellular Ca2+ sensitivity of synaptic vesicle fusion with the known steady-state Ca2+ binding parameters of Synaptotagmin (Brose et al., 1992; Davis et al., 1999; Fernández-Chacón et al., 2001; Sugita et al., 2002). To allow for such a comparison, we simulated the Ca2+-dependent rates of pool depletion, as well as the steady-state Ca2+ binding (Fig. 7), for the model of cooperative Ca2+ binding and vesicle fusion used here (E). Figure 7B shows traces of cumulative vesicle fusion, simulated with the parameters given in the legend to Figure 6. A time constant of vesicle pool depletion of ∼10 msec fitted the trace of cumulative vesicle fusion for a [Ca2+] step to 8.8 μm (Fig. 7B, middle trace). This time constant indicates a rate of pool depletion of only ∼100 sec-1; a small fraction of the estimated maximal value (γ) of 6000 sec-1. However, simulation of the amount of Ca2+ binding for the kinetic scheme in Figure 7E, made in the absence of the irreversible fusion step (see Materials and Methods), indicates that at 8.8 μm [Ca2+], >70% of the Ca2+ binding sites are occupied at steady state (Fig. 7C, middle trace). Thus, the occupancy of the Ca2+-binding sites shows a ∼10-fold leftward shift on the Ca2+ concentration axis with respect to the rate of vesicle pool depletion, with half-maximal values of 6.6 and 56 μm [Ca2+], respectively (Fig. 7D). If this shift, predicted here by a simple kinetic model of cooperative Ca2+ binding and vesicle fusion, is a general property of the Ca2+ sensor for vesicle fusion, then it must be considered when functional data measuring the rates of vesicle pool depletion are compared with steady-state Ca2+-binding characteristics of C2-domain proteins.
The calculated steady-state Ca2+ binding showed a steep cooperativity (Fig. 7D, open circles) (Hill coefficient of 3.7), as expected from the cooperativity implemented in the model shown in Figure 7E. Interestingly, Ca2+ binding to Synaptotagmins in the presence of phospholipids also shows a steep cooperativity (Fernández-Chacón et al., 2001). We also calculated the half-maximal Ca2+ occupancies for models of cooperative Ca2+ binding and vesicle fusion, using the published model parameters for inner hair cells (Beutner et al., 2001) and bipolar cells (Heidelberger et al., 1994). The resulting half-maximal values were 12.6 μm for the inner hair cells and 36 μm for the retinal bipolar cells, comparing with a value of 6.6 μm for this study (Fig. 7D, open circles). Thus, the deduced steady-state Ca2+ binding affinity is highest for the calyx of Held, as expected from the comparison of the kinetics of vesicle pool depletion among the three types of synapses (see above). In general, the calculated steady-state Ca2+ binding affinities for the three types of synapses are within the range of previously reported Ca2+-binding affinities of Synaptotagmin-1 in the presence of different phospholipids (∼5 to >30 μm) (Brose et al., 1992; Davis et al., 1999; Fernández-Chacón et al., 2001).
What are the molecular mechanisms for “tuning” the Ca2+ sensitivity of vesicle fusion in different synapses? One possibility is that Synaptotagmin isoforms are differentially expressed between synapses (Chapman, 2002; Südhof, 2002), given that Synaptotagmin isoforms have different Ca2+ sensitivities (Sugita et al., 2002). Next, it is possible that posttranslational modifications of Synaptotagmins lead to differences in the function of these proteins. Another possibility is that proteins associated with the core complex of SNARE (soluble N-ethylmaleimide-sensitive factor attachment protein receptor) proteins like Complexins modulate the Ca2+ sensitivity of vesicle fusion (Reim et al., 2001). Last but not least, the in vitro affinity of Ca2+ binding to Synaptogamins depends on the phospholipid composition of the membrane (Brose et al., 1992; Fernández-Chacón et al., 2001), which in turn might differ between cells, or in specialized membrane regions (Simons and Ikonen, 1997). It will be interesting to find out about the molecular mechanisms that determine the differential Ca2+ sensitivity of vesicle fusion between synapses and to explore the functional consequences of differential Ca2+ sensitivity for the short-term modulation of transmitter release.
Footnotes
This work was supported by Deutsche Forschungsgemeinschaft Grants Schn 451/4-1 and Sonder-forschungsbereich-406. R.S. is a Heisenberg fellow of the Deutsche Forschungsgemeinschaft. We thank Erwin Neher for helpful discussions throughout the course of this study and Felix Felmy, Tobias Moser, Erwin Neher, Takeshi Sakaba, Holger Taschenberger, and Henrique von Gersdorff for comments on this manuscript.
Correspondence should be addressed to Dr. Ralf Schneggenburger, Arbeitsgruppe Synaptische Dynamik und Modulation and Abteilung Membranbiophysik, Max-Planck-Institut für Biophysikalische Chemie, Am Fassberg 11, D-37077 Göttingen, Germany. E-mail: rschneg@gwdg.de.
Copyright © 2003 Society for Neuroscience 0270-6474/03/237059-10$15.00/0
References
- Adler EM, Augustine GJ, Duffy SN, Charlton MP ( 1991) Alien intracellular calcium chelators attenuate neurotransmitter release at the squid giant synapse. J Neurosci 11: 1496-1507. [DOI] [PMC free article] [PubMed] [Google Scholar]
- Almers W ( 1994) Synapses. How fast can you get? Nature 367: 682-683. [DOI] [PubMed] [Google Scholar]
- Beutner D, Voets T, Neher E, Moser T ( 2001) Calcium dependence of exocytosis and endocytosis at the cochlear inner hair cell afferent synapse. Neuron 29: 681-690. [DOI] [PubMed] [Google Scholar]
- Bollmann JH, Sakmann B, Borst JGG ( 2000) Calcium sensitivity of glutamate release in a calyx-type terminal. Science 289: 953-957. [DOI] [PubMed] [Google Scholar]
- Borst JGG, Sakmann B ( 1998) Calcium current during a single action potential in a large presynaptic terminal of the rat brainstem. J Physiol (Lond) 506: 143-157. [DOI] [PMC free article] [PubMed] [Google Scholar]
- Borst JGG, Helmchen F, Sakmann B ( 1995) Pre- and postsynaptic whole-cell recordings in the medial nucleus of the trapezoid body of the rat. J Physiol (Lond) 489: 825-840. [DOI] [PMC free article] [PubMed] [Google Scholar]
- Brose N, Petrenko AG, Südhof TC, Jahn R ( 1992) Synaptotagmin: a calcium sensor on the synaptic vesicle surface. Science 256: 1021-1025. [DOI] [PubMed] [Google Scholar]
- Chapman ER ( 2002) Synaptotagmin: a Ca2+ sensor that triggers exocytosis? Nat Rev Mol Cell Biol 3: 1-11. [DOI] [PubMed] [Google Scholar]
- Davis AF, Bai J, Fasshauer D, Wolowick MJ, Lewis JL, Chapman ER ( 1999) Kinetics of synaptotagmin responses to Ca2+ and assembly with the core SNARE complex onto membranes. Neuron 24: 363-376. [DOI] [PubMed] [Google Scholar]
- Felmy F, Neher E, Schneggenburger R ( 2003) Probing the intracellular calcium sensitivity of transmitter release during synaptic facilitation. Neuron 37: 801-811. [DOI] [PubMed] [Google Scholar]
- Fernández-Chacón R, Konigstorfer A, Gerber SH, Garcia J, Matos MF, Stevens CF, Brose N, Rizo J, Rosenmund C, Sudhof TC ( 2001) Synaptotagmin I functions as a calcium regulator of release probability. Nature 410: 41-49. [DOI] [PubMed] [Google Scholar]
- Forsythe ID ( 1994) Direct patch recording from identified presynaptic terminals mediating glutamatergic EPSCs in the rat CNS, in vitro. J Physiol (Lond) 479: 381-387. [DOI] [PMC free article] [PubMed] [Google Scholar]
- Geppert M, Goda Y, Hammer RE, Li C, Rosahl TW, Stevens CF, Südhof TC ( 1994) Synaptotagmin I: a major Ca2+ sensor for transmitter release at a central synapse. Cell 79: 717-727. [DOI] [PubMed] [Google Scholar]
- Gillis KD ( 2000) Admittance-based measurement of membrane capacitance using the EPC-9 patch-clamp amplifier. Pflügers Arch 439: 655-664. [DOI] [PubMed] [Google Scholar]
- Grynkiewicz G, Poenie M, Tsien R ( 1985) A new generation of Ca2+ indicators with greatly improved fluorescence properties. J Biol Chem 260: 3440-3450. [PubMed] [Google Scholar]
- Heidelberger R, Heinemann C, Neher E, Matthews G ( 1994) Calcium dependence of the rate of exocytosis in a synaptic terminal. Nature 371: 513-515. [DOI] [PubMed] [Google Scholar]
- Heinemann C, Chow RH, Neher E, Zucker RS ( 1994) Kinetics of the secretory response in bovine chromaffin cells following flash photolysis of caged Ca2+ Biophys J 67: 2546-2557. [DOI] [PMC free article] [PubMed] [Google Scholar]
- Hsu S-F, Augustine GJ, Jackson MB ( 1996) Adaptation of Ca2+-triggered exocytosis in presynaptic terminals. Neuron 17: 501-512. [DOI] [PubMed] [Google Scholar]
- Hugues M, Romey G, Duval D, Vincent J, Lazdunski M ( 1982) Apamin as a selective blocker of the calcium-dependent potassium channel in neuroblastoma cells: voltage-clamp and biochemical characterization of the toxin receptor. Proc Natl Acad Sci USA 79: 1308-1312. [DOI] [PMC free article] [PubMed] [Google Scholar]
- Johnson SW, Seutin V ( 1997) Bicuculline methiodide potentiates NMDA-dependent burst firing in rat dopamine neurons by blocking apamin-sensitive Ca2+-activated K+ currents. Neurosci Lett 231: 13-16. [DOI] [PubMed] [Google Scholar]
- Katz B ( 1969) The release of neural transmitter substances. Liverpool, UK: Liverpool UP.
- Llinás R, Sugimori M, Silver RB ( 1992) Microdomains of high calcium concentration in a presynaptic terminal. Science 256: 677-679. [DOI] [PubMed] [Google Scholar]
- Meinrenken C, Borst JGG, Sakmann B ( 2002) Calcium secretion coupling at calyx of Held governed by nonuniform channel-vesicle topography. J Neurosci 22: 1648-1667. [DOI] [PMC free article] [PubMed] [Google Scholar]
- Meyer AC, Neher E, Schneggenburger R ( 2001) Estimation of quantal size and number of functional active zones at the calyx of Held synapse by nonstationary EPSC variance analysis. J Neurosci 21: 7889-7900. [DOI] [PMC free article] [PubMed] [Google Scholar]
- Neher E ( 1998) Vesicle pools and Ca2+-microdomains: new tools for understanding their roles in neurotransmitter release. Neuron 20: 389-399. [DOI] [PubMed] [Google Scholar]
- Reim K, Mansour M, Varoqueaux F, McMahon HT, Sudhof TC, Brose N, Rosenmund C ( 2001) Complexins regulate a late step in Ca2+-dependent neurotransmitter release. Cell 104: 71-81. [DOI] [PubMed] [Google Scholar]
- Roberts WM ( 1994) Localization of calcium signals by a mobile calcium buffer in frog saccular hair cells. J Neurosci 14: 3246-3262. [DOI] [PMC free article] [PubMed] [Google Scholar]
- Rozov A, Burnashev N, Sakmann B, Neher E ( 2001) Transmitter release modulation by intracellular Ca2+ buffers in facilitating and depressing nerve terminals of pyramidal cells in layer 2/3 of the rat neocortex indicates a target cell-specific difference in presynaptic calcium dynamics. J Physiol (Lond) 531: 807-826. [DOI] [PMC free article] [PubMed] [Google Scholar]
- Sakaba T, Neher E ( 2001) Calmodulin mediates rapid recruitment of fast-releasing synaptic vesicles at a calyx-type synapse. Neuron 32: 1119-1131. [DOI] [PubMed] [Google Scholar]
- Sätzler K, Söhl LF, Bollmann JH, Borst JGG, Frotscher M, Sakmann B, Lübke JH ( 2002) Three-dimensional reconstruction of a calyx of Held and its postsynaptic principal neuron in the medial nucleus of the trapezoid body. J Neurosci 22: 10567-10579. [DOI] [PMC free article] [PubMed] [Google Scholar]
- Schikorski T, Stevens CF ( 2001) Morphological correlates of functionally defined synaptic vesicle populations. Nat Neurosci 4: 391-395. [DOI] [PubMed] [Google Scholar]
- Schneggenburger R, Neher E ( 2000) Intracellular calcium dependence of transmitter release rates at a fast central synapse. Nature 406: 889-893. [DOI] [PubMed] [Google Scholar]
- Simon SM, Llinás RR ( 1985) Compartmentalization of the submembrane calcium activity during calcium influx and its significance in transmitter release. Biophys J 48: 485-498. [DOI] [PMC free article] [PubMed] [Google Scholar]
- Simons K, Ikonen E ( 1997) Functional rafts in cell membranes. Nature 387: 569-572. [DOI] [PubMed] [Google Scholar]
- Südhof TC ( 2002) Synaptotagmins: why so many? J Biol Chem 277: 7629-7632. [DOI] [PubMed] [Google Scholar]
- Sugita S, Shin O-H, Han W, Lao Y, Südhof TC ( 2002) Synaptotagmins form a hierarchy of exocytotic Ca2+ sensors with distinct Ca2+ affinities. EMBO J 21: 270-280. [DOI] [PMC free article] [PubMed] [Google Scholar]
- Sun J-Y, Wu L-G ( 2001) Fast kinetics of exocytosis revealed by simultaneous measurements of presynaptic capacitance and postsynaptic currents at a central synapse. Neuron 30: 171-182. [DOI] [PubMed] [Google Scholar]
- Sun JY, Wu X-S, Wu L-G ( 2002) Single and multiple vesicle fusion induce different rates of endocytosis at a central synapse. Nature 417: 555-559. [DOI] [PubMed] [Google Scholar]
- Taschenberger H, Leao RM, Rowland KC, Spirou GA, von Gersdorff H ( 2002) Optimizing synaptic architecture and efficiency for high-frequency transmission. Neuron 36: 1127-1143. [DOI] [PubMed] [Google Scholar]
- Thomas P, Wong JG, Lee AK, Almers W ( 1993) A low affinity Ca2+ receptor controls the final steps in peptide secretion from pituitary melanotrophs. Neuron 11: 93-104. [DOI] [PubMed] [Google Scholar]
- Tucker T, Fettiplace R ( 1996) Monitoring calcium in turtle hair cells with a calcium-activated potassium channel. J Physiol (Lond) 494: 613-626. [DOI] [PMC free article] [PubMed] [Google Scholar]
- Voets T ( 2000) Dissection of three Ca2+-dependent steps leading to secretion in chromaffin cells from mouse adrenal slices. Neuron 28: 537-545. [DOI] [PubMed] [Google Scholar]
- Wadiche JI, Jahr CE ( 2001) Multivesicular release at climbing fiber-Purkinje cell synapses. Neuron 32: 301-313. [DOI] [PubMed] [Google Scholar]
- Xu-Friedman MA, Harris KM, Regehr WG ( 2001) Three-dimensional comparison of ultrastructural characteristics at depressing and facilitating synapses onto cerebellar Purkinje cells. J Neurosci 21: 6666-6672. [DOI] [PMC free article] [PubMed] [Google Scholar]
- Yamada WM, Zucker RS ( 1992) Time course of transmitter release calculated from simulations of a calcium diffusion model. Biophys J 61: 671-682. [DOI] [PMC free article] [PubMed] [Google Scholar]
- Zucker RS ( 1992) Effects of photolabile calcium chelators on fluorescent calcium indicators. Cell Calcium 13: 29-40. [DOI] [PubMed] [Google Scholar]